The India Climate Observatory

Commentary, action and research on climate and development in India

  • Home
  • About
  • Monsoon 2018
  • Current
  • Bulletin
  • Contact
  • Announcements

South India’s water emergency

April 11, 2017 by Climate portal editor Leave a Comment

ICP_res_20170410_topBy the end of the first week of April 2017, the most current and reliable indicator for stored water in south India showed how dire the situation has become. And the South-West monsoon is still about eight weeks away. The weekly data sheet on the stored water quantities in the 91 major reservoirs of India, which is maintained and released by the Central Water Commission, has in the 6 April 2017 release shown the scale of the water emergency.

Of the 31 reservoirs in the southern region (Kerala, Tamil Nadu, Karnataka, Telengana and Andhra Pradesh) that are among the major reservoirs of India, 18 have stored water that is less than 15% of their full capacities.

These 18 are (ranked by least water stored):
Nagarjuna Sagar, APTG, 0.00%
Sholayar, TN, 0.00%
Almatti, KAR, 0.03%
Kabini, KAR, 2.25%
Vanivilas Sagar, KAR, 2.74%
Tungabhadra, KAR, 3.21%
Vaigai, TN, 4.07%
Parambikulam, TN, 5.00%
Malaprabha (Renuka), KAR, 5.56%
Hemavathy, KAR, 5.72%
Mettur (Stanley), TN, 6.72%
Periyar, KER, 6.94%
Bhadra, KAR, 9.02%
Lower Bhawani, TN, 9.09%
Srisailam, APTG, 9.44%
Krishnaraja Sagar, KAR, 11.44%
Malapmuzha, KER, 11.61%
Aliyar, TN, 14.74%
(TN is Tamil Nadu, KER is Kerala, KAR is Karnataka, APTG is Andhra Pradesh and Telengana)

ICP_south_water_20170411

Using a municipal average of about 400 litres per day per household that is a typical designed supply (not delivered, for that’s another tale), how much water does this allow for the 60.51 million households of the southern region until the monsoon begins?

Tamil Nadu has 18.46 million households, Kerala has 7.83 million, Karnataka has 13.3 million, Andhra Pradesh and Telengana have 20.92 million. These together need 24.2 billion litres a day or, in reservoir storage terms, 0.024 billion cubic metres (bcm) a day. The 31 major reservoirs of southern India together have, as of 6 April 2017, 6.583 bcm. From this quantity is taken water for industrial, agricultural and commercial use.

These uses are given priority or water stocks are secured (never mind allocation and metering) especially by industry. Normally, what remains for household use is about a third of the available stock. This leaves, as on 6 April, about 2.19 bcm for household use, which will suffice the 60.51 million households of south India for about 90 days – but only provided, and this is the stringent, non-negotiable condition that must be enforced, all households especially urban keep within the 400 litres per household per day limit.

The situation does not improve even if the monsoon arrives on time and the first weeks deliver normal rainfall. It is only by July 5-15 that reservoir water stocks begin trending upwards. This is where the 90-day restricted supply can take south India to. But only if immediate and strict rationing is imposed, as it should have been, to allow for climatological variance, by 1 March 2017.

Filed Under: Latest Tagged With: Andhra Pradesh, Bharat, drought, India, Karnataka, Kerala, reservoir, Tamil Nadu, Telengana, water, water shortage, water supply

Monsoon weekly report card 2016

August 18, 2016 by Climate portal editor Leave a Comment

ICP_district_rainweeks_20160818

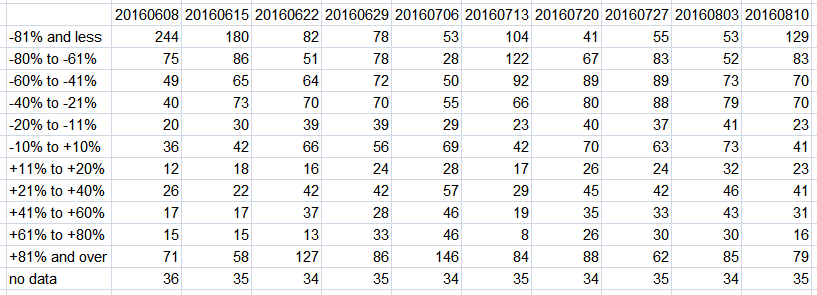
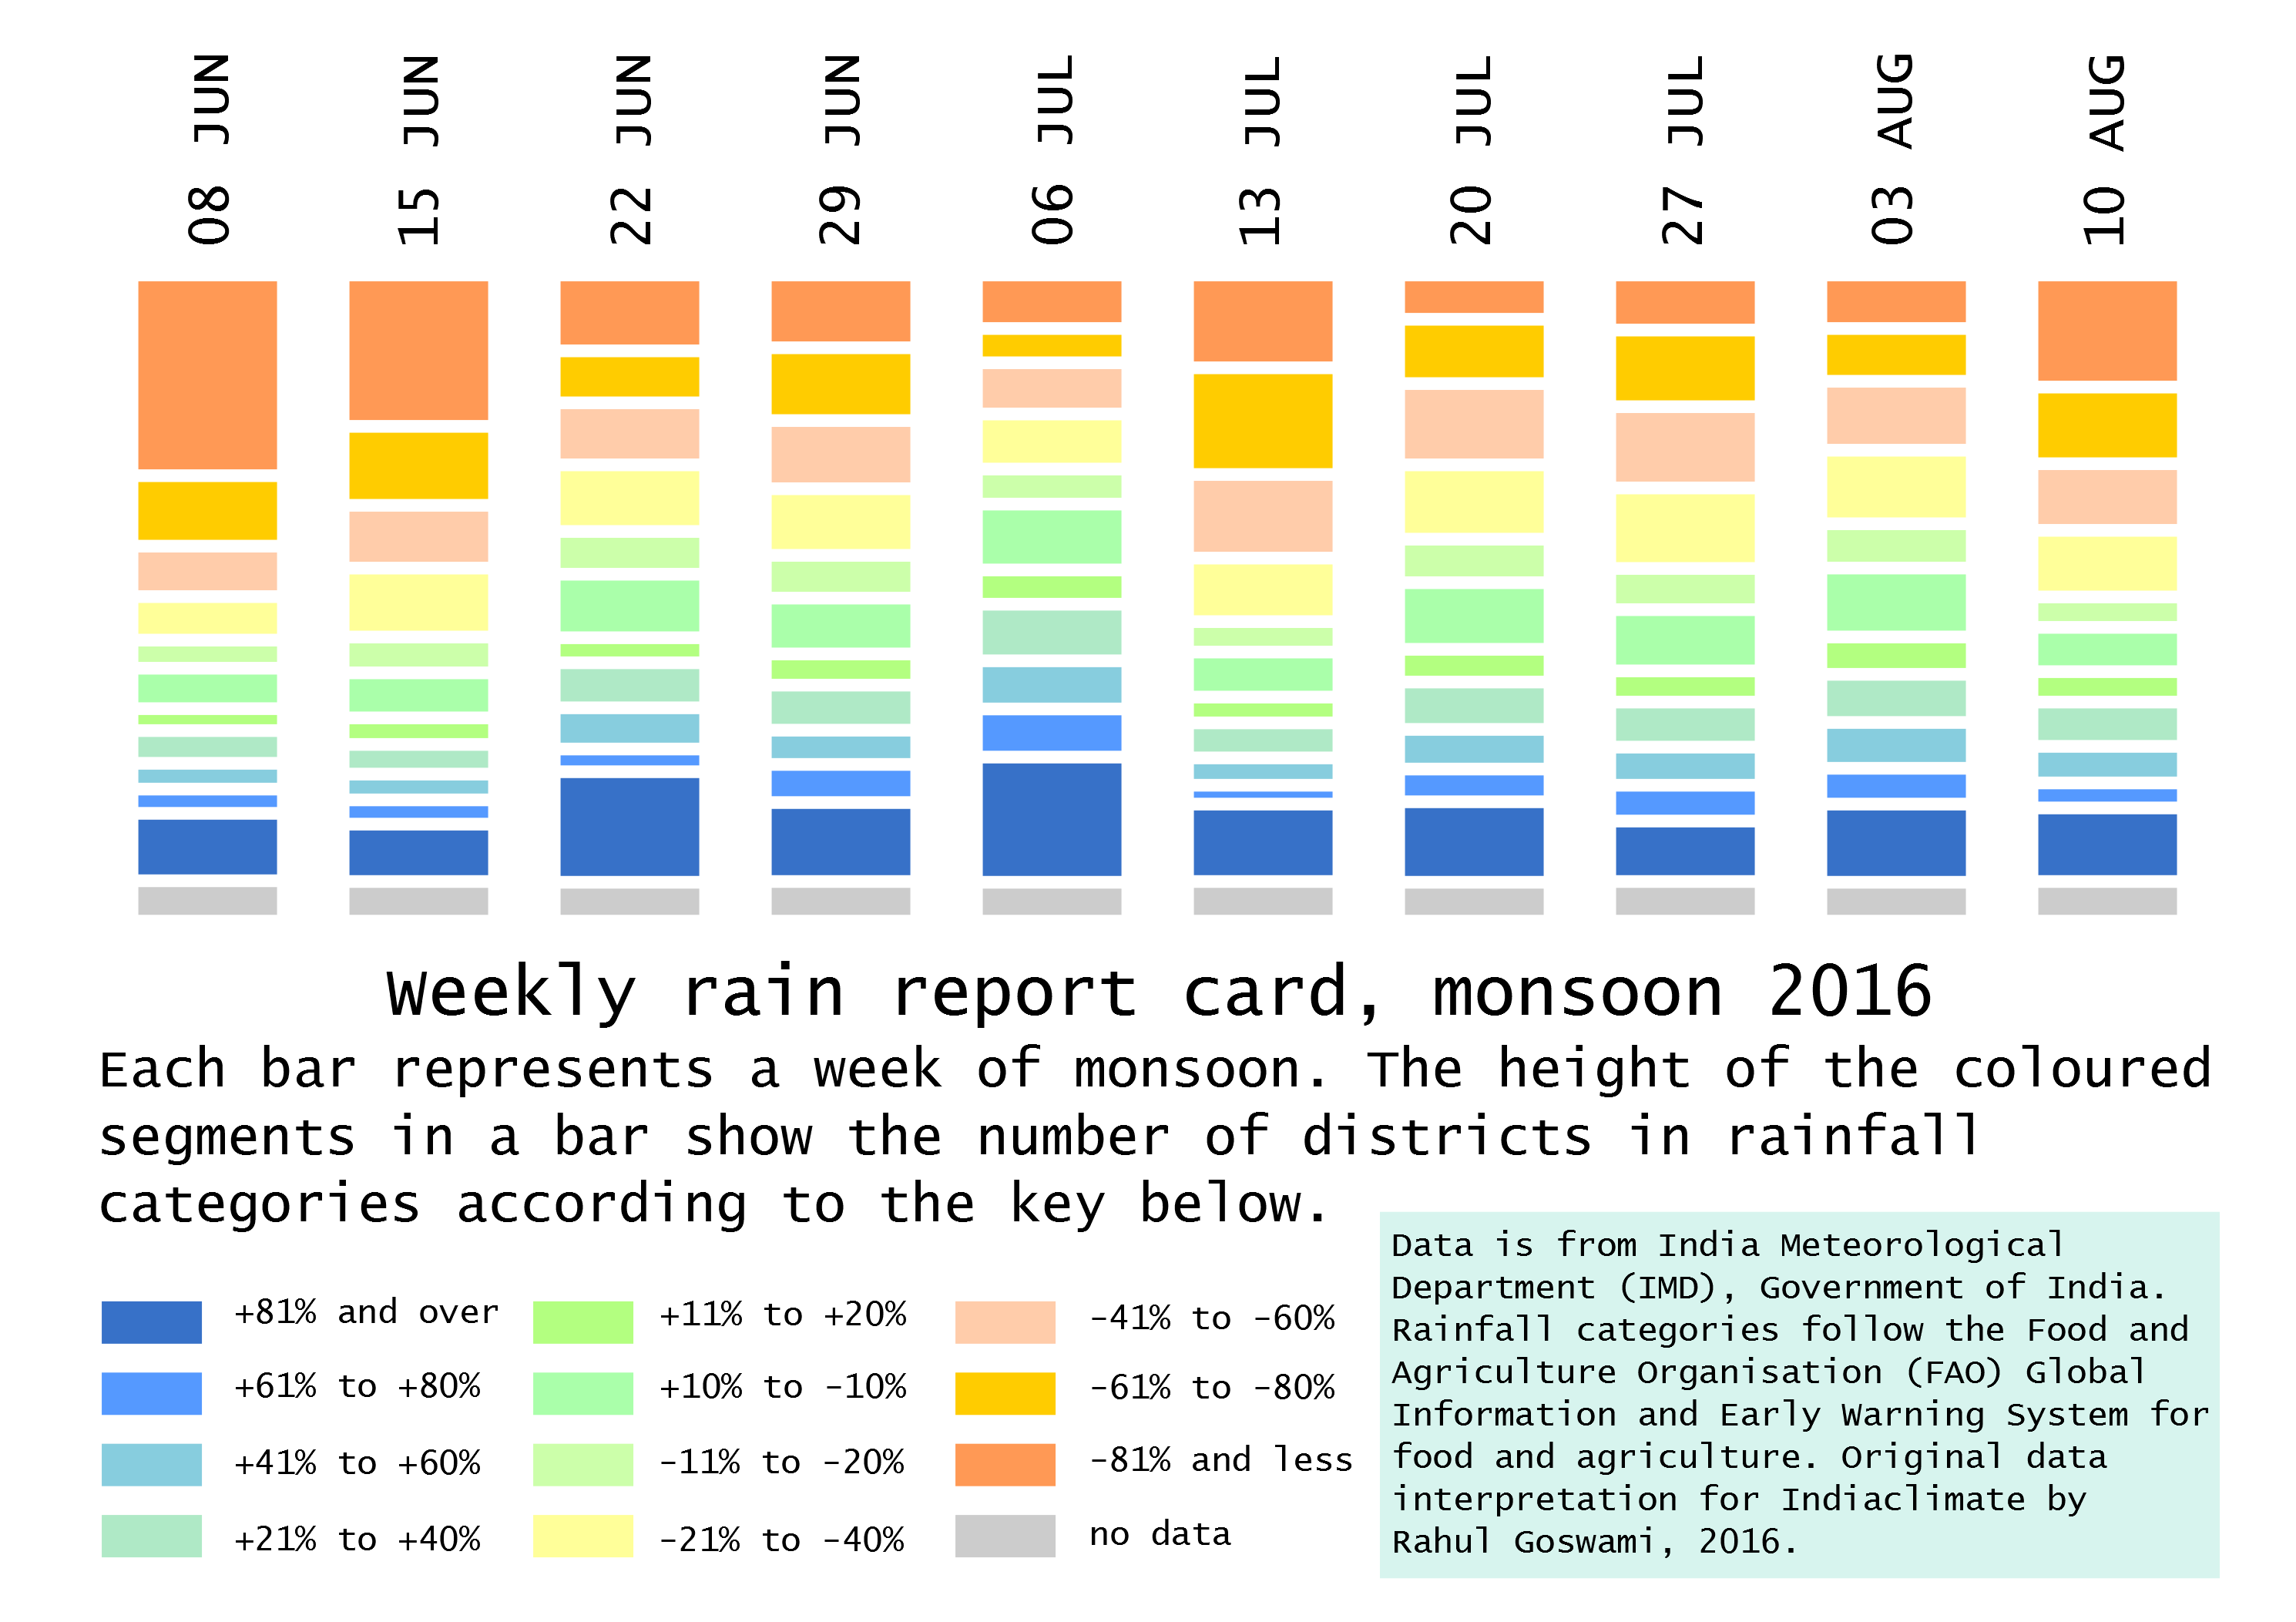
Employing the modified rainfall measurement categories, we have prepared a ‘report card’ for ten weeks of rainfall beginning with the week 02-08 June and continuing until the most recent which is the week of 04-10 August. This ‘report card’ is based on the recorded rainfall for each district and how much it varies from the normal for that particular week. This variation is portrayed by our ‘report card’ through the modified categories, which are designed to show more finely not merely deficient or excess rainfall, as the current categories do, but the degree of deficiencies or excesses for that district, for that week.

ICP_RG_2016_district_10rainweeks_20160818

Our indicator of eleven grades (compared with the four of the India Meteorological Department, IMD) uses the same weekly district data to provide greater detail about rainfall adequacy or lack. Using this method we can immediately see from the chart:

1. From the week ending 22 June there have been a large number of districts – between 20% and 40% of all districts for which data is available – included in the four categories that describe rainfall of +20% above the normal.

2. That notwithstanding the overall seasonal prediction of monsoon 2016 having thus far been proved correct, there are almost every week a sizeable number of districts falling in the three categories for deficient rainfall.

3. That for the ten weeks in our report card the number of districts in the -21% to -40% below normal band is greater than the number of districts in the band for +21% to +40%.

ICP_district_rainweeks_table_20160818

In the chart, each bar corresponds to a week of district rainfall readings, and that week of readings is split into eleven grades (plus one for no data). In this way, the tendency for administrations, citizens, the media and all those who must manage natural resources (particularly our farmers), to think in terms of an overall ‘deficit’ or an overall ‘surplus’ is halted.

We find that our modified rainfall categories are more informative at the district level – and therefore cumulatively at the state and meteorological sub-division levels too  – and can readily be adopted by administrations and planners.

In today’s concerns that have to do with the impacts of climate change, with the increasing variability of the monsoon season, and especially with the production of food crops, the IMD’s stock measurement – ‘normal’ is rainfall up to +19% above a given period’s average and also down to -19% from that same average, ‘excess’ is +20% rain and more, ‘deficient’ is -20% to -59% and ‘scanty’ is -60% to -99% – is no longer viable.

Filed Under: Latest, Monsoon 2016 Tagged With: 2016, district, IMD, India, monsoon

Heavy rain alert for Bihar, Uttar Pradesh

July 19, 2016 by Climate portal editor Leave a Comment

ICP_UP_BIH_20160719

Heavy and very heavy rainfall is expected today 19 July and until 22 July in Bihar, eastern Uttar Pradesh and sub-Himalayan West Bengal. The India Meteorological Department has issued a heavy rainfall alert for these regions.

These are the districts which will be the most affected:
In Bihar – Paschim Champaran, Gopalganj, Purbi Champaran, Siwan, Chhapra, Muzaffarpur, Sitamarhi, Madhubani, Darbhanga, Supaul, Saharsa, Madhepura, Purnia, Katihar, Kishanganj, Araria.
In Uttar Pradesh – Pilibhit, Shahjahanpur, Kheri, Hardoi, Sitapur, Shrawasti, Bahraich, Gonda, Balrampur, Basti, Sidharthnagar, Sant Kabir Nagar, Gorakhpur, Deoria, Maharajganj, Kushinagar.

ICP_ncmrwf_UP_bihar_20160719

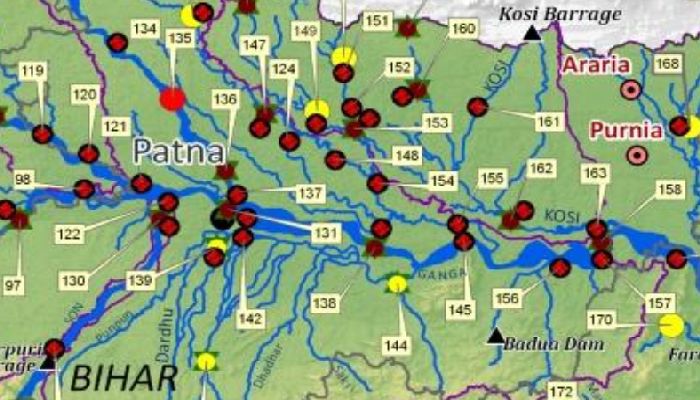
These are the five river sub-basins of the Ganga basin which are affected:
Gomti – including the Kathna, Sarayan, Kalyani rivers. Cities in this sub-basin – Sitapur, Hardoi, Lucknow, Rae Bareli, Sultanpur, Jaunpur.
Ghaghara – including the Saryu, Rapti, Chhoti Gandak rivers. Cities in this sub-basin – Lakhimpur, Shrawasti, Gonda, Faizabad, Basti, Gorakhpur, Kushinagar, Deoria, Siwan, Ballia.
Ghaghara confluence to Gomti confluence – including Chhoti Saryu and Mangal rivers. Cities in this sub-basin – Faizabad, Nizamabad, Azamgarh, Mau, Ghazipur, Buxar, Bhojpur, Chandauli.
Kosi – including Kamala, Pipra, Dhemra rivers. Cities in this sub-basin – Sheohar, Sitamarhi, Darbhanga, Supaul, Madhepura, Saharsa, Kishanganj, Khagaria.
Bhagirathi – including Fariyani Nadi and Kamla rivers. Cities in this sub-basin – Araria, Purnia, Sahibganj, Malda (West Bengal).

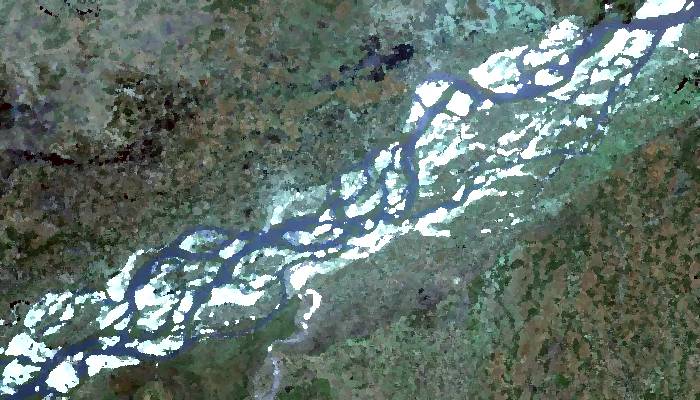
In the Middle Ganga plains, the water drainage lines govern the human occupancy of land, particularly the agricultural land and settlements. The rivers meet at acute angles and several tributaries form parallel or sub-parallel lines to the main stream. The major rivers that meet the main stream in the middle plain are the Gandak, the Kosi, the Sone and other small tributaries of Ganga like the Tons, the Karmansa, the Chatar, the Jargo, the Karnauti, the Khejuri on the west of the Sone and those on the east of the Sone are the Punpun, the Mohini and the Chandan.

Floods are recurring feature in this region particularly in the North Ganga plains. Almost all rivers in this middle plain develop a capacity to spill over in the monsoon period and are notoriously dynamic in character, particularly the Rapti, the Ghaghara, the Gandak, the Kosi, the Sone and the main Ganga itself.

Filed Under: Latest, Monsoon 2016 Tagged With: 2016, basin, Bihar, flood, Ganga, India, monsoon, rain, Uttar Pradesh

Rivers before states

June 29, 2016 by Climate portal editor Leave a Comment

2016-06-29_192703

Our view of where water falls during the monsoon and where it is used has tended to follow the administrative unit view. That is, which state has experienced normal, above normal or deficient rainfall or which meteorological division has experienced normal, above normal or deficient rainfall.

Such a view has obscured an important ground reality, and this is that when it rains, surface water follows the contours and topography of watersheds and third-level basins, themselves subsets of sub-basins and then river basins. Thus when rain falls, water collects and begins to flow, it is natural to look for where it flows and where it may be collected instead of whether it is measured on one side or another of an imaginary boundary, which is what a district or state boundary is.

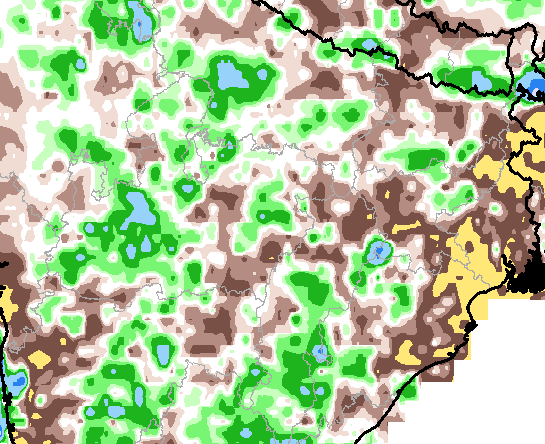
Rainfall anomalies in millimetres for 01-26 June. Greens/blues are above, browns/ochres are below. This section which includes Maharashtra, Madhya Pradesh, Chhattisgarh, Jharkhand, Bihar, Uttar Pradesh and part of Rajasthan shows how deficient areas are interspersed with excess areas. Watersheds could be the answer. Image source: NCEP, CPC

Rainfall anomalies in millimetres for 01-26 June. Greens/blues are above, browns/ochres are below. This section which includes Maharashtra, Madhya Pradesh, Chhattisgarh, Jharkhand, Bihar, Uttar Pradesh and part of Rajasthan shows how deficient areas are interspersed with excess areas. Watersheds could be the answer. Image source: NCEP, CPC

For everything that concerns water – which does mean everything that is essential to us: agriculture, forests, grassy regions and orchards, water that can be used for drinking, rural and urban settlements, commerce and industry – it is the group of hydrological structures we call a river basin (or sub-basin if the basin is a large one) that becomes the spatial region to study and plan for.

We have 36 states and union territories and also 36 meteorological divisions. These correspond with each other for most of the country and this correspondence, unnecessary and misleading, has led to our incorrect view of where rain falls and how it behaves where it falls. It has been a persistent error because I think of administrative inertia combined with the quite needless politics that surrounds river (or surface) and ground water.

Rain falls upon and rainwater collects and moves surface water then not in a taluka or district, but in a biophysical region which in one way we can describe as a river sub-basin or a large watershed. There are other pieces that make the whole: type of soil, the underlying geological strata, the mix of vegetation, the density and health of forests, the mix of cultivated crops, and the spread and density of human settlements (which use and alter these pieces).

Rainfall as estimated by Insat-3D and mapped in daily images for 14-28 June 2016. The background is the major river basins, not states (click for 386kb full res). The IMD's RAPID system has this monsoon introduced river basins as a base map. Images source: IMD/ISRO RAPID

Rainfall as estimated by Insat-3D and mapped in daily images for 14-28 June 2016. The background is the major river basins, not states (click for 386kb full res). The IMD’s RAPID system has this monsoon introduced river basins as a base map. Images source: IMD/ISRO RAPID

Table of river basins and sub-basins with sizes. Source: WRIS

Table of river basins and sub-basins with sizes. Source: WRIS

We know which our major rivers are, and those of us who are curious enough about the biophysical pieces that determine the characteristics of the regions in which we live also know the names of lesser rivers. How many river sub-basins are there in Bharat?

There are several answers because there have been (and continue to be) several authorities whose work it is to assess and measure water. Their methodologies differ somewhat each from the other, and that is why they not only give us differing numbers of major river basins but also – for those basins whose names are the same – differing sizes for a single river basin.

The Water Resources Information System (WRIS) which is the newest methodical system and which has come about because of our remote sensing expertise, has the most detailed information about our river basins. There are also the Central Water Commission, the National Commission for Integrated Water Resources Development Plan, the All India Soil and Land Use Survey, and the Central Ground Water Board.

Depending on their thematic orientation, these have (in their early forms which date back to the late 1940s) conducted detailed surveys of river basins and districts, outlined hydrological units, catchment zones, river valley projects, watersheds and have through such mechanisms steered (at times forced) states into recognising that river basins are at least as important as state boundaries.

How many are there? The WRIS informs us that there are 26 river basins and 102 sub-basins. Thus there are about three times as many sub-basins as there are states (and UTs) and there is one sub-basin for about every six districts. The biggest river basins are those of the Ganga (808,334 square kilometres), the Indus (till the border, 453,931 sq km), Godavari (302,063 sq km) and Krishna (254,743 sq km). The 102 sub-basins have a median size (excluding the very smallest) of 29,200 sq km and range from 1,676 sq km to 99,040 sq km for the Brahmaputra Upper and 125,084 sq km for the Yamuna Lower basins. The larger sub-basins (there are 14 whose geographic sizes are more than 50,000 sq km) contain dozens of watersheds each (there are some 3,200 in Bharat).

In the small hydrological units that we call watersheds, and in the larger ones we call sub-basins and river basins, is where the rain falls and where it needs to be measured and counted. This our earth sciences agencies already do. It is up to us and up to administrators of districts, states and particularly of all Class I and larger cities to alter the manner in which we look at the water that falls in this wondrous season upon our earth.

— Rahul Goswami

Filed Under: Latest, Monsoon 2016 Tagged With: India, monsoon, river, State, water

A race between monsoon and water

June 1, 2016 by Climate portal editor Leave a Comment

ICP_reservoirs_20160601

The southern states of Tamil Nadu, Karnataka, Andhra Pradesh and Telengana are in dire need of rainwater to replenish exceedingly low levels in reservoirs and all surface water structures. This water has come in the form of showers over the past five or six days, although the spread of the rainfall has been patchy, and whether rainwater has collected in significant quantities and percolated into sub-soil aquifers will not be known for at least another week.

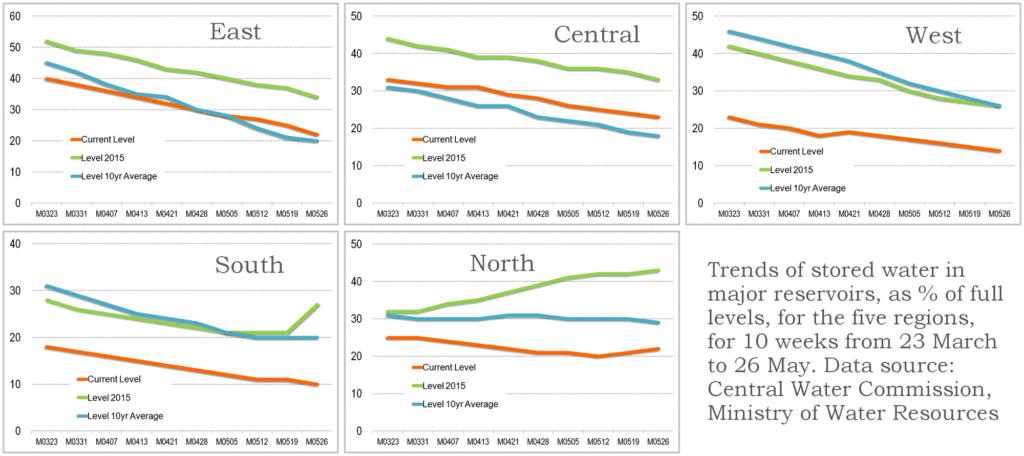
Until 31 May 2016 the stored water situation as measured by the quantities recorded in the 91 major reservoirs of India was very grave indeed. The most recent weekly bulletin of the Central Water Commission, which monitors what is called the ‘live storage status’ of the 91 major reservoirs, was issued on 26 May. Out of the 91 reservoirs, 37 have hydro-electric power plants which deliver electricity to the states in which these reservoirs are and to the national grid.

The total ‘live storage’ capacity of these 91 reservoirs is 157.799 billion cubic metres (BCM) which is estimated as being about 62% of the total storage capacity of 253.388 BCM that is estimated to have been built or created. But the 26 May bulletin placed the total storage available in these reservoirs at 26.816 BCM, which is 17% of the total of 91 reservoirs. At this time in 2015, the total stored water was 49.119 BCM and the average of the last 10 years of storage at this time was 33.764 BCM. Thus, the stored water for the week ended 26 May is 55% of the quantity stored in 2015 and 79% of the quantity stored at this time averaged for the last ten years.

ICP_reservoir_trends_20160601

The Northern region is Himachal Pradesh, Punjab and Rajasthan. There are six reservoirs with total live storage capacity of 18.01 BCM. By 26 May the total storage in these reservoirs was 3.91 BCM which is 22% of the total live storage capacity. The stored volume at the corresponding period in 2015 was 43% and the stored volume of the average corresponding period of the last ten years was 29%.

The Eastern region is Jharkhand, Odisha, West Bengal and Tripura. There are 15 reservoirs with total live storage capacity of 18.83 BCM. By 26 May the total live storage in these reservoirs was 4.22 BCM which is 22% of total live storage capacity. The stored volume at the corresponding period in 2015 was 34% and the stored volume of the average corresponding period of the last ten years was 20%.

The Western region is Gujarat and Maharashtra. There are 27 reservoirs with total live storage capacity of 27.07 BCM. By 26 May the total live storage in these reservoirs was 3.90 BCM which is 14% of total live storage capacity. The stored volume at the corresponding period in 2015 was 26% and the stored volume of the average corresponding period of the last ten years was also 26%.

The Central region is Uttar Pradesh, Uttarakhand, Madhya Pradesh and Chhattisgarh. There are 12 reservoirs with total live storage capacity of 42.30 BCM. By 26 May the total live storage available in these reservoirs is 9.59 BCM which is 23% of total live storage capacity. The stored volume at the corresponding period in 2015 was 33% and the stored volume of the average corresponding period of the last ten years was 18%.

The Southern region is Andhra Pradesh, Telengana, combined projects in both states, Karnataka, Kerala and Tamil Nadu. There are 31 reservoirs with total live storage capacity of 51.59 BCM. By 26 May the total live storage available in these reservoirs was 5.21 BCM which is 10% of total live storage capacity. The stored volume at the corresponding period in 2015 was 27% and the stored volume of the average corresponding period of the last ten years was 20%.

Filed Under: Latest, Monsoon 2016 Tagged With: 2016, Bharat, dams, India, monsoon, reservoir, water

Normal to good monsoon likely

April 10, 2016 by Climate portal editor 1 Comment

ICP_RG_monsoon_forecast1

The Indian summer monsoon in 2016 for the months of June to September will be normal to above normal in almost all the meteorological sub-divisions.

This is our reading of the seasonal climatic predictions provided by five different sources, amongst them the India Meteorological Department (IMD), which themselves are based on ensembles of forecasts.

Our outlook for the June to September 2016 period is based on an initial study of the three-monthly and seasonal predictions which are in the public domain, from the following agencies:

India monsoon 2016

A mapping of the forecast by one predictive climate model, for the May to July period. Source: NOAA/NCEP

The Climate Prediction and Monitoring Group of the India Meteorological Department (IMD), Ministry of Earth Sciences, Government of India; the  Climate Forecast System Version 2 (CFSv2) by the Climate Prediction Center of the National Centers for Environmental Prediction (NCEP), USA; regionalised Multi-Model Ensemble (NMME) forecasts from the Climate Prediction Center which are based on models of the NOAA and NASA; and the Meteorological ‘Met’ Office of Britain which is a World Meteorological Organisation climate research centre.

Combining the indications from this early set of forecasts we see that when typical monsoon conditions have set in over southern and peninsular India, the June and July rainfall patterns should be normal for June with an increase in average rainfall for July (in the southern peninsula, the west coast, north-eastern states and the north India mountainous states). The models currently also point to the August and September period recording above normal rainfall over most of India, and normal rainfall in central India.

The climatic prediction models whose forecasting products we have examined make their predictions for 90-day periods (such as May, June and July together) based on conditions observed and calculated for a given month (January, February and March so far). We will consolidate and expand the scope of this initial prognosis – which is of a normal to above normal monsoon – as these forecasts are updated.

Filed Under: Latest, Monsoon 2016 Tagged With: 2016, climate, India, meteorology, monsoon, rain, season, summer monsoon

Preparing for the Indian summer

April 1, 2016 by Climate portal editor Leave a Comment

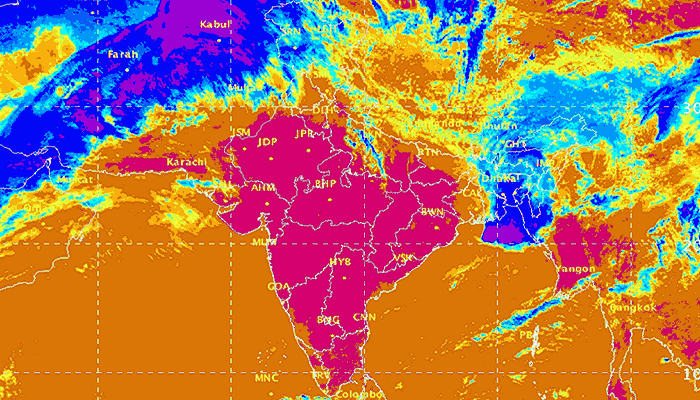
ICP_insat_20160101

The India Meteorological Department (IMD) has issued its forecast for the 2016 hot weather season (April to June). The forecast shows that during the 2016 hot weather season, temperatures (mean, maximum and minimum) in all the sub-divisions are likely to be above normal. All the temperatures (maximum, minimum and mean) of most of the subdivisions from northwest India, Kerala from south India and Vidharbha from Central India are likely to be above normal by 1.0° C or more. Read the full forecast document here (pdf).

The season averaged maximum temperatures of coastal Andhra Pradesh, Odisha, Assam and Meghalaya, sub-Himalayan west Bengal and Sikkim, and NMMT – Nagaland, Manipur, Mizoram and Tripura – are likely to be warmer by 0.5° C and that of the remaining subdivisions are likely to warmer than normal by 0.5° to 1° C. The season averaged minimum temperatures of sub-Himalayan west Bengal and Sikkim, and NMMT are likely to be warmer than normal by <0.5° C and that of the remaining subdivisions are likely to warmer than normal by 0.5° to 1° C.

There is also a high probability (76%) of maximum temperatures in the core heat wave zone during the 2016 hot weather season to be above normal. The core heat wave zone covers the states of Punjab, Himachal Pradesh, Uttarakhand, the National Capital Territory and Delhi, Haryana, Rajasthan, Uttar Pradesh, Gujarat, Madhya Pradesh, Chhattisgarh, Bihar, Jharkhand, West Bengal, Odisha and Telengana and the meteorological sub-divisions of Marathwada, Vidharbha, Madhya Maharashtra and coastal Andhra Pradesh. This in turn suggests high probability of moderate and severe heat wave conditions in the core heat wave zone during the hot weather season.

From this season, the IMD will also provide extended range forecasts (five–day averaged forecasts for the next 15 days) of heat wave conditions over the country. This will be based on the Dynamical Extended Range Forecasting System developed by the Indian Institute of Tropical Meteorology (IITM) in Pune. The forecast will consist of the probability of occurrence of hot days, heat waves and severe heat waves for the next 15 days updated every fifth day from 1 April, 2016. The forecasts will be available on the IMD website.

Filed Under: Latest Tagged With: Bharat, heat, heat wave, hot weather, IMD, India, India Meteorological Department, summer, temperature, पृथ्‍वी विज्ञान, भारत, मौसम

March heat patterns in India

March 25, 2016 by Climate portal editor Leave a Comment

Temperature anomalies expected for March 25-31 in India

From now until the end of March 2016, the maximum temperature anomalies will be less than what has been experienced in March until the 24th.

The India Meteorological Department’s (IMD) numerical weather prediction service has however shown that maximum temperatures will still be above normal by 1 to 3 Celsius over most of central and northern India between 25 and 31 March.

We find that when read with the minimum temperature anomalies, most of peninsular, central and northern India have in March experienced an upward shift in overall temperatures by 1 to 3 Celsius. The meteorological sub-divisions of Telengana, Rayalaseema and coastal Andhra Pradesh in particular stand out for higher minimum temperatures.

Over the last week, maximum temperatures were markedly above normal (5.1° C or more) at most places over West Rajasthan; at many places over Uttarakhand and East Rajasthan; at a few places over Gujarat  and at isolated places over Madhya Pradesh; appreciably above normal (3.1°C to 5.0°C) at most places over Haryana, Chandigarh and Delhi; at many places over Punjab, rest Gujarat and West Madhya Pradesh.

Maximum temperatures were also appreciably above normal at a few places over Madhya Maharashtra and at isolated places over Marathawada, Vidarbha and Kerala; above normal (1.6°C to 3.0°C) at most places over Rayalaseema and West Uttar Pradesh; at many places over Tamil Nadu, Interior Karnataka, East Madhya Pradesh, and the north-eastern states.

Filed Under: Current, Latest Tagged With: 2016, climate, heat, India, summer, temperature

Visualising the December ice-box

January 2, 2016 by Climate portal editor 1 Comment

ICP_20160102

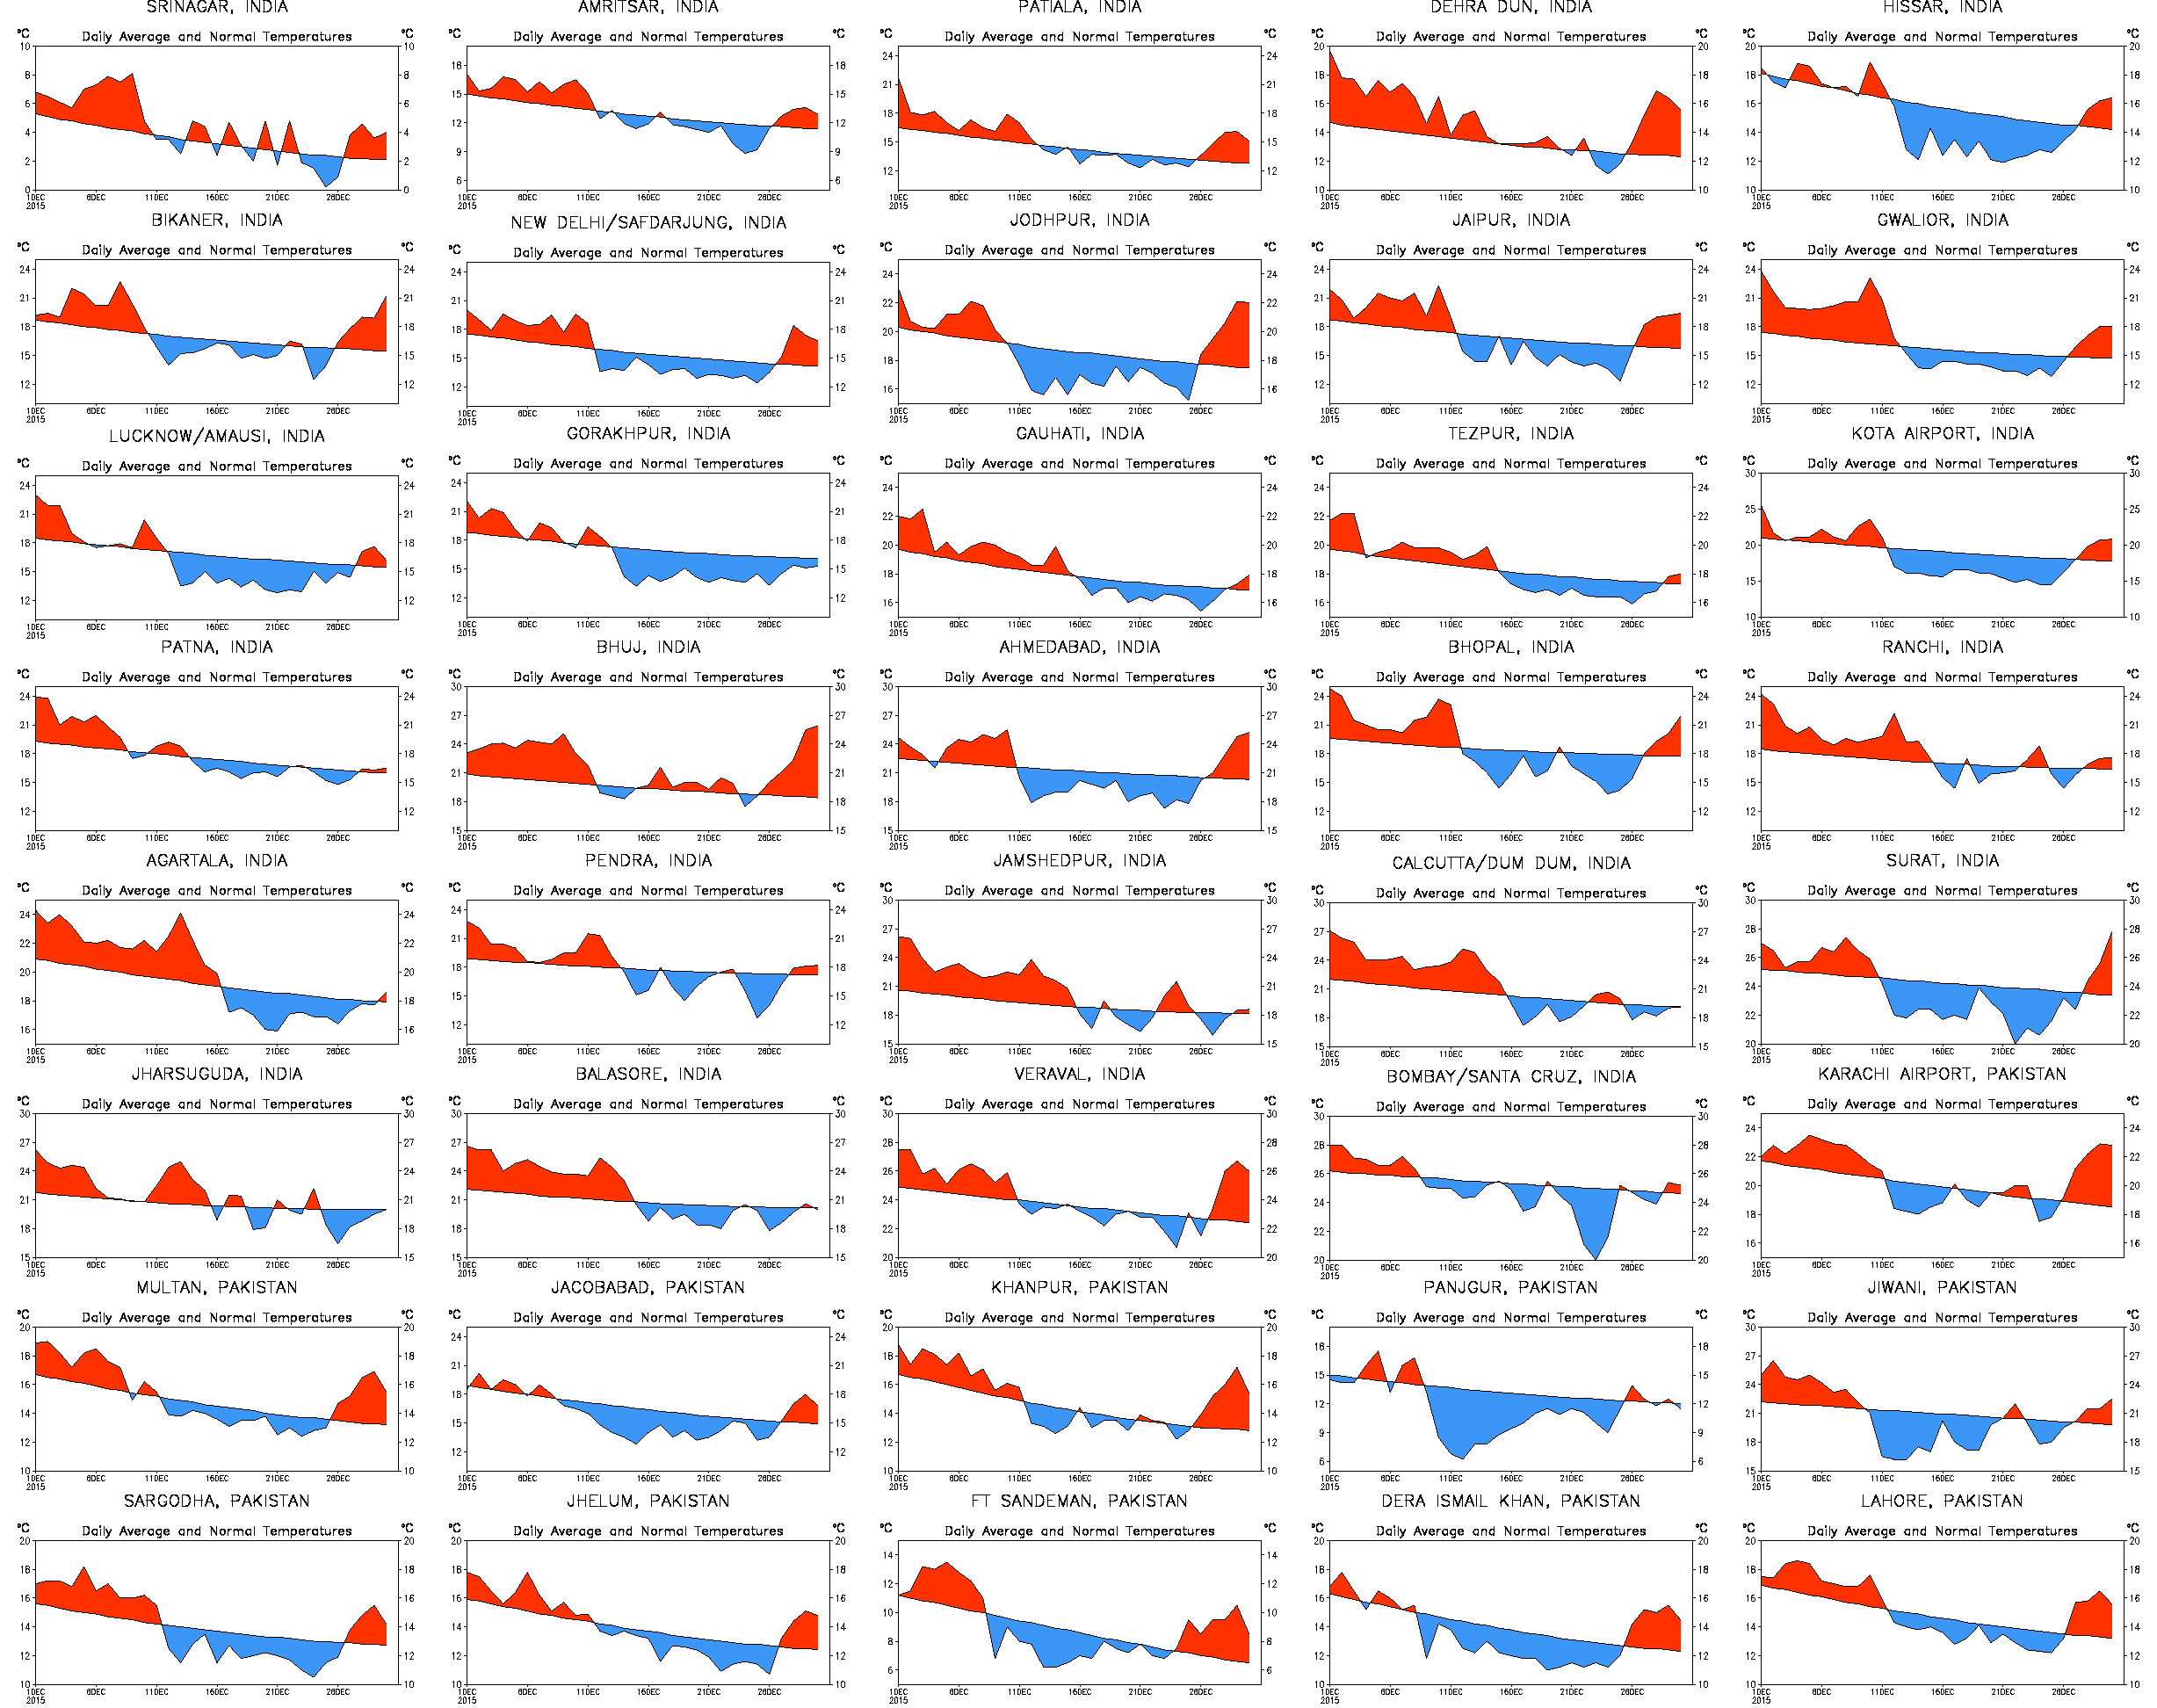
Between 10 and 15 December 2015, minimum temperatures all over northern India and Pakistan, in particular in the Hindu Kush and western Himalaya (including the state of Jammu and Kashmir) dropped sharply. The cold and strong north-westerly winds blowing in from the distant Central Asian region during this period of December deepened the persistent chill.

This panel of the 30-day temperature charts for 40 cities shows the sudden dip all experienced from around 10 December. Original charts are from the NOAA Center for Weather and Climate Prediction and reassembled for this panel.

This panel of the 30-day temperature charts for 40 cities shows the sudden dip all experienced from around 10 December. Original charts are from the NOAA Center for Weather and Climate Prediction and reassembled for this panel.

The cold wave was also experienced in the north-western region – including Rajasthan, Gujarat and adjacent north Maharashtra as far south as Mumbai. From 10 December until 27 and 28 December, unusually cold conditions gripped entire agro-ecological regions – the north Gujarat plain together with the Kathiawad peninsula, the Aravalli ranges and the east Rajasthan uplands, the Ganga-Yamuna Doab, Rohilkhand and the Avadah plain, the Madhya Bharat plateau and the Bundelkhand uplands, and the Central (or Malwa) highlands.

These 30-day temperature charts shows the sudden dip in minimum for 40 cities from 9 and 10 December, and the setting in of cold conditions which continued for two weeks thereafter. During this time, the higher reaches of Kashmir Valley received snowfall, New Delhi recorded minimums of around 5 Celsius with the maximums being two to three degrees below normal, Amritsar in Punjab was at 2 Celsius while Ludhiana and Patiala recorded between 4 and 6 Celsius. Churu in Rajasthan recorded a low of 3 Celsius and Mt Abu, at an altitude of 1,200 metres was just below 0 Celsius. State capital Jaipur recorded a minimum 6 Celsius.

Filed Under: Latest Tagged With: cold wave, Delhi, Gujarat, Himalaya, Hindu Kush, India, Pakistan, Punjab, Rajasthan, winter

The 1 degree mark we’ll recall 2015 for

November 27, 2015 by Climate portal editor Leave a Comment

ICP_WMO_20151127

The global average surface temperature in 2015 is likely to be the warmest on record and to reach the symbolic and significant milestone of 1° Celsius above the pre-industrial era. This is due to a combination of a strong El Niño and human-induced global warming, according to the World Meteorological Organization (WMO).

The years 2011-2015 have been the warmest five-year period on record, with many extreme weather events – especially heatwaves – influenced by climate change, according to a WMO five-year analysis. Levels of greenhouse gases in the atmosphere reached new highs and in the Northern hemisphere spring 2015 the three-month global average concentration of CO2 crossed the 400 parts per million barrier for the first time. 2015 is likely to be the hottest year on record, with ocean surface temperatures at the highest level since measurements began.  It is probable that the 1°C Celsius threshold will be crossed, said the WMO.

Greenhouse gas emissions, which are causing climate change, can be controlled. We have the knowledge and the tools to act. We have a choice. Future generations will not. Added to that, we are witnessing a powerful El Niño event, which is still gaining in strength. This is influencing weather patterns in many parts of the world and fuelled an exceptionally warm October. The overall warming impact of this El Niño is expected to continue into 2016.

Global annual average temperatures anomalies (relative to 1961-1990) based on an average of three global temperature data sets (HadCRUT.4.4.0.0, GISTEMP and NOAAGlobalTemp) from 1950 to 2014. The 2015 average is based on data from January to October. Bars are coloured according to whether the year was classified as an El Niño year (red), a La Niña year (blue) or an ENSO-neutral year (grey).Note uncertainty ranges are not shown, but are around 0.1°C. Chart: WMO

Global annual average temperatures anomalies (relative to 1961-1990) based on an average of three global temperature data sets (HadCRUT.4.4.0.0, GISTEMP and NOAAGlobalTemp) from 1950 to 2014. The 2015 average is based on data from January to October. Bars are coloured according to whether the year was classified as an El Niño year (red), a La Niña year (blue) or an ENSO-neutral year (grey).Note uncertainty ranges are not shown, but are around 0.1°C. Chart: WMO

WMO issued its provisional statement on the status of the climate in 2015, and an additional five-year analysis for 2011-2015, to inform negotiations at the U.N. Climate Change Conference in Paris. A preliminary estimate based on data from January to October shows that the global average surface temperature for 2015 so far was around 0.73 °C above the 1961-1990 average of 14.0°C and approximately 1°C above the pre-industrial 1880-1899 period.

This temperature tendency indicates that 2015 will very likely be the warmest year on record. The global average sea-surface temperature, which set a record last year, is likely to equal or surpass that record in 2015. The global average temperatures over land areas only from January to October suggest that 2015 is also set to be one of the warmest years on record over land. South America is having its hottest year on record, as is Asia (similar to 2007), and Africa and Europe their second hottest.

According to preliminary figures as of the end of September 2015, 2011-15 was the world’s warmest five-year period on record, at about 0.57°C (1.01°F) above the average for the standard 1961-90 reference period. It was the warmest five-year period on record for Asia, Europe, South America and Oceania, and for North America. WMO compiled the five-year analysis because it provides a longer-term climate signal than the annual report.

Filed Under: Latest Tagged With: Climate Change, CO2, conference, COP21, El Nino, global warming, greenhouse gas, meteorological, ppm, temperature, WMO

  • « Previous Page
  • 1
  • 2
  • 3
  • 4
  • …
  • 88
  • Next Page »

Indiaclimate twitter

Tweets by @Indiaclimate

Notable

Between contemplation and climate

Whether or not the USA, Europe, the Western world, the industrialised Eastern world (China, Japan, South Korea, Taiwan), adhere to or not their paltry promises about being more responsible concerning the factors that lead to climate change, is of very little concern to us. We have never set any store by international agreements on climate […]

The ‘Hindu’, ignorant about weather and climate, but runs down IMD

We find objectionable the report by ‘The Hindu’ daily newspaper accusing the India Meteorological Department of scientific shortcoming (‘IMD gets its August forecast wrong’, 1 September 2016). The report claims that the IMD in June 2016 had forecast that rains for August would be more than usual but that the recorded rain was less than […]

dialogue

  • Misreading monsoon | Resources Research on Misreading monsoon
  • Satish on A tribute to the weathermen of Bharat
  • Climate portal editor on A tribute to the weathermen of Bharat
  • Climate portal editor on A tribute to the weathermen of Bharat
  • Climate portal editor on A tribute to the weathermen of Bharat

Categories

Copyright © 2026 indiaclimateportal.org.