The India Climate Observatory

Commentary, action and research on climate and development in India

  • Home
  • About
  • Monsoon 2018
  • Current
  • Bulletin
  • Contact
  • Announcements

The Indiaclimate Rainfall Index 2019

July 15, 2019 by Climate portal editor Leave a Comment

We have compiled the Indiaclimate District Rainfall Adequacy Index for the monsoon season of 2019. As with our previous editions of the index series, this one for the 2019 monsoon applies our innovation to the communicating of the weekly changes in rainfall adequacy as recorded by the India Meteorological Department (IMD).

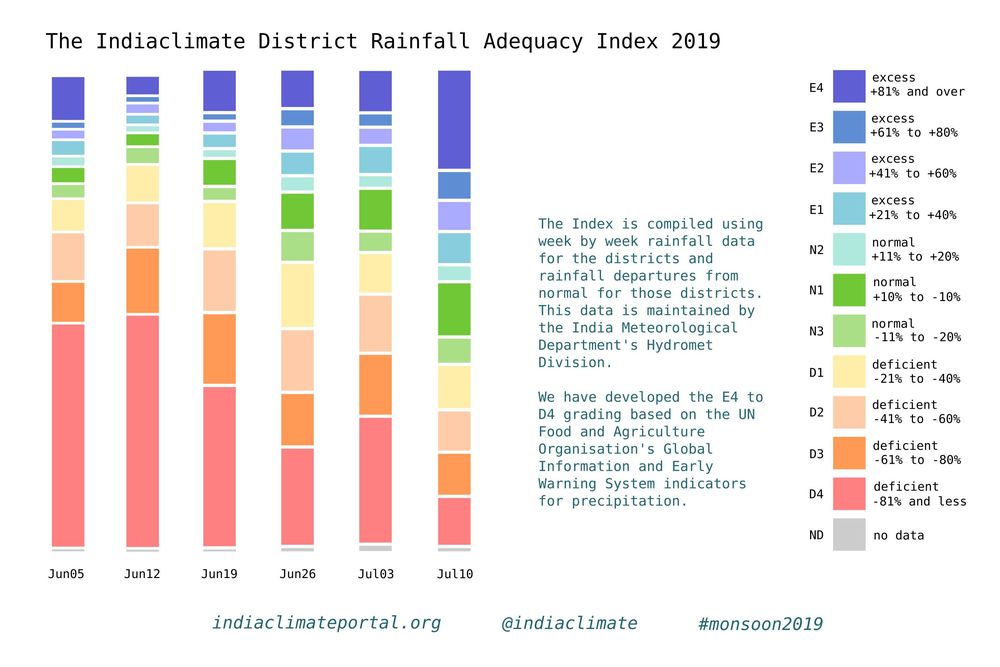
The graph (or visualisation as any such illustration is called nowadays, a word that makes the simple graph or chart sound sophisticated, but which usually complicates matters instead of simplifying them) is easy enough to read and interpret. What you have is several vertical bars, each corresponding to dates a week apart. The bars are made up of coloured segments – there are 11 coloured segments and one grey segment, a total of 12 segments.

Each of the 11 colours represents the number of districts whose rainfall readings for a week (the week till the date given) fall within the parameters given in the accompanying legend. There are three groups of colours: three segments in the ‘normal’ ranges, four segments in the ‘excess’ ranges and four segments in the ‘deficient’ ranges. Grey represents no data for that week.

The gradation of the segments is based on, but is not a copy of, the grades used by the UN Food and Agriculture Organisation’s (FAO) Global Information and Early Warning System (GIEWS) indicators for precipitation. The numbers that we use are from the IMD’s Hydrometeorology Division, which releases its ‘rainfall departures’ table every week. We take these numbers, reprocess them and redistribute them across the 11 grades.

It is a much more readily readable graph and provides for quick interpretation. The grades are finer than the six used by the IMD: normal (+19% to -195), excess (+20% to +59%), large excess (+60% or more), deficient (-20% to -59%), large deficient (-60% to -99%), no rain (-100%).

Our index, in which most segments are of 20 percentage points, is designed for local administrations – in districts but also municipal bodies – to take their cues from weekly signals and prepare if need be for a drought-like situation with water shortages or a flood-like situation with inundation.

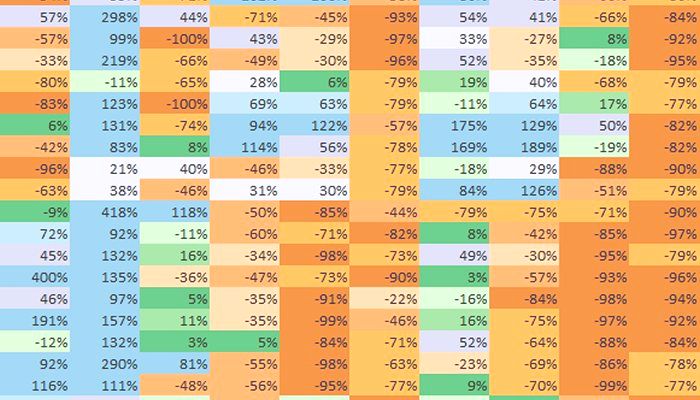
How does it work in practice? Let’s look at the district of Guna, in Madhya Pradesh, in the meteorological sub-division of Western MP. The first two monsoon weeks, ending 5 June and 12 June, Guna received no rain (that is, -100% of the rainfall it normally receives in those weeks) and that corresponds to the D4 indicator. The next week, ending 19 June, it received -29% which is D1, the fourth week (26 June) it slipped back to -72% which is D3, the following week (3 July) it improved to -32% which is again D1 and in the sixth week (10 July) Guna received +34% which took it into the E1 grade.

Normally, a district that has received no rainfall or neglible rainfall for six weeks becomes a candidate for a drought-like condition – water sources after the long and hot summer have dried up and crops become parched. If such conditions continue for another two weeks, the state administration must roll out relief measures.

In our example, for the five weeks until the week of 3 July Guna had two D4s, one D3 and two D1s before coming out of the D grades. Our index gives the district (or town) administration the means with which to set their own triggers for action. If the water sources in the district were still at 10%-15% of their water holding capacities by the week of 3 July, then they could consult the medium term forecasts to gauge whether likely rainfall will be enough to hold off relief action. If not, and stored water slipped under 10% with uncertain forecasts, they could ask for relief and issue appropriate crop advisories.

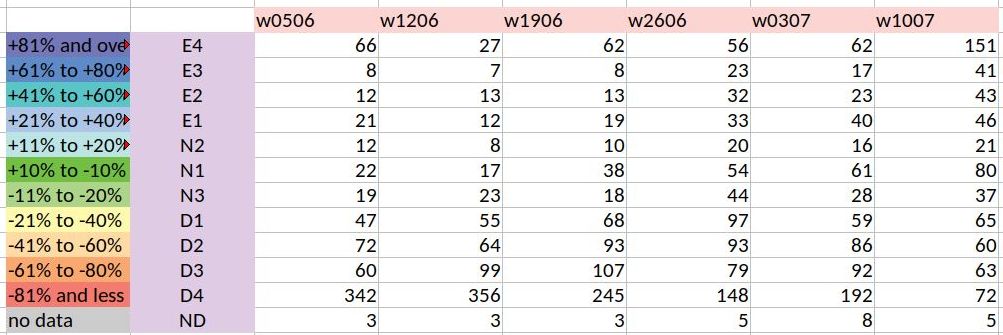
Our index graph – the stacked and segmented bar chart I am sorely tempted to call a ‘signature’ – is a representation of the numbers in the rainweeks table we compile. This table has 684 components which are the districts, each of which has a rainfall reading for the week given (in millimetres) and a rainfall departure (in %). The graph is a set of stacked bars for each week, with each segment sized according to the number of districts in the grade that the segment corresponds to.

What does the index graph for six weeks tell us? The first two monsoon weeks were alarming, with 342 and then 356 districts in the D4 grade. The situation has slowly improved thereafter, with the latest week, that of 10 July, being the best so far – it has 80 districts in the N1 grade. That last week also has for the first time in monsoon 2019 more E grade districts than D grade districts. What needs to be looked out for is districts that have been in the D4 and D3 grades for four and more weeks and whose recovery is patchy. That monitoring becomes much easier with the Indiaclimate District Rainfall Adequacy Index.

Rahul Goswami

Filed Under: Latest, Monsoon 2019 Tagged With: 2019, agriculture, district, drought, flood, India, monsoon, rainfall, water

Vidarbha’s monsoon secret comes out in our innovative new rainfall index

August 18, 2017 by Climate portal editor Leave a Comment

Monsoon rains in Vidarbha better than the rains in Konkan Maharashtra? How can this be possible? Especially when the average rainfall for the seven districts of Konkan Maharashtra, over 1 June to 9 August, is 1,812 mm and the average rainfall for the 11 districts of Vidarbha Maharashtra is 427 mm over the same period?

The measure that we are piloting is not based on the cumulative totals, for each district during each week of monsoon 2017, but for how adequate the rainfall has been over each week. What does that mean? Maharashtra’s Konkan region receives over four times the amount of rainfall that Vidarbha does. This does not mean that Vidarbha is more ‘rain poor’ than Konkan Maharashtra. The two meteorological regions are different just as their agro-ecologies, soils, water retention structures and flora are different.

Because of this difference, it is more useful to us to judge how adequate rainfall has been over any given period of measurement. We have taken a week because that is what we have data for, as provided by the Department of Hydrometeorology or the Department of Agricultural Meteorology of the India Meteorological Department, Ministry of Earth Sciences.

If you examine the cumulative totals – this means the running totals which from one week to the next carry over extras or deficits – the picture is as follows. One district only (Mumbai City) of the seven in Konkan Maharashtra is deficit (with -22%), all the rest being ‘normal’ in the range of -19% to +22%. The cumulative measurement picture for Vidarbha is this: only four out of the 11 districts (Buldana, Gadchiroli, Nagpur and Wardha) are ‘normal’ and in the range of -15% to -19%. The remaining seven are ‘deficit’ in the range of -23% to -36% (Amravati and Yavatmal being the lowest).

The weakness of the cumulative measure is that it ‘carries forward’ deficits and surpluses. A deficit in weeks 3 and 4 can be ‘made up’ for by better rains in week 5 and 6. But when rain in weeks 3 and 4 are important for a particular phase of a crop’s growth, the surplus that follows is of little use.

That’s where this pilot measure, what I have called the ‘rainfall adequacy index’, comes in. It indexes normalcy and variation from normalcy, plus or minus, and so records how adequate every week has been for the district. Using this method, we find that among Maharashtra’s meteorological regions, it is Vidarbha that has done best over 1 June to 9 August, followed by Konkan Maharashtra, then by Madhya Maharashtra and with Marathwada last.

The footnote is that the three districts with the best ‘rainfall adequacy index’ over this period are, in order, Sindhudurg, Nagpur and Wardha. The three districts with the worst index are Osmanabad, Nashik and both Thane and Palghar.

– Rahul Goswami

Filed Under: Latest, Monsoon 2017 Tagged With: 2017, agriculture, district, ecology, hydrometeorology, India, Konkan, Madhya Maharashtra, Maharashtra, Marathwada, monsoon, Mumbai, rainfall, Vidarbha, water

Rain for the Rani

July 2, 2017 by Climate portal editor Leave a Comment

We find that the heavy rains that soaked the north Gujarat plains on the night of 1/2 July are testimony to the genius and far-sightedness of the builders of the Rani-ki-Vav, the famed stepwell which was initially built as a memorial to a king in the 11th century AD. The central heavy rainfall zone was immediately to the north-west of Patan, the town nearest to the Rani-ki-Vav, and it is precisely for this sort of rain that this fabulously constructed stepwell was built.


Rain for the Rani. At about 8pm on 1 July, dense rainclouds hung over the entire north #Gujarat plains, from ancient Dholavira to Dahod ..2

— Indiaclimate (@Indiaclimate) July 2, 2017


..by 8:30 pm showers were being reported from towns in the region while farther north in #Rajasthan, heavy rain pelted Barmer and Jalor ..3

— Indiaclimate (@Indiaclimate) July 2, 2017


..Rain for the Rani. At around 9pm the rainfall had become very heavy, reaching 15mm/hour, quickly leaching into the parched soil ..4 pic.twitter.com/zHLFHzcVmH

— Indiaclimate (@Indiaclimate) July 2, 2017


..The cores of two cloud masses were converging. The heavy rain was now on two parallel fronts each about 300 km wide ..5 pic.twitter.com/gamGJtCQGp

— Indiaclimate (@Indiaclimate) July 2, 2017


.. Rain for the Rani. At around midnight the Rajasthan and Gujarat core rainfall zones merged and the intensity lessened #monsoon2017 ..6 pic.twitter.com/MCpROK4jLo

— Indiaclimate (@Indiaclimate) July 2, 2017


..On the ground, about 2 km outside the old town of Patan, the water levels in an 11th century structure were rising. This remarkable ..7

— Indiaclimate (@Indiaclimate) July 2, 2017


..well, the Rani Ki Vav, was sited, designed, engineered and adorned exactly for rains such as this !! Town streets flooded and cars ..8 pic.twitter.com/sKD03C7sYp

— Indiaclimate (@Indiaclimate) July 2, 2017


..stalled. But the old channels & chambers of the Rani Ki Vav were proving the vision and sagacity of the celebrated stepwell’s creators ..9

— Indiaclimate (@Indiaclimate) July 2, 2017


..Designed as an inverted temple highlighting the sanctity of water, the Rani Ki Vav combines #water storage with exceptional artistry ..10 pic.twitter.com/CWxBh2cyW7

— Indiaclimate (@Indiaclimate) July 2, 2017


..We marvel at the foresight and knowledge of the Vav’s builders. To the north and north-west of the stepwell lay the zone in which this .11

— Indiaclimate (@Indiaclimate) July 2, 2017


..torrent of rain fell over 1/2 July, recharging the subterranean water storage system whose design origin is the 3rd millennium BC ..12 pic.twitter.com/wEWYyCRgnu

— Indiaclimate (@Indiaclimate) July 2, 2017


..This is the 4 hour 30 min sequence of intense #monsoon2017 rainfall in north #Gujarat and adjacent #Rajasthan – Rain for the Rani pic.twitter.com/zeuKb6SCZG

— Indiaclimate (@Indiaclimate) July 2, 2017

Filed Under: Monsoon 2017, Reports & Comment Tagged With: 2017, Gujarat, heritage, India, monsoon, rain, Rajasthan, stepwell, traditional knowledge, water

Dry districts alert, May 2017

May 1, 2017 by Climate portal editor Leave a Comment

A large number of districts in south, peninsular, central and eastern India are experiencing dry and semi-arid conditions which will continue, and likely become worse, until the 2017 monsoon becomes active.

This list of districts is based on our re-working of the maps released weekly by the India Meteorological Department (Hydromet section in Pune), which show the district-level standardised precipitation index (or SPI). While this is not a drought or dryness index, the weekly SPI serves as a very reliable indicator of where water stress is occurring, and is therefore an invaluable aid for relief planning.

In this series of four maps, re-coloured by us to better display differences in SPI between regions and over time, the change in south India stands out.

Each map displays the SPI as a cumulative reading of the four weeks until the date given. That is why the change for any district – from ‘moderately dry’ to ‘severely dry’ for example – needs to be seen as having an immediate bearing on the available water, crop health and condition of forest and pasture for that district.

Based on the readings for 26 April 2017 this is the list of districts that need urgent attention.

Maharashtra: Gadchiroli, Chandrapur, Yavatmal, Kolhapur
Chhattisgarh (Raipur division): Gariaband, Raipur, Baloda Bazar
Odisha: Rayagada, Kandhamal, Angul, Cuttack
West Bengal: 24 Parganas North
Manipur: Chandel
Andhra Pradesh: Vizianagaram, Kurnool
Telengana (old district boundaries): Nizamabad, Karimnagar, Medak, Warangal, Khammam, Mahbubnagar
Karnataka: Bidar, Raichur, Bijapur, Bagalkot, Koppal, Gadag, Dharwad, Bellary, Shimoga
Tamil Nadu: Cuddalore, Nagapattinam, Tiruvarur, Thanjavur, Pudukkottai, Ramanathapuram, Toothukudi, Kaniyakumari, Theni, Coimbatore
Kerala: Malappuram, Thrissur, Ernakulam, Kottayam, Alapuzha

Filed Under: Latest Tagged With: 2017, Andhra Pradesh, arid, Bharat, district, drought, India, Karnataka, Kerala, Maharashtra, Odisha, summer, Tamil Nadu, Telengana, water

Big water storage wheel

April 29, 2017 by Climate portal editor Leave a Comment

The Central Water Commission, Ministry of Water Resources, Government of India, monitors every day the quantity of water stored (and used from) each of the 91 major reservoirs of the country. It issues a bulletin every week that gives the weekly storage position of these reservoirs – the volume of water, the level of water in the reservoir and the change from the last week, the change from the same date last year and from the average on this date of the last ten years.

The water storage capacity of these 91 reservoirs taken together is 157.799 billion cubic metres (bcm) which is estimated to be about 62% of the total water storage capacity (in other smaller dams and storage structures all over the country) that has been built and is being used, and which is approximately 253.38 bcm. Out of these 91 reservoirs, hydro-electric power stations (with a capacity of 60 megawatts and more) are attached to 37 reservoirs.

In this illustration by Indiaclimate, for the first time the total storage capacity of the 91 major reservoirs has been visually mapped to show reservoir, state and zone capacities relative to each other and the total.

These are the reservoirs with state, reservoir name and full reservoir level in billion cubic metres (bcm). For a good quality file that you can print, write to us.

South zone reservoirs (AP for Andhra Pradesh, TG for Telengana, APTG for Andhra Pradesh and Telegana together, KAR for Karnataka, TN for Tamil Nadu, KER for Kerala): AP, Somasila (1.994); TG, Sriramsagar (2.3); TG, Lower Manair (0.621); APTG, Srisailam (8.288); APTG, Nagarjuna Sagar (6.841); KAR, Krishnaraja Sagra  (1.163); KAR, Tungabhadra (3.276); KAR, Ghataprabha (1.391); KAR, Bhadra (1.785); KAR, Linganamakki (4.294); KAR, Narayanpur (0.863); KAR, Malaprabha (Renuka) (0.972); KAR, Kabini (0.444); KAR, Hemavathy (0.927); KAR, Harangi (0.22); KAR, Supa (4.12); KAR, Vanivilas Sagar (0.802); KAR, Almatti (3.105); KAR, Gerusoppa (0.13); KER, Kallada (Parappar) (0.507); KER, Idamalayar (1.018); KER, Idukki (1.46); KER, Kakki (0.447); KER, Periyar (0.173); KER, Malapmuzha (0.224); TN, Lower Bhawani (0.792); TN, Mettur (Stanley) (2.647); TN, Vaigai (0.172); TN, Parambikulam (0.38); TN, Aliyar (0.095); TN, Sholayar (0.143). Total for 31 reservoirs 51.59 bcm

West zone reservoirs (GUJ for Gujarat, MAH for Maharashtra): GUJ, Ukai (6.615); GUJ, Sabarmati (Dharoi) (0.735); GUJ, Kadana (1.472); GUJ, Shetrunji (0.3); GUJ, Bhadar (0.188); GUJ, Damanaganga (0.502); GUJ, Dantiwada (0.399); GUJ, Panam (0.697); GUJ, Sardar Sarovar (1.566); GUJ, Karjan (0.523); MAH, Jayakwadi (Paithon) (2.171); MAH, Koyana (2.652); MAH, Bhima (Ujjani) (1.517); MAH, Isapur (0.965); MAH, Mula (0.609); MAH, Yeldari (0.809); MAH, Girna (0.524); MAH, Khadakvasla (0.056); MAH, Upper Vaitarna (0.331); MAH, Upper Tapi (0.255); MAH, Pench (Totaladoh) (1.091); MAH, Upper Wardha (0.564); MAH, Bhatsa (0.942); MAH, Dhom (0.331); MAH, Dudhganga (0.664); MAH, Manikdoh (Kukadi) (0.288); MAH, Bhandardara (0.304). Total for 27 reservoirs 27.07 bcm

East zone reservoirs (JHR for Jharkhand, ODI for Odisha, WB for West Bengal, TRI for Tripura): JHR, Tenughat (0.821); JHR, Maithon (0.471); JHR, Panchet Hill (0.184); JHR, Konar (0.176); JHR, Tilaiya (0.142); ODI, Hirakud (5.378); ODI, Balimela (2.676); ODI, Salanadi (0.558); ODI, Rengali (3.432); ODI, Machkund (Jalput) (0.893); ODI, Upper Kolab (0.935); ODI, Upper Indravati (1.456); WB, Mayurakshi (0.48); WB, Kangsabati (0.914); TRI, Gumti (0.312). Total for 15 reservoirs 18.83 bcm

Central zone reservoirs (UP for Uttar Pradesh, UTT for Uttarakhand, MP for Madhya Pradesh, CHT for Chhattisgarh): UP, Matatila (0.707); UP, Rihand (5.649); UTT, Ramganga (2.196); UTT, Tehri (2.615); MP, Gandhi Sagar (6.827); MP, Tawa (1.944); MP, Bargi (3.18); MP, Bansagar (5.166); MP, Indira Sagar (9.745); MP, Barna (0.456); CHT, Minimata Bangoi (3.046); CHT, Mahanadi (0.767). Total for 12 reservoirs 42.30 bcm

North zone reservoirs (HP for Himachal Pradesh, PUN for Punjab, RAJ for Rajasthan): HP, Gobind Sagar (Bhakra) (6.229); HP, Pong Dam (6.157); PUN, Thein  (2.344); RAJ, Mahi Bajaj Sagar (1.711); RAJ, Jhakam (0.132); RAJ, Rana Pratap Sagar (1.436). Total for 6 reservoirs 18.01 bcm

Filed Under: Current Tagged With: agriculture, Bharat, dam, drinking water, hydel, hydro, India, irrigation, reservoir, water, water pump, water resources, water storage

South India’s water emergency

April 11, 2017 by Climate portal editor Leave a Comment

ICP_res_20170410_topBy the end of the first week of April 2017, the most current and reliable indicator for stored water in south India showed how dire the situation has become. And the South-West monsoon is still about eight weeks away. The weekly data sheet on the stored water quantities in the 91 major reservoirs of India, which is maintained and released by the Central Water Commission, has in the 6 April 2017 release shown the scale of the water emergency.

Of the 31 reservoirs in the southern region (Kerala, Tamil Nadu, Karnataka, Telengana and Andhra Pradesh) that are among the major reservoirs of India, 18 have stored water that is less than 15% of their full capacities.

These 18 are (ranked by least water stored):
Nagarjuna Sagar, APTG, 0.00%
Sholayar, TN, 0.00%
Almatti, KAR, 0.03%
Kabini, KAR, 2.25%
Vanivilas Sagar, KAR, 2.74%
Tungabhadra, KAR, 3.21%
Vaigai, TN, 4.07%
Parambikulam, TN, 5.00%
Malaprabha (Renuka), KAR, 5.56%
Hemavathy, KAR, 5.72%
Mettur (Stanley), TN, 6.72%
Periyar, KER, 6.94%
Bhadra, KAR, 9.02%
Lower Bhawani, TN, 9.09%
Srisailam, APTG, 9.44%
Krishnaraja Sagar, KAR, 11.44%
Malapmuzha, KER, 11.61%
Aliyar, TN, 14.74%
(TN is Tamil Nadu, KER is Kerala, KAR is Karnataka, APTG is Andhra Pradesh and Telengana)

ICP_south_water_20170411

Using a municipal average of about 400 litres per day per household that is a typical designed supply (not delivered, for that’s another tale), how much water does this allow for the 60.51 million households of the southern region until the monsoon begins?

Tamil Nadu has 18.46 million households, Kerala has 7.83 million, Karnataka has 13.3 million, Andhra Pradesh and Telengana have 20.92 million. These together need 24.2 billion litres a day or, in reservoir storage terms, 0.024 billion cubic metres (bcm) a day. The 31 major reservoirs of southern India together have, as of 6 April 2017, 6.583 bcm. From this quantity is taken water for industrial, agricultural and commercial use.

These uses are given priority or water stocks are secured (never mind allocation and metering) especially by industry. Normally, what remains for household use is about a third of the available stock. This leaves, as on 6 April, about 2.19 bcm for household use, which will suffice the 60.51 million households of south India for about 90 days – but only provided, and this is the stringent, non-negotiable condition that must be enforced, all households especially urban keep within the 400 litres per household per day limit.

The situation does not improve even if the monsoon arrives on time and the first weeks deliver normal rainfall. It is only by July 5-15 that reservoir water stocks begin trending upwards. This is where the 90-day restricted supply can take south India to. But only if immediate and strict rationing is imposed, as it should have been, to allow for climatological variance, by 1 March 2017.

Filed Under: Latest Tagged With: Andhra Pradesh, Bharat, drought, India, Karnataka, Kerala, reservoir, Tamil Nadu, Telengana, water, water shortage, water supply

Rivers before states

June 29, 2016 by Climate portal editor Leave a Comment

2016-06-29_192703

Our view of where water falls during the monsoon and where it is used has tended to follow the administrative unit view. That is, which state has experienced normal, above normal or deficient rainfall or which meteorological division has experienced normal, above normal or deficient rainfall.

Such a view has obscured an important ground reality, and this is that when it rains, surface water follows the contours and topography of watersheds and third-level basins, themselves subsets of sub-basins and then river basins. Thus when rain falls, water collects and begins to flow, it is natural to look for where it flows and where it may be collected instead of whether it is measured on one side or another of an imaginary boundary, which is what a district or state boundary is.

Rainfall anomalies in millimetres for 01-26 June. Greens/blues are above, browns/ochres are below. This section which includes Maharashtra, Madhya Pradesh, Chhattisgarh, Jharkhand, Bihar, Uttar Pradesh and part of Rajasthan shows how deficient areas are interspersed with excess areas. Watersheds could be the answer. Image source: NCEP, CPC

Rainfall anomalies in millimetres for 01-26 June. Greens/blues are above, browns/ochres are below. This section which includes Maharashtra, Madhya Pradesh, Chhattisgarh, Jharkhand, Bihar, Uttar Pradesh and part of Rajasthan shows how deficient areas are interspersed with excess areas. Watersheds could be the answer. Image source: NCEP, CPC

For everything that concerns water – which does mean everything that is essential to us: agriculture, forests, grassy regions and orchards, water that can be used for drinking, rural and urban settlements, commerce and industry – it is the group of hydrological structures we call a river basin (or sub-basin if the basin is a large one) that becomes the spatial region to study and plan for.

We have 36 states and union territories and also 36 meteorological divisions. These correspond with each other for most of the country and this correspondence, unnecessary and misleading, has led to our incorrect view of where rain falls and how it behaves where it falls. It has been a persistent error because I think of administrative inertia combined with the quite needless politics that surrounds river (or surface) and ground water.

Rain falls upon and rainwater collects and moves surface water then not in a taluka or district, but in a biophysical region which in one way we can describe as a river sub-basin or a large watershed. There are other pieces that make the whole: type of soil, the underlying geological strata, the mix of vegetation, the density and health of forests, the mix of cultivated crops, and the spread and density of human settlements (which use and alter these pieces).

Rainfall as estimated by Insat-3D and mapped in daily images for 14-28 June 2016. The background is the major river basins, not states (click for 386kb full res). The IMD's RAPID system has this monsoon introduced river basins as a base map. Images source: IMD/ISRO RAPID

Rainfall as estimated by Insat-3D and mapped in daily images for 14-28 June 2016. The background is the major river basins, not states (click for 386kb full res). The IMD’s RAPID system has this monsoon introduced river basins as a base map. Images source: IMD/ISRO RAPID

Table of river basins and sub-basins with sizes. Source: WRIS

Table of river basins and sub-basins with sizes. Source: WRIS

We know which our major rivers are, and those of us who are curious enough about the biophysical pieces that determine the characteristics of the regions in which we live also know the names of lesser rivers. How many river sub-basins are there in Bharat?

There are several answers because there have been (and continue to be) several authorities whose work it is to assess and measure water. Their methodologies differ somewhat each from the other, and that is why they not only give us differing numbers of major river basins but also – for those basins whose names are the same – differing sizes for a single river basin.

The Water Resources Information System (WRIS) which is the newest methodical system and which has come about because of our remote sensing expertise, has the most detailed information about our river basins. There are also the Central Water Commission, the National Commission for Integrated Water Resources Development Plan, the All India Soil and Land Use Survey, and the Central Ground Water Board.

Depending on their thematic orientation, these have (in their early forms which date back to the late 1940s) conducted detailed surveys of river basins and districts, outlined hydrological units, catchment zones, river valley projects, watersheds and have through such mechanisms steered (at times forced) states into recognising that river basins are at least as important as state boundaries.

How many are there? The WRIS informs us that there are 26 river basins and 102 sub-basins. Thus there are about three times as many sub-basins as there are states (and UTs) and there is one sub-basin for about every six districts. The biggest river basins are those of the Ganga (808,334 square kilometres), the Indus (till the border, 453,931 sq km), Godavari (302,063 sq km) and Krishna (254,743 sq km). The 102 sub-basins have a median size (excluding the very smallest) of 29,200 sq km and range from 1,676 sq km to 99,040 sq km for the Brahmaputra Upper and 125,084 sq km for the Yamuna Lower basins. The larger sub-basins (there are 14 whose geographic sizes are more than 50,000 sq km) contain dozens of watersheds each (there are some 3,200 in Bharat).

In the small hydrological units that we call watersheds, and in the larger ones we call sub-basins and river basins, is where the rain falls and where it needs to be measured and counted. This our earth sciences agencies already do. It is up to us and up to administrators of districts, states and particularly of all Class I and larger cities to alter the manner in which we look at the water that falls in this wondrous season upon our earth.

— Rahul Goswami

Filed Under: Latest, Monsoon 2016 Tagged With: India, monsoon, river, State, water

A race between monsoon and water

June 1, 2016 by Climate portal editor Leave a Comment

ICP_reservoirs_20160601

The southern states of Tamil Nadu, Karnataka, Andhra Pradesh and Telengana are in dire need of rainwater to replenish exceedingly low levels in reservoirs and all surface water structures. This water has come in the form of showers over the past five or six days, although the spread of the rainfall has been patchy, and whether rainwater has collected in significant quantities and percolated into sub-soil aquifers will not be known for at least another week.

Until 31 May 2016 the stored water situation as measured by the quantities recorded in the 91 major reservoirs of India was very grave indeed. The most recent weekly bulletin of the Central Water Commission, which monitors what is called the ‘live storage status’ of the 91 major reservoirs, was issued on 26 May. Out of the 91 reservoirs, 37 have hydro-electric power plants which deliver electricity to the states in which these reservoirs are and to the national grid.

The total ‘live storage’ capacity of these 91 reservoirs is 157.799 billion cubic metres (BCM) which is estimated as being about 62% of the total storage capacity of 253.388 BCM that is estimated to have been built or created. But the 26 May bulletin placed the total storage available in these reservoirs at 26.816 BCM, which is 17% of the total of 91 reservoirs. At this time in 2015, the total stored water was 49.119 BCM and the average of the last 10 years of storage at this time was 33.764 BCM. Thus, the stored water for the week ended 26 May is 55% of the quantity stored in 2015 and 79% of the quantity stored at this time averaged for the last ten years.

ICP_reservoir_trends_20160601

The Northern region is Himachal Pradesh, Punjab and Rajasthan. There are six reservoirs with total live storage capacity of 18.01 BCM. By 26 May the total storage in these reservoirs was 3.91 BCM which is 22% of the total live storage capacity. The stored volume at the corresponding period in 2015 was 43% and the stored volume of the average corresponding period of the last ten years was 29%.

The Eastern region is Jharkhand, Odisha, West Bengal and Tripura. There are 15 reservoirs with total live storage capacity of 18.83 BCM. By 26 May the total live storage in these reservoirs was 4.22 BCM which is 22% of total live storage capacity. The stored volume at the corresponding period in 2015 was 34% and the stored volume of the average corresponding period of the last ten years was 20%.

The Western region is Gujarat and Maharashtra. There are 27 reservoirs with total live storage capacity of 27.07 BCM. By 26 May the total live storage in these reservoirs was 3.90 BCM which is 14% of total live storage capacity. The stored volume at the corresponding period in 2015 was 26% and the stored volume of the average corresponding period of the last ten years was also 26%.

The Central region is Uttar Pradesh, Uttarakhand, Madhya Pradesh and Chhattisgarh. There are 12 reservoirs with total live storage capacity of 42.30 BCM. By 26 May the total live storage available in these reservoirs is 9.59 BCM which is 23% of total live storage capacity. The stored volume at the corresponding period in 2015 was 33% and the stored volume of the average corresponding period of the last ten years was 18%.

The Southern region is Andhra Pradesh, Telengana, combined projects in both states, Karnataka, Kerala and Tamil Nadu. There are 31 reservoirs with total live storage capacity of 51.59 BCM. By 26 May the total live storage available in these reservoirs was 5.21 BCM which is 10% of total live storage capacity. The stored volume at the corresponding period in 2015 was 27% and the stored volume of the average corresponding period of the last ten years was 20%.

Filed Under: Latest, Monsoon 2016 Tagged With: 2016, Bharat, dams, India, monsoon, reservoir, water

Prepare for May heat

May 4, 2016 by Climate portal editor Leave a Comment

ICP_May_heat_20160504
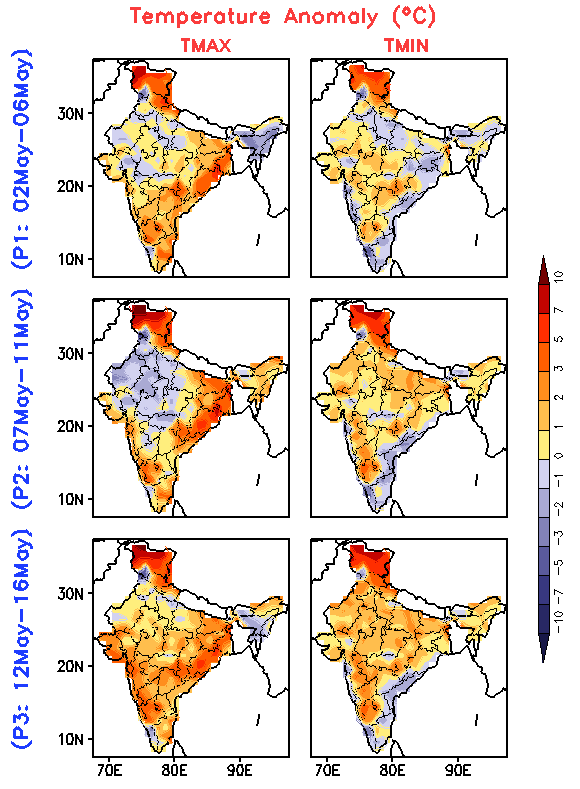
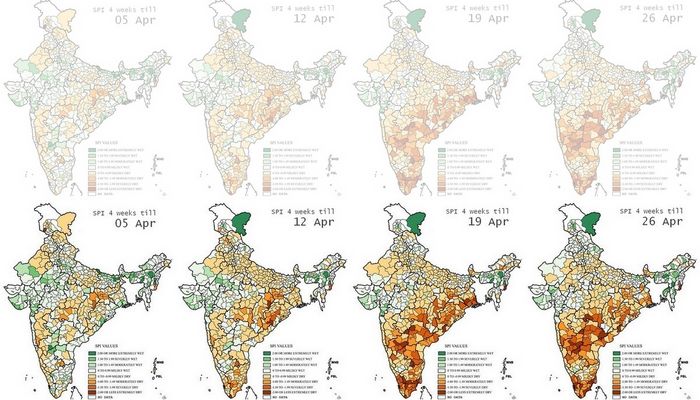
The heat outlook for the first half of May, which was released by the India Meteorological Department (IMD) on 02 May, calls for immediate attention and preparation on all fronts.

The forecast is for three periods of five days each (called pentads) with expected temperature anomalies given for maximum and minimum temperatures. The big picture is that over some parts of the country maximum temperatures will remain 3-4 C above normal for all the three pentads.

Minimum temperatures that are 1-5 degrees higher than normal will increase in terms of the geographical range as the days progress through the first, second and third pentad: 02 to 06 May, 07 to 11 May and 12 to 16 May.

There are several particular alerts arising from the IMD heat wave outlook:

The heat outlook for the first half of May, released by the India Meteorological Department (IMD), for the three five-day periods of 02 to 06 May, 07 to 11 May and 12 to 16 May.

The heat outlook for the first half of May, released by the India Meteorological Department (IMD), for the three five-day periods of 02 to 06 May, 07 to 11 May and 12 to 16 May.

1. Odisha, Gangetic West Bengal and south Chhattisgarh, which have seen some record-breaking high temperatures in April, will continue to see above normal maximum temperatures.

2. South Interior Karnataka, coastal Maharashtra and Goa (the Konkan), and Saurashtra will experience a gradual rise in maximum temperatures from the first to third pentad.

3. Maximum and minimum temperatures both, in Jammu and Kashmir, Himachal Pradesh and Uttarakhand will remain around 5 C above normal for the duration of the forecast.

4. The 12 to 16 May period (third pentad) will see higher than normal maximum temperatures (2 to 5 C) over almost the entire country, and higher than normal minimum temperatures over most of the country.

Other observations are:

5. The North-East will experience minimum temperatures about a degree higher than normal during 07 to 16 May.

6. For the second pentad, that is 07 to 11 May, maximum temperatures in north-west India (Punjab, Haryana, western Uttar Pradesh, Rajasthan, western Madhya Pradesh, Delhi) will drop by 2 to 3 C.

7. Coastal Andhra Pradesh, Rayalaseem and Tamil Nadu will experience lower minimum temperatures by 1 to 2 C during 07 to 16 May.

Please observe basic precautions during this period in particular: eat smaller meals more often; drink water even when not thirsty; avoid tea, coffee and alcohol; plan your activities to avoid being outdoors during 11am to 4pm; do not leave children in cars by themselves; keep a watch on the elderly especially those who are infirm or invalid; wear non-synthetic non-polyester light-coloured and loose fitting clothes; if working outdoors rest frequently; provide drinking water and shade to animals and pets.

Filed Under: Current Tagged With: Bharat, climate, drought, forecast, heat, heat wave, IMD, India, India Meteorological Department, temperature, water

Why we need to save water right now

April 16, 2016 by Climate portal editor Leave a Comment

ICP_reservoirs_20160417

Every week, the Central Water Commission release the “live storage” data. By this the Commission means the quantity of water stored in what are called the 91 major reservoirs of India. From this group of what are also called the big dams – they are the biggest in the country – 37 have hydro-electric power plants attached that use the flow of water to generate electricity.

Together the 91 reservoirs can store, if they were full, 157.799 billion cubic metres (BCM). This amount is calculated as being about  62% of the entire “live storage” capacity of 253 BCM which is estimated to have been built as dams in India.

The CWC’s latest bulletin of 13 April 2016 delivers to us an immediate warning: the water stored in these major reservoirs together is under a quarter of their full storage level. The combined quantity stands at 35.839 BCM, which is 23% of the total live storage capacity of these reservoirs. This quantity is 67% of what was stored at this time last year, and is 77% of the average for ten years that is stored at this time of the year. This means we have less stored water compared with last year and compared with the ten year average for this time of year.

Here follows our sequence of alerts put out over the @indiaclimate Twitter feed:

Today, the 91 major reservoirs together hold 35.83 billion cubic metres (bcm) of #water. When all full they can hold 157.79 bcm

— Indiaclimate (@Indiaclimate) April 16, 2016

The total #water stored now is 23% of full storage by all the 91 reservoirs, and is 67% of the storage at this time last year. — Indiaclimate (@Indiaclimate) April 16, 2016

And moreover the total #water stored now is 77% of the average storage at this time for the last ten years. Now for the charts.

— Indiaclimate (@Indiaclimate) April 16, 2016

Water saving measures must immediately be followed by all households. Town and city municipal corporations and councils must immediately ask residents to reduce their use of water especially on activities like washing cars, watering lawns and swimming pools. District administrations need to immediately implement contingency plans for conserving water.

This chart shows the full reservoir level (blue) and current #water storage level (orange) for dams (by size) 69-91 pic.twitter.com/9LGQIddla6 — Indiaclimate (@Indiaclimate) April 16, 2016

Second chart: full reservoir level (blue) and current #water storage level (orange) for dams (by size) 46-68 pic.twitter.com/liMPJKoqfY

— Indiaclimate (@Indiaclimate) April 16, 2016

Third chart: full reservoir level (blue) and current #water storage level (orange) for dams (by size) 23-45 pic.twitter.com/CKjHboXIF4 — Indiaclimate (@Indiaclimate) April 16, 2016

Fourth chart: full reservoir level (blue) and current #water storage level (orange) for dams (by size) 1-22 pic.twitter.com/1UcvS5QJrE

— Indiaclimate (@Indiaclimate) April 16, 2016

Filed Under: Blogs, Current Tagged With: Bharat, big dam, Central Water Commission, India, reservoir, water, water resources, water shortage

  • 1
  • 2
  • Next Page »

Indiaclimate twitter

Tweets by @Indiaclimate

Notable

Between contemplation and climate

Whether or not the USA, Europe, the Western world, the industrialised Eastern world (China, Japan, South Korea, Taiwan), adhere to or not their paltry promises about being more responsible concerning the factors that lead to climate change, is of very little concern to us. We have never set any store by international agreements on climate […]

The ‘Hindu’, ignorant about weather and climate, but runs down IMD

We find objectionable the report by ‘The Hindu’ daily newspaper accusing the India Meteorological Department of scientific shortcoming (‘IMD gets its August forecast wrong’, 1 September 2016). The report claims that the IMD in June 2016 had forecast that rains for August would be more than usual but that the recorded rain was less than […]

dialogue

  • Misreading monsoon | Resources Research on Misreading monsoon
  • Satish on A tribute to the weathermen of Bharat
  • Climate portal editor on A tribute to the weathermen of Bharat
  • Climate portal editor on A tribute to the weathermen of Bharat
  • Climate portal editor on A tribute to the weathermen of Bharat

Categories

Copyright © 2025 indiaclimateportal.org.