The India Climate Observatory

Commentary, action and research on climate and development in India

  • Home
  • About
  • Monsoon 2018
  • Current
  • Bulletin
  • Contact
  • Announcements

India becoming 1.4°C warmer until 2045

August 5, 2017 by Climate portal editor Leave a Comment

Launched in 2009 with the support of the Ministry of Earth Sciences (MoES), Government of India, the Centre of Climate Change Research (CCCR) is part of the Indian Institute of Tropical Meteorology (IITM) in Pune, Maharashtra. The CCCR focuses on development of new climate modelling capabilities in India and South Asia to address issues concerning the science of climate change.

The Centre has now released an ‘Interim Report on Climate Change over India’ which is intended to provide a brief overview of: (a) updated assessment of observed climate change over India, (b) future climate projections over India, (c) development of the IITM Earth System Model to better understand and quantify climate change and its regional impacts. The three topics, which are among the core research activities of the CCCR at IITM, have been presented as three chapters in this Interim Report, and an updated report is planned to be submitted later next year.

Assessments of impacts of climate change and future projections over the Indian region, have so far relied on a single regional climate model (RCM) such as the PRECIS RCM of the Hadley Centre, UK. While these assessments have provided inputs to various reports (INCCA 2010; NATCOMM2 2012), it is important to have an ensemble of climate projections drawn from multiple RCMs due to large uncertainties in regional-scale climate projections. Ensembles of multi-RCM projections driven under different perceivable socio-economic scenarios are required to capture the probable path of growth, and provide the behavior of future climate and impacts on various biophysical systems and economic sectors dependent on such systems. [The full report is available here (pdf).]

The Centre for Climate Change Research, Indian Institute of Tropical Meteorology (CCCR-IITM) has generated an ensemble of high resolution downscaled projections of regional climate and monsoon over South Asia until 2100 for the Intergovernmental Panel for Climate Change (IPCC) using a RCM (ICTP-RegCM4) at 50 km horizontal resolution, by driving the regional model with lateral and lower boundary conditions from multiple global atmosphere-ocean coupled models from the Coupled Model Intercomparison Project Phase 5 (CMIP5). The future projections are based on three Representation Concentration Pathway (RCP) scenarios (viz., RCP2.6, RCP4.5, RCP8.5) of the IPCC.

These high-resolution downscaled projections of regional climate over South Asia are generated as part of the International Programme called Coordinated Regional Downscaling Experiment (CORDEX) sponsored by the World Climate Research Programme. This chapter provides a synthesis of results from the CORDEX South Asia multi-RCM outputs, that allows us to interpret the strengths and limitations of future regional climate projections over India. This information is useful to reduce uncertainty of impact assessment estimates to an extent and provide a pan-Indian regional assessment for informed policy-making.

Key points

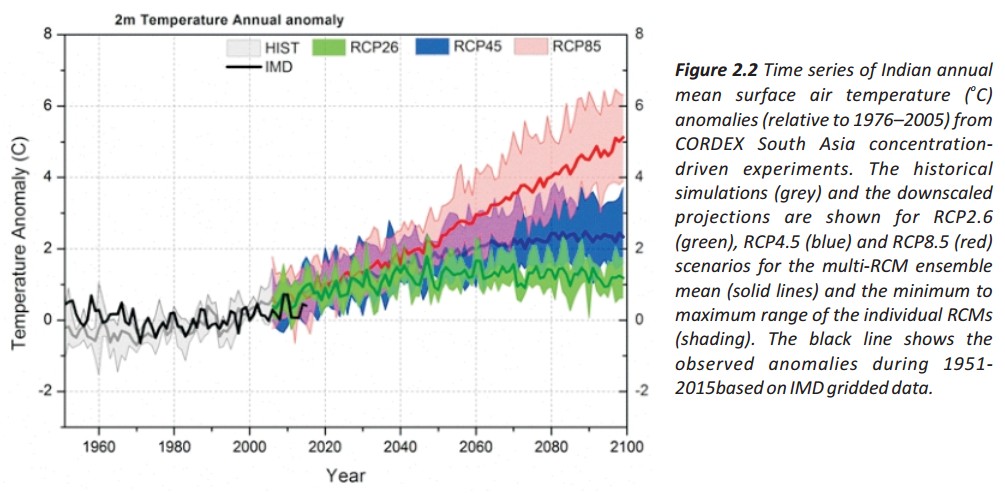
⊗ The all India mean surface air temperature change for the near-term period 2016–2045 relative to 1976–2005 is projected to be in the range of 1.08°C to 1.44°C, and is larger than the natural internal variability. This assessment is based on a reliability ensemble average (REA) estimate incorporating each RCM performance and convergence, and is associated with less than 16% uncertainty range.

⊗ The all India mean surface air temperature is projected to increase in the far future (2066–2095) by 1.35 ±   0.23°C under RCP2.6, 2.41 ± 0.40°C under RCP4.5 and 4.19 ± 0.46°C under RCP8.5 scenario respectively. These changes are relative to the period 1976–2005. The semi-arid north-west and north India will likely warm more rapidly than the all India mean.

⊗ Monthly increase in all India mean surface air temperature based on REA estimate is relatively higher during winter months than in the summer monsoon months throughout the 21st century under the three RCP scenarios.

⊗ The REA changes for all India annual minimum temperature of 4.43 ± 0.34oC is more pronounced than that of 3.94 ± 0.45oC and 4.19 ± 0.46oC increases estimated for the respective annual maximum and mean temperatures respectively the end of the 21st century under RCP8.5 scenario. The models project substantial changes in temperature extremes over India by the end of the 21st century, with a likely overall decrease in the number of cold days and nights, and increase in the number of warm days and nights.

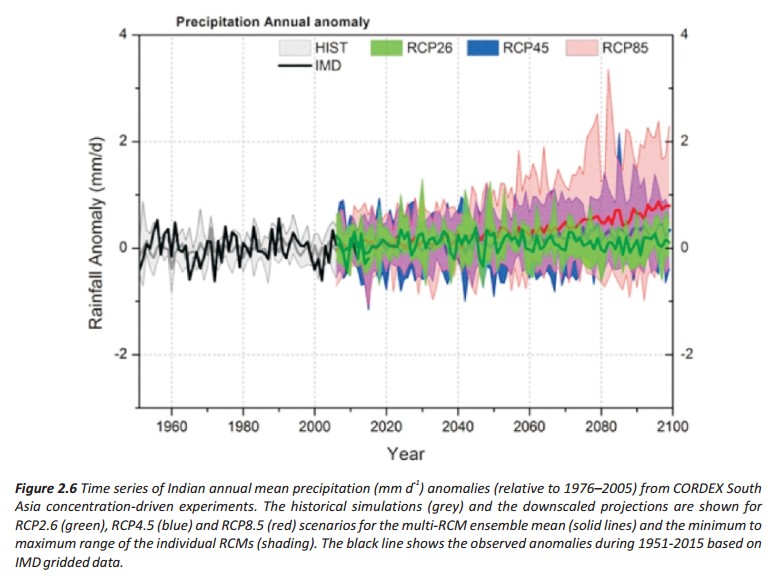
⊗ Although the all India annual precipitation is found to increase as temperature increases, the REA assessment indicates that precipitation changes throughout the 21st century remain highly uncertain.

⊗ The all India annual precipitation extremes are projected to increase with relatively higher uncertainty under RCP8.5 scenario by the end of the 21st century. The downscaled projections suggest that intensification of both dry and wet seasons is expected along the west coast of India and in the adjoining peninsular region.

The multi-RCM ensemble mean annual precipitation mid-term increase exceeds 10% over the west coast and the adjoining southern parts of the Indian peninsula for RCP4.5 scenario, while in the long-term the change for this mid-scenario exceeds 20% over the south-west coast and the adjoining Kerala state. The precipitation changes are not significant over the remaining parts of India for this mid-scenario up to the mid 21st century, however in long-term increase exceed 10% over north-west and adjoining parts of the country. The long-term projected annual precipitation increase exceeds 10% over most parts of India except in Jammu and Kashmir under RCP8.5 scenario, with relatively higher increase exceeding 30% projected along the west coast of India for this high-emission scenario by the end of 21st century.


Filed Under: Current Tagged With: Climate Change, earth sciences, earth system model, Hadley Centre, IITM, India, IPCC, MoES, precipitation, RCP, regional climate model, temperature, Tropical Meteorology

Prepare for May heat

May 4, 2016 by Climate portal editor Leave a Comment

ICP_May_heat_20160504
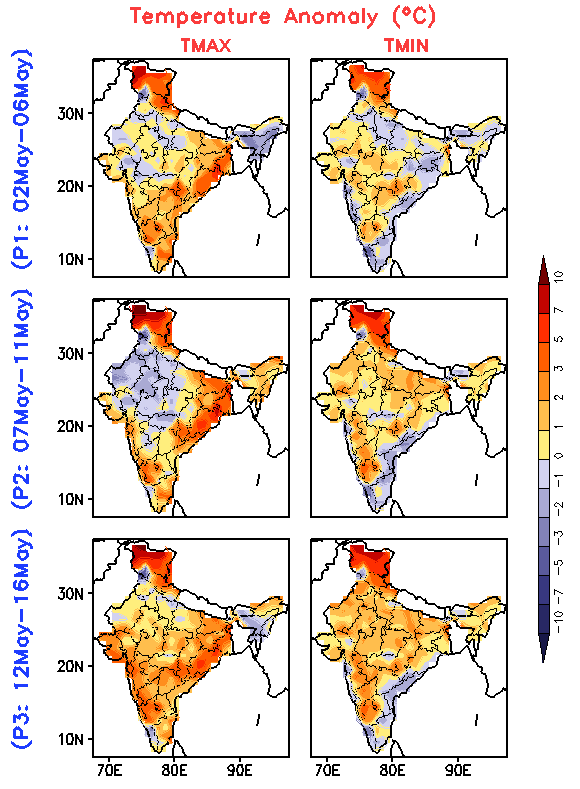
The heat outlook for the first half of May, which was released by the India Meteorological Department (IMD) on 02 May, calls for immediate attention and preparation on all fronts.

The forecast is for three periods of five days each (called pentads) with expected temperature anomalies given for maximum and minimum temperatures. The big picture is that over some parts of the country maximum temperatures will remain 3-4 C above normal for all the three pentads.

Minimum temperatures that are 1-5 degrees higher than normal will increase in terms of the geographical range as the days progress through the first, second and third pentad: 02 to 06 May, 07 to 11 May and 12 to 16 May.

There are several particular alerts arising from the IMD heat wave outlook:

The heat outlook for the first half of May, released by the India Meteorological Department (IMD), for the three five-day periods of 02 to 06 May, 07 to 11 May and 12 to 16 May.

The heat outlook for the first half of May, released by the India Meteorological Department (IMD), for the three five-day periods of 02 to 06 May, 07 to 11 May and 12 to 16 May.

1. Odisha, Gangetic West Bengal and south Chhattisgarh, which have seen some record-breaking high temperatures in April, will continue to see above normal maximum temperatures.

2. South Interior Karnataka, coastal Maharashtra and Goa (the Konkan), and Saurashtra will experience a gradual rise in maximum temperatures from the first to third pentad.

3. Maximum and minimum temperatures both, in Jammu and Kashmir, Himachal Pradesh and Uttarakhand will remain around 5 C above normal for the duration of the forecast.

4. The 12 to 16 May period (third pentad) will see higher than normal maximum temperatures (2 to 5 C) over almost the entire country, and higher than normal minimum temperatures over most of the country.

Other observations are:

5. The North-East will experience minimum temperatures about a degree higher than normal during 07 to 16 May.

6. For the second pentad, that is 07 to 11 May, maximum temperatures in north-west India (Punjab, Haryana, western Uttar Pradesh, Rajasthan, western Madhya Pradesh, Delhi) will drop by 2 to 3 C.

7. Coastal Andhra Pradesh, Rayalaseem and Tamil Nadu will experience lower minimum temperatures by 1 to 2 C during 07 to 16 May.

Please observe basic precautions during this period in particular: eat smaller meals more often; drink water even when not thirsty; avoid tea, coffee and alcohol; plan your activities to avoid being outdoors during 11am to 4pm; do not leave children in cars by themselves; keep a watch on the elderly especially those who are infirm or invalid; wear non-synthetic non-polyester light-coloured and loose fitting clothes; if working outdoors rest frequently; provide drinking water and shade to animals and pets.

Filed Under: Current Tagged With: Bharat, climate, drought, forecast, heat, heat wave, IMD, India, India Meteorological Department, temperature, water

Preparing for the Indian summer

April 1, 2016 by Climate portal editor Leave a Comment

ICP_insat_20160101

The India Meteorological Department (IMD) has issued its forecast for the 2016 hot weather season (April to June). The forecast shows that during the 2016 hot weather season, temperatures (mean, maximum and minimum) in all the sub-divisions are likely to be above normal. All the temperatures (maximum, minimum and mean) of most of the subdivisions from northwest India, Kerala from south India and Vidharbha from Central India are likely to be above normal by 1.0° C or more. Read the full forecast document here (pdf).

The season averaged maximum temperatures of coastal Andhra Pradesh, Odisha, Assam and Meghalaya, sub-Himalayan west Bengal and Sikkim, and NMMT – Nagaland, Manipur, Mizoram and Tripura – are likely to be warmer by 0.5° C and that of the remaining subdivisions are likely to warmer than normal by 0.5° to 1° C. The season averaged minimum temperatures of sub-Himalayan west Bengal and Sikkim, and NMMT are likely to be warmer than normal by <0.5° C and that of the remaining subdivisions are likely to warmer than normal by 0.5° to 1° C.

There is also a high probability (76%) of maximum temperatures in the core heat wave zone during the 2016 hot weather season to be above normal. The core heat wave zone covers the states of Punjab, Himachal Pradesh, Uttarakhand, the National Capital Territory and Delhi, Haryana, Rajasthan, Uttar Pradesh, Gujarat, Madhya Pradesh, Chhattisgarh, Bihar, Jharkhand, West Bengal, Odisha and Telengana and the meteorological sub-divisions of Marathwada, Vidharbha, Madhya Maharashtra and coastal Andhra Pradesh. This in turn suggests high probability of moderate and severe heat wave conditions in the core heat wave zone during the hot weather season.

From this season, the IMD will also provide extended range forecasts (five–day averaged forecasts for the next 15 days) of heat wave conditions over the country. This will be based on the Dynamical Extended Range Forecasting System developed by the Indian Institute of Tropical Meteorology (IITM) in Pune. The forecast will consist of the probability of occurrence of hot days, heat waves and severe heat waves for the next 15 days updated every fifth day from 1 April, 2016. The forecasts will be available on the IMD website.

Filed Under: Latest Tagged With: Bharat, heat, heat wave, hot weather, IMD, India, India Meteorological Department, summer, temperature, पृथ्‍वी विज्ञान, भारत, मौसम

March heat patterns in India

March 25, 2016 by Climate portal editor Leave a Comment

Temperature anomalies expected for March 25-31 in India

From now until the end of March 2016, the maximum temperature anomalies will be less than what has been experienced in March until the 24th.

The India Meteorological Department’s (IMD) numerical weather prediction service has however shown that maximum temperatures will still be above normal by 1 to 3 Celsius over most of central and northern India between 25 and 31 March.

We find that when read with the minimum temperature anomalies, most of peninsular, central and northern India have in March experienced an upward shift in overall temperatures by 1 to 3 Celsius. The meteorological sub-divisions of Telengana, Rayalaseema and coastal Andhra Pradesh in particular stand out for higher minimum temperatures.

Over the last week, maximum temperatures were markedly above normal (5.1° C or more) at most places over West Rajasthan; at many places over Uttarakhand and East Rajasthan; at a few places over Gujarat  and at isolated places over Madhya Pradesh; appreciably above normal (3.1°C to 5.0°C) at most places over Haryana, Chandigarh and Delhi; at many places over Punjab, rest Gujarat and West Madhya Pradesh.

Maximum temperatures were also appreciably above normal at a few places over Madhya Maharashtra and at isolated places over Marathawada, Vidarbha and Kerala; above normal (1.6°C to 3.0°C) at most places over Rayalaseema and West Uttar Pradesh; at many places over Tamil Nadu, Interior Karnataka, East Madhya Pradesh, and the north-eastern states.

Filed Under: Current, Latest Tagged With: 2016, climate, heat, India, summer, temperature

The 1 degree mark we’ll recall 2015 for

November 27, 2015 by Climate portal editor Leave a Comment

ICP_WMO_20151127

The global average surface temperature in 2015 is likely to be the warmest on record and to reach the symbolic and significant milestone of 1° Celsius above the pre-industrial era. This is due to a combination of a strong El Niño and human-induced global warming, according to the World Meteorological Organization (WMO).

The years 2011-2015 have been the warmest five-year period on record, with many extreme weather events – especially heatwaves – influenced by climate change, according to a WMO five-year analysis. Levels of greenhouse gases in the atmosphere reached new highs and in the Northern hemisphere spring 2015 the three-month global average concentration of CO2 crossed the 400 parts per million barrier for the first time. 2015 is likely to be the hottest year on record, with ocean surface temperatures at the highest level since measurements began.  It is probable that the 1°C Celsius threshold will be crossed, said the WMO.

Greenhouse gas emissions, which are causing climate change, can be controlled. We have the knowledge and the tools to act. We have a choice. Future generations will not. Added to that, we are witnessing a powerful El Niño event, which is still gaining in strength. This is influencing weather patterns in many parts of the world and fuelled an exceptionally warm October. The overall warming impact of this El Niño is expected to continue into 2016.

Global annual average temperatures anomalies (relative to 1961-1990) based on an average of three global temperature data sets (HadCRUT.4.4.0.0, GISTEMP and NOAAGlobalTemp) from 1950 to 2014. The 2015 average is based on data from January to October. Bars are coloured according to whether the year was classified as an El Niño year (red), a La Niña year (blue) or an ENSO-neutral year (grey).Note uncertainty ranges are not shown, but are around 0.1°C. Chart: WMO

Global annual average temperatures anomalies (relative to 1961-1990) based on an average of three global temperature data sets (HadCRUT.4.4.0.0, GISTEMP and NOAAGlobalTemp) from 1950 to 2014. The 2015 average is based on data from January to October. Bars are coloured according to whether the year was classified as an El Niño year (red), a La Niña year (blue) or an ENSO-neutral year (grey).Note uncertainty ranges are not shown, but are around 0.1°C. Chart: WMO

WMO issued its provisional statement on the status of the climate in 2015, and an additional five-year analysis for 2011-2015, to inform negotiations at the U.N. Climate Change Conference in Paris. A preliminary estimate based on data from January to October shows that the global average surface temperature for 2015 so far was around 0.73 °C above the 1961-1990 average of 14.0°C and approximately 1°C above the pre-industrial 1880-1899 period.

This temperature tendency indicates that 2015 will very likely be the warmest year on record. The global average sea-surface temperature, which set a record last year, is likely to equal or surpass that record in 2015. The global average temperatures over land areas only from January to October suggest that 2015 is also set to be one of the warmest years on record over land. South America is having its hottest year on record, as is Asia (similar to 2007), and Africa and Europe their second hottest.

According to preliminary figures as of the end of September 2015, 2011-15 was the world’s warmest five-year period on record, at about 0.57°C (1.01°F) above the average for the standard 1961-90 reference period. It was the warmest five-year period on record for Asia, Europe, South America and Oceania, and for North America. WMO compiled the five-year analysis because it provides a longer-term climate signal than the annual report.

Filed Under: Latest Tagged With: Climate Change, CO2, conference, COP21, El Nino, global warming, greenhouse gas, meteorological, ppm, temperature, WMO

Celsius surprises in 57 cities

May 21, 2015 by Climate portal editor Leave a Comment

ICP_57_cities_temp_top

The middle of February is when the chill begins to abate. The middle of May is when the monsoon is longed for. In our towns, district headquarters and cities, that climatic journey of 90 days is one of a steady rise in the reading of the temperature gauge, from the low 20s to the mid 30s.

This large panel of 90 days of daily average temperatures shows, in 57 ways, the effects of the rains that almost every district has experienced during the last two months. For each city, the curved line is the long period ‘normal’ for these 90 days, based on daily averages. Also for each city, the second line which swings above and below the ‘normal’ is the one that describes the changes in its daily average from February to May 2015.

[You can download (1.52MB) a full resolution image of the panel here.]

Where this second line crosses to rise above the normal, the intervening space is red, where it dips below is coloured blue. The patches of red or blue are what tell us about the effects of a lingering winter, or rains that have been called ‘unseasonal’ but which we think signal a shift in the monsoon patterns.

Amongst the readings there is to be found some general similarities and also some individual peculiarities. Overall, there are more blue patches than there are red ones, and that describes how most of the cities in this panel have escaped (till this point) the typical heat of April and May. The second noteworthy general finding is that these blue patches occur more frequently in the second half of the 90 days, and so are the result of the rainy spells experienced from March to early May.

Hisar (in Haryana) has remained under the normal temperature line for many more days than above or near it. So have Gorakhpur (Uttar Pradesh), Pendra (Chhattisgarh), Ranchi (Jharkhand), Nagpur (Maharashtra) and Jharsuguda (Odisha).

On the other hand in peninsular and south India, the below ‘normal’ daily average temperature readings are to be found in the latter half of the time period, coinciding with the frequent wet spells. This we can see in Kakinada, Kurnool and Anantapur (Andhra Pradesh), Bangalore, Gadag and Mangalore (Karnataka), Chennai, Cuddalore and Tiruchirapalli (Tamil Nadu) and Thiruvananthapuram (Kerala). [A zip file with the charts for all 57 cities is available here (1.2MB).]

What pattern will the next 30 days worth of temperature readings follow? In four weeks we will update this bird’s eye view of city temperatures, by which time monsoon 2015 should continue to give us more blues than reds. [Temperature time series plots are courtesy the NOAA Center for Weather and Climate Prediction.]

Filed Under: Current, Monsoon 2015, Reports & Comment Tagged With: Anantapur, Andhra Pradesh, Bangalore, Chennai, Chhattisgarh, city, climate, Cuddalore, Gadag, Gorakhpur, India, Jharkhand, Jharsuguda, Kakinada, Karnataka, Kerala, Kurnool, Maharashtra, Mangalore, monsoon, Nagpur, Odisha, Ranchi, Tamil Nadu, temperature, Thiruvananthapuram, Tiruchirapalli, town, urban, Uttar Pradesh

Indiaclimate twitter

Tweets by @Indiaclimate

Notable

Between contemplation and climate

Whether or not the USA, Europe, the Western world, the industrialised Eastern world (China, Japan, South Korea, Taiwan), adhere to or not their paltry promises about being more responsible concerning the factors that lead to climate change, is of very little concern to us. We have never set any store by international agreements on climate […]

The ‘Hindu’, ignorant about weather and climate, but runs down IMD

We find objectionable the report by ‘The Hindu’ daily newspaper accusing the India Meteorological Department of scientific shortcoming (‘IMD gets its August forecast wrong’, 1 September 2016). The report claims that the IMD in June 2016 had forecast that rains for August would be more than usual but that the recorded rain was less than […]

dialogue

  • Misreading monsoon | Resources Research on Misreading monsoon
  • Satish on A tribute to the weathermen of Bharat
  • Climate portal editor on A tribute to the weathermen of Bharat
  • Climate portal editor on A tribute to the weathermen of Bharat
  • Climate portal editor on A tribute to the weathermen of Bharat

Categories

Copyright © 2025 indiaclimateportal.org.