Our view of where water falls during the monsoon and where it is used has tended to follow the administrative unit view. That is, which state has experienced normal, above normal or deficient rainfall or which meteorological division has experienced normal, above normal or deficient rainfall.
Such a view has obscured an important ground reality, and this is that when it rains, surface water follows the contours and topography of watersheds and third-level basins, themselves subsets of sub-basins and then river basins. Thus when rain falls, water collects and begins to flow, it is natural to look for where it flows and where it may be collected instead of whether it is measured on one side or another of an imaginary boundary, which is what a district or state boundary is.
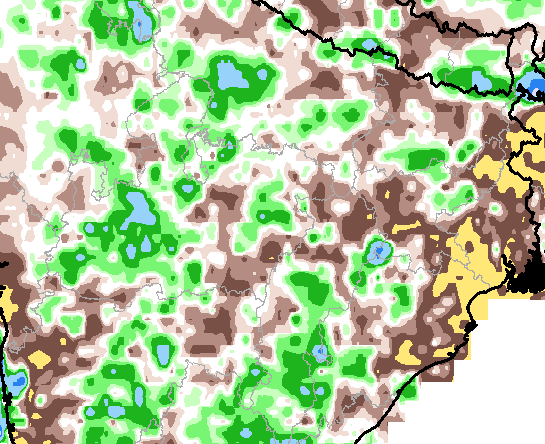
Rainfall anomalies in millimetres for 01-26 June. Greens/blues are above, browns/ochres are below. This section which includes Maharashtra, Madhya Pradesh, Chhattisgarh, Jharkhand, Bihar, Uttar Pradesh and part of Rajasthan shows how deficient areas are interspersed with excess areas. Watersheds could be the answer. Image source: NCEP, CPC
For everything that concerns water – which does mean everything that is essential to us: agriculture, forests, grassy regions and orchards, water that can be used for drinking, rural and urban settlements, commerce and industry – it is the group of hydrological structures we call a river basin (or sub-basin if the basin is a large one) that becomes the spatial region to study and plan for.
We have 36 states and union territories and also 36 meteorological divisions. These correspond with each other for most of the country and this correspondence, unnecessary and misleading, has led to our incorrect view of where rain falls and how it behaves where it falls. It has been a persistent error because I think of administrative inertia combined with the quite needless politics that surrounds river (or surface) and ground water.
Rain falls upon and rainwater collects and moves surface water then not in a taluka or district, but in a biophysical region which in one way we can describe as a river sub-basin or a large watershed. There are other pieces that make the whole: type of soil, the underlying geological strata, the mix of vegetation, the density and health of forests, the mix of cultivated crops, and the spread and density of human settlements (which use and alter these pieces).

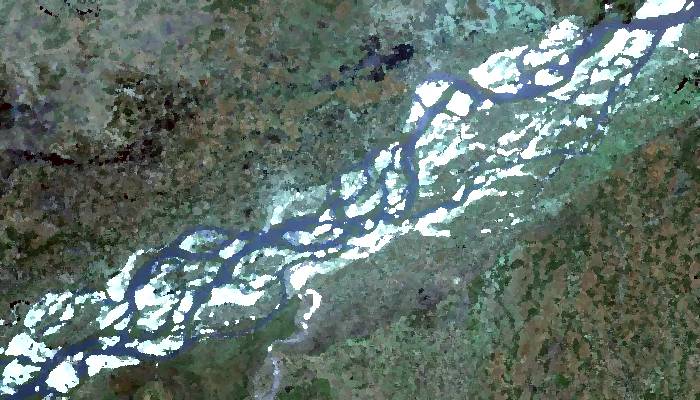
Rainfall as estimated by Insat-3D and mapped in daily images for 14-28 June 2016. The background is the major river basins, not states (click for 386kb full res). The IMD’s RAPID system has this monsoon introduced river basins as a base map. Images source: IMD/ISRO RAPID

Table of river basins and sub-basins with sizes. Source: WRIS
We know which our major rivers are, and those of us who are curious enough about the biophysical pieces that determine the characteristics of the regions in which we live also know the names of lesser rivers. How many river sub-basins are there in Bharat?
There are several answers because there have been (and continue to be) several authorities whose work it is to assess and measure water. Their methodologies differ somewhat each from the other, and that is why they not only give us differing numbers of major river basins but also – for those basins whose names are the same – differing sizes for a single river basin.
The Water Resources Information System (WRIS) which is the newest methodical system and which has come about because of our remote sensing expertise, has the most detailed information about our river basins. There are also the Central Water Commission, the National Commission for Integrated Water Resources Development Plan, the All India Soil and Land Use Survey, and the Central Ground Water Board.
Depending on their thematic orientation, these have (in their early forms which date back to the late 1940s) conducted detailed surveys of river basins and districts, outlined hydrological units, catchment zones, river valley projects, watersheds and have through such mechanisms steered (at times forced) states into recognising that river basins are at least as important as state boundaries.
How many are there? The WRIS informs us that there are 26 river basins and 102 sub-basins. Thus there are about three times as many sub-basins as there are states (and UTs) and there is one sub-basin for about every six districts. The biggest river basins are those of the Ganga (808,334 square kilometres), the Indus (till the border, 453,931 sq km), Godavari (302,063 sq km) and Krishna (254,743 sq km). The 102 sub-basins have a median size (excluding the very smallest) of 29,200 sq km and range from 1,676 sq km to 99,040 sq km for the Brahmaputra Upper and 125,084 sq km for the Yamuna Lower basins. The larger sub-basins (there are 14 whose geographic sizes are more than 50,000 sq km) contain dozens of watersheds each (there are some 3,200 in Bharat).
In the small hydrological units that we call watersheds, and in the larger ones we call sub-basins and river basins, is where the rain falls and where it needs to be measured and counted. This our earth sciences agencies already do. It is up to us and up to administrators of districts, states and particularly of all Class I and larger cities to alter the manner in which we look at the water that falls in this wondrous season upon our earth.
— Rahul Goswami


 From the first week of June 2014 until the middle of September 2014, there have been floods and conditions equivalent to drought in many districts, and for India the tale of monsoon 2014 comes from a reading of individual districts, not from a national ‘average’ or a ‘cumulative’. [


