The India Climate Observatory

Commentary, action and research on climate and development in India

  • Home
  • About
  • Monsoon 2018
  • Current
  • Bulletin
  • Contact
  • Announcements

The 1 degree mark we’ll recall 2015 for

November 27, 2015 by Climate portal editor Leave a Comment

ICP_WMO_20151127

The global average surface temperature in 2015 is likely to be the warmest on record and to reach the symbolic and significant milestone of 1° Celsius above the pre-industrial era. This is due to a combination of a strong El Niño and human-induced global warming, according to the World Meteorological Organization (WMO).

The years 2011-2015 have been the warmest five-year period on record, with many extreme weather events – especially heatwaves – influenced by climate change, according to a WMO five-year analysis. Levels of greenhouse gases in the atmosphere reached new highs and in the Northern hemisphere spring 2015 the three-month global average concentration of CO2 crossed the 400 parts per million barrier for the first time. 2015 is likely to be the hottest year on record, with ocean surface temperatures at the highest level since measurements began.  It is probable that the 1°C Celsius threshold will be crossed, said the WMO.

Greenhouse gas emissions, which are causing climate change, can be controlled. We have the knowledge and the tools to act. We have a choice. Future generations will not. Added to that, we are witnessing a powerful El Niño event, which is still gaining in strength. This is influencing weather patterns in many parts of the world and fuelled an exceptionally warm October. The overall warming impact of this El Niño is expected to continue into 2016.

Global annual average temperatures anomalies (relative to 1961-1990) based on an average of three global temperature data sets (HadCRUT.4.4.0.0, GISTEMP and NOAAGlobalTemp) from 1950 to 2014. The 2015 average is based on data from January to October. Bars are coloured according to whether the year was classified as an El Niño year (red), a La Niña year (blue) or an ENSO-neutral year (grey).Note uncertainty ranges are not shown, but are around 0.1°C. Chart: WMO

Global annual average temperatures anomalies (relative to 1961-1990) based on an average of three global temperature data sets (HadCRUT.4.4.0.0, GISTEMP and NOAAGlobalTemp) from 1950 to 2014. The 2015 average is based on data from January to October. Bars are coloured according to whether the year was classified as an El Niño year (red), a La Niña year (blue) or an ENSO-neutral year (grey).Note uncertainty ranges are not shown, but are around 0.1°C. Chart: WMO

WMO issued its provisional statement on the status of the climate in 2015, and an additional five-year analysis for 2011-2015, to inform negotiations at the U.N. Climate Change Conference in Paris. A preliminary estimate based on data from January to October shows that the global average surface temperature for 2015 so far was around 0.73 °C above the 1961-1990 average of 14.0°C and approximately 1°C above the pre-industrial 1880-1899 period.

This temperature tendency indicates that 2015 will very likely be the warmest year on record. The global average sea-surface temperature, which set a record last year, is likely to equal or surpass that record in 2015. The global average temperatures over land areas only from January to October suggest that 2015 is also set to be one of the warmest years on record over land. South America is having its hottest year on record, as is Asia (similar to 2007), and Africa and Europe their second hottest.

According to preliminary figures as of the end of September 2015, 2011-15 was the world’s warmest five-year period on record, at about 0.57°C (1.01°F) above the average for the standard 1961-90 reference period. It was the warmest five-year period on record for Asia, Europe, South America and Oceania, and for North America. WMO compiled the five-year analysis because it provides a longer-term climate signal than the annual report.
Filed Under: Latest Tagged With: Climate Change, CO2, conference, COP21, El Nino, global warming, greenhouse gas, meteorological, ppm, temperature, WMO

The state of the climate, scarier than ever before

July 20, 2015 by Climate portal editor Leave a Comment

ICP_NOAA_climate_report_201507

Most essential indicators of Earth’s changing climate continued to reflect trends of a warming planet, with several markers such as rising land and ocean temperature, sea levels and greenhouse gases setting new records.

The latest report which explains these indicators, compiled by the NOAA Center for Weather and Climate at the National Centers for Environmental Information is based on contributions from 413 scientists from 58 countries. It provides a detailed update on global climate indicators, notable weather events, and other data collected by environmental monitoring stations and instruments located on land, water, ice, and in space.

The report represents data from around the globe and gives us a picture of what happened in 2014. The variety of indicators shows us how our climate is changing, not just in temperature but from the depths of the oceans to the outer atmosphere. The report’s climate indicators show patterns, changes and trends of the global climate system. Examples of the indicators include various types of greenhouse gases; temperatures throughout the atmosphere, ocean, and land; cloud cover; sea level; ocean salinity; sea ice extent; and snow cover.

Key highlights from the report include (get the full report here, find a summary here):

* Greenhouse gases continued to climb: Major greenhouse gas concentrations, including carbon dioxide, methane and nitrous oxide, continued to rise during 2014, once again reaching historic high values. Atmospheric CO2 concentrations increased by 1.9 ppm in 2014, reaching a global average of 397.2 ppm for the year. This compares with a global average of 354.0 in 1990 when this report was first published just 25 years ago.

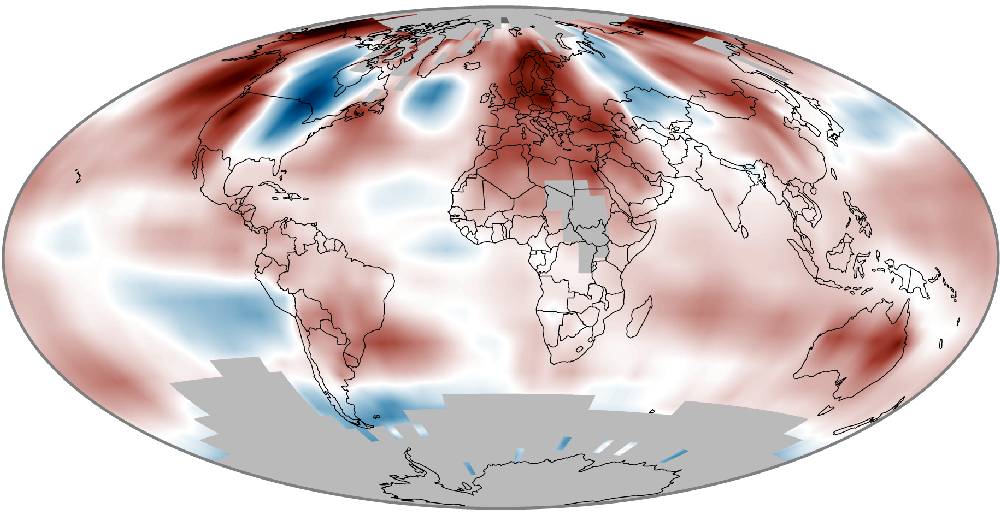
* Record temperatures observed near the Earth’s surface: Four independent global datasets showed that 2014 was the warmest year on record. The warmth was widespread across land areas. Europe experienced its warmest year on record, with more than 20 countries exceeding their previous records. Africa had above-average temperatures across most of the continent throughout 2014, Australia saw its third warmest year on record, Mexico had its warmest year on record, and Argentina and Uruguay each had their second warmest year on record. Eastern North America was the only major region to experience below-average annual temperatures.

Surface temperature anomalies in 2014. Image: NOAA Center for Weather and Climate

Surface temperature anomalies in 2014. Image: NOAA Center for Weather and Climate

* Tropical Pacific Ocean moves towards El Niño–Southern Oscillation conditions: The El Niño–Southern Oscillation was in a neutral state during 2014, although it was on the cool side of neutral at the beginning of the year and approached warm El Niño conditions by the end of the year. This pattern played a major role in several regional climate outcomes.

* Sea surface temperatures were record high: The globally averaged sea surface temperature was the highest on record. The warmth was particularly notable in the North Pacific Ocean, where temperatures are in part likely driven by a transition of the Pacific decadal oscillation – a recurring pattern of ocean-atmosphere climate variability centered in the region.

* Global upper ocean heat content was record high: Globally, upper ocean heat content reached a record high for the year, reflecting the continuing accumulation of thermal energy in the upper layer of the oceans. Oceans absorb over 90 percent of Earth’s excess heat from greenhouse gas forcing.

* Global sea level was record high: Global average sea level rose to a record high in 2014. This keeps pace with the 3.2 ± 0.4 mm per year trend in sea level growth observed over the past two decades.

* The Arctic continued to warm; sea ice extent remained low: The Arctic experienced its fourth warmest year since records began in the early 20th century. Arctic snow melt occurred 20–30 days earlier than the 1998–2010 average. On the North Slope of Alaska, record high temperatures at 20-meter depth were measured at four of five permafrost observatories. The Arctic minimum sea ice extent reached 1.94 million square miles on September 17, the sixth lowest since satellite observations began in 1979. The eight lowest minimum sea ice extents during this period have occurred in the last eight years.

* The Antarctic showed highly variable temperature patterns; sea ice extent reached record high: Temperature patterns across the Antarctic showed strong seasonal and regional patterns of warmer-than-normal and cooler-than-normal conditions, resulting in near-average conditions for the year for the continent as a whole. The Antarctic maximum sea ice extent reached a record high of 7.78 million square miles on September 20. This is 220,000 square miles more than the previous record of 7.56 million square miles that occurred in 2013. This was the third consecutive year of record maximum sea ice extent.

* Tropical cyclones above average overall: There were 91 tropical cyclones in 2014, well above the 1981–2010 average of 82 storms. The 22 named storms in the Eastern/Central Pacific were the most to occur in the basin since 1992. Similar to 2013, the North Atlantic season was quieter than most years of the last two decades with respect to the number of storms.

Filed Under: Current Tagged With: Arctic, climate, El Nino, ENSO, greenhouse gas, NOAA, sea ice, Southern Oscillation, thermal energy

No time left: the IPCC message

November 3, 2014 by Climate portal editor Leave a Comment

RG_ICP_20141103

In the just released synthesis report of the Fifth Assessment by the Intergovernmental Panel on Climate Change (IPCC), there is one short section that must be read and understood quickly by India, our neighbours in South Asia and by the so-called ‘developing’ and ‘less developed’ countries.

This is a section – ‘3.1 Foundations of decision-making about climate change’ – in the ‘Approved Summary for Policymakers’ of the IPCC Fifth Assessment Synthesis Report.

The section has explained: “Climate change has the characteristics of a collective action problem at the global scale, because most greenhouse gases accumulate over time and mix globally, and emissions by any agent (individual, community, company, country) affect other agents.”

IPCC_AR5_SPM_headlinesThe section goes on to warn: “Effective mitigation will not be achieved if individual agents advance their own interests independently. Cooperative responses, including international cooperation, are therefore required to effectively mitigate GHG emissions and address other climate change issues.”

These two groups of statements are extremely important for India and our neighbours in Asia. There has been far too much attention and action given to the negotiations about the shape and terms of agreements on climate change (the Kyoto Protocol and its successor) and far too little on what administrative regions must do regardless. Note that this section places “international cooperation” as a sub-set of cooperative responses, not as the starting point.

This view is restated in the same section: “The effectiveness of adaptation can be enhanced through complementary actions across levels, including international cooperation. The evidence suggests that outcomes seen as equitable can lead to more effective cooperation.” [See the headline statements of the summary for policymakers here or click on the image above for a pdf.]

Thus the message to policy-makers is clear – what counts is what you do at home, in states and districts. The expectation that “international cooperation” should guide effective adaptation at all levels is no longer (and in our view has never been) tenable. [The longer synthesis report is available here.]

The Synthesis Report distils and integrates the findings from the AR5, which  is comprised of three working group reports on the ‘Physical Science Basis’ (WG1); ‘Impacts, Adaptation and Vulnerability’ (WG II); and ‘Mitigation of Climate Change’ (WG III). The summary for policymakers of the synthesis report was negotiated line by line among governments and the authors, while the synthesis report itself was adopted page by page.

Filed Under: Key Reports, Latest Tagged With: adaptation, AR5, Climate Change, emissions, energy, Fifth Assessment, fossil fuel, GHG, greenhouse gas, IPCC, mitigation, renewable energy, report

Indiaclimate twitter

Tweets by @Indiaclimate

Notable

Between contemplation and climate

Whether or not the USA, Europe, the Western world, the industrialised Eastern world (China, Japan, South Korea, Taiwan), adhere to or not their paltry promises about being more responsible concerning the factors that lead to climate change, is of very little concern to us. We have never set any store by international agreements on climate […]

The ‘Hindu’, ignorant about weather and climate, but runs down IMD

We find objectionable the report by ‘The Hindu’ daily newspaper accusing the India Meteorological Department of scientific shortcoming (‘IMD gets its August forecast wrong’, 1 September 2016). The report claims that the IMD in June 2016 had forecast that rains for August would be more than usual but that the recorded rain was less than […]

dialogue

  • Misreading monsoon | Resources Research on Misreading monsoon
  • Satish on A tribute to the weathermen of Bharat
  • Climate portal editor on A tribute to the weathermen of Bharat
  • Climate portal editor on A tribute to the weathermen of Bharat
  • Climate portal editor on A tribute to the weathermen of Bharat

Categories

Copyright © 2025 indiaclimateportal.org.