We have compiled the Indiaclimate District Rainfall Adequacy Index for the monsoon season of 2019. As with our previous editions of the index series, this one for the 2019 monsoon applies our innovation to the communicating of the weekly changes in rainfall adequacy as recorded by the India Meteorological Department (IMD).
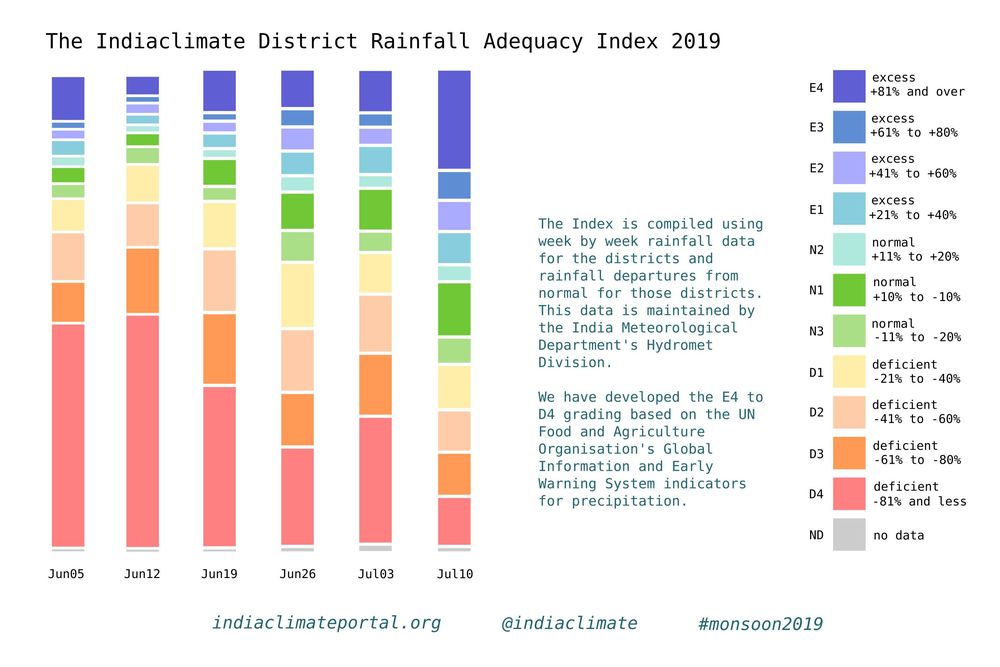
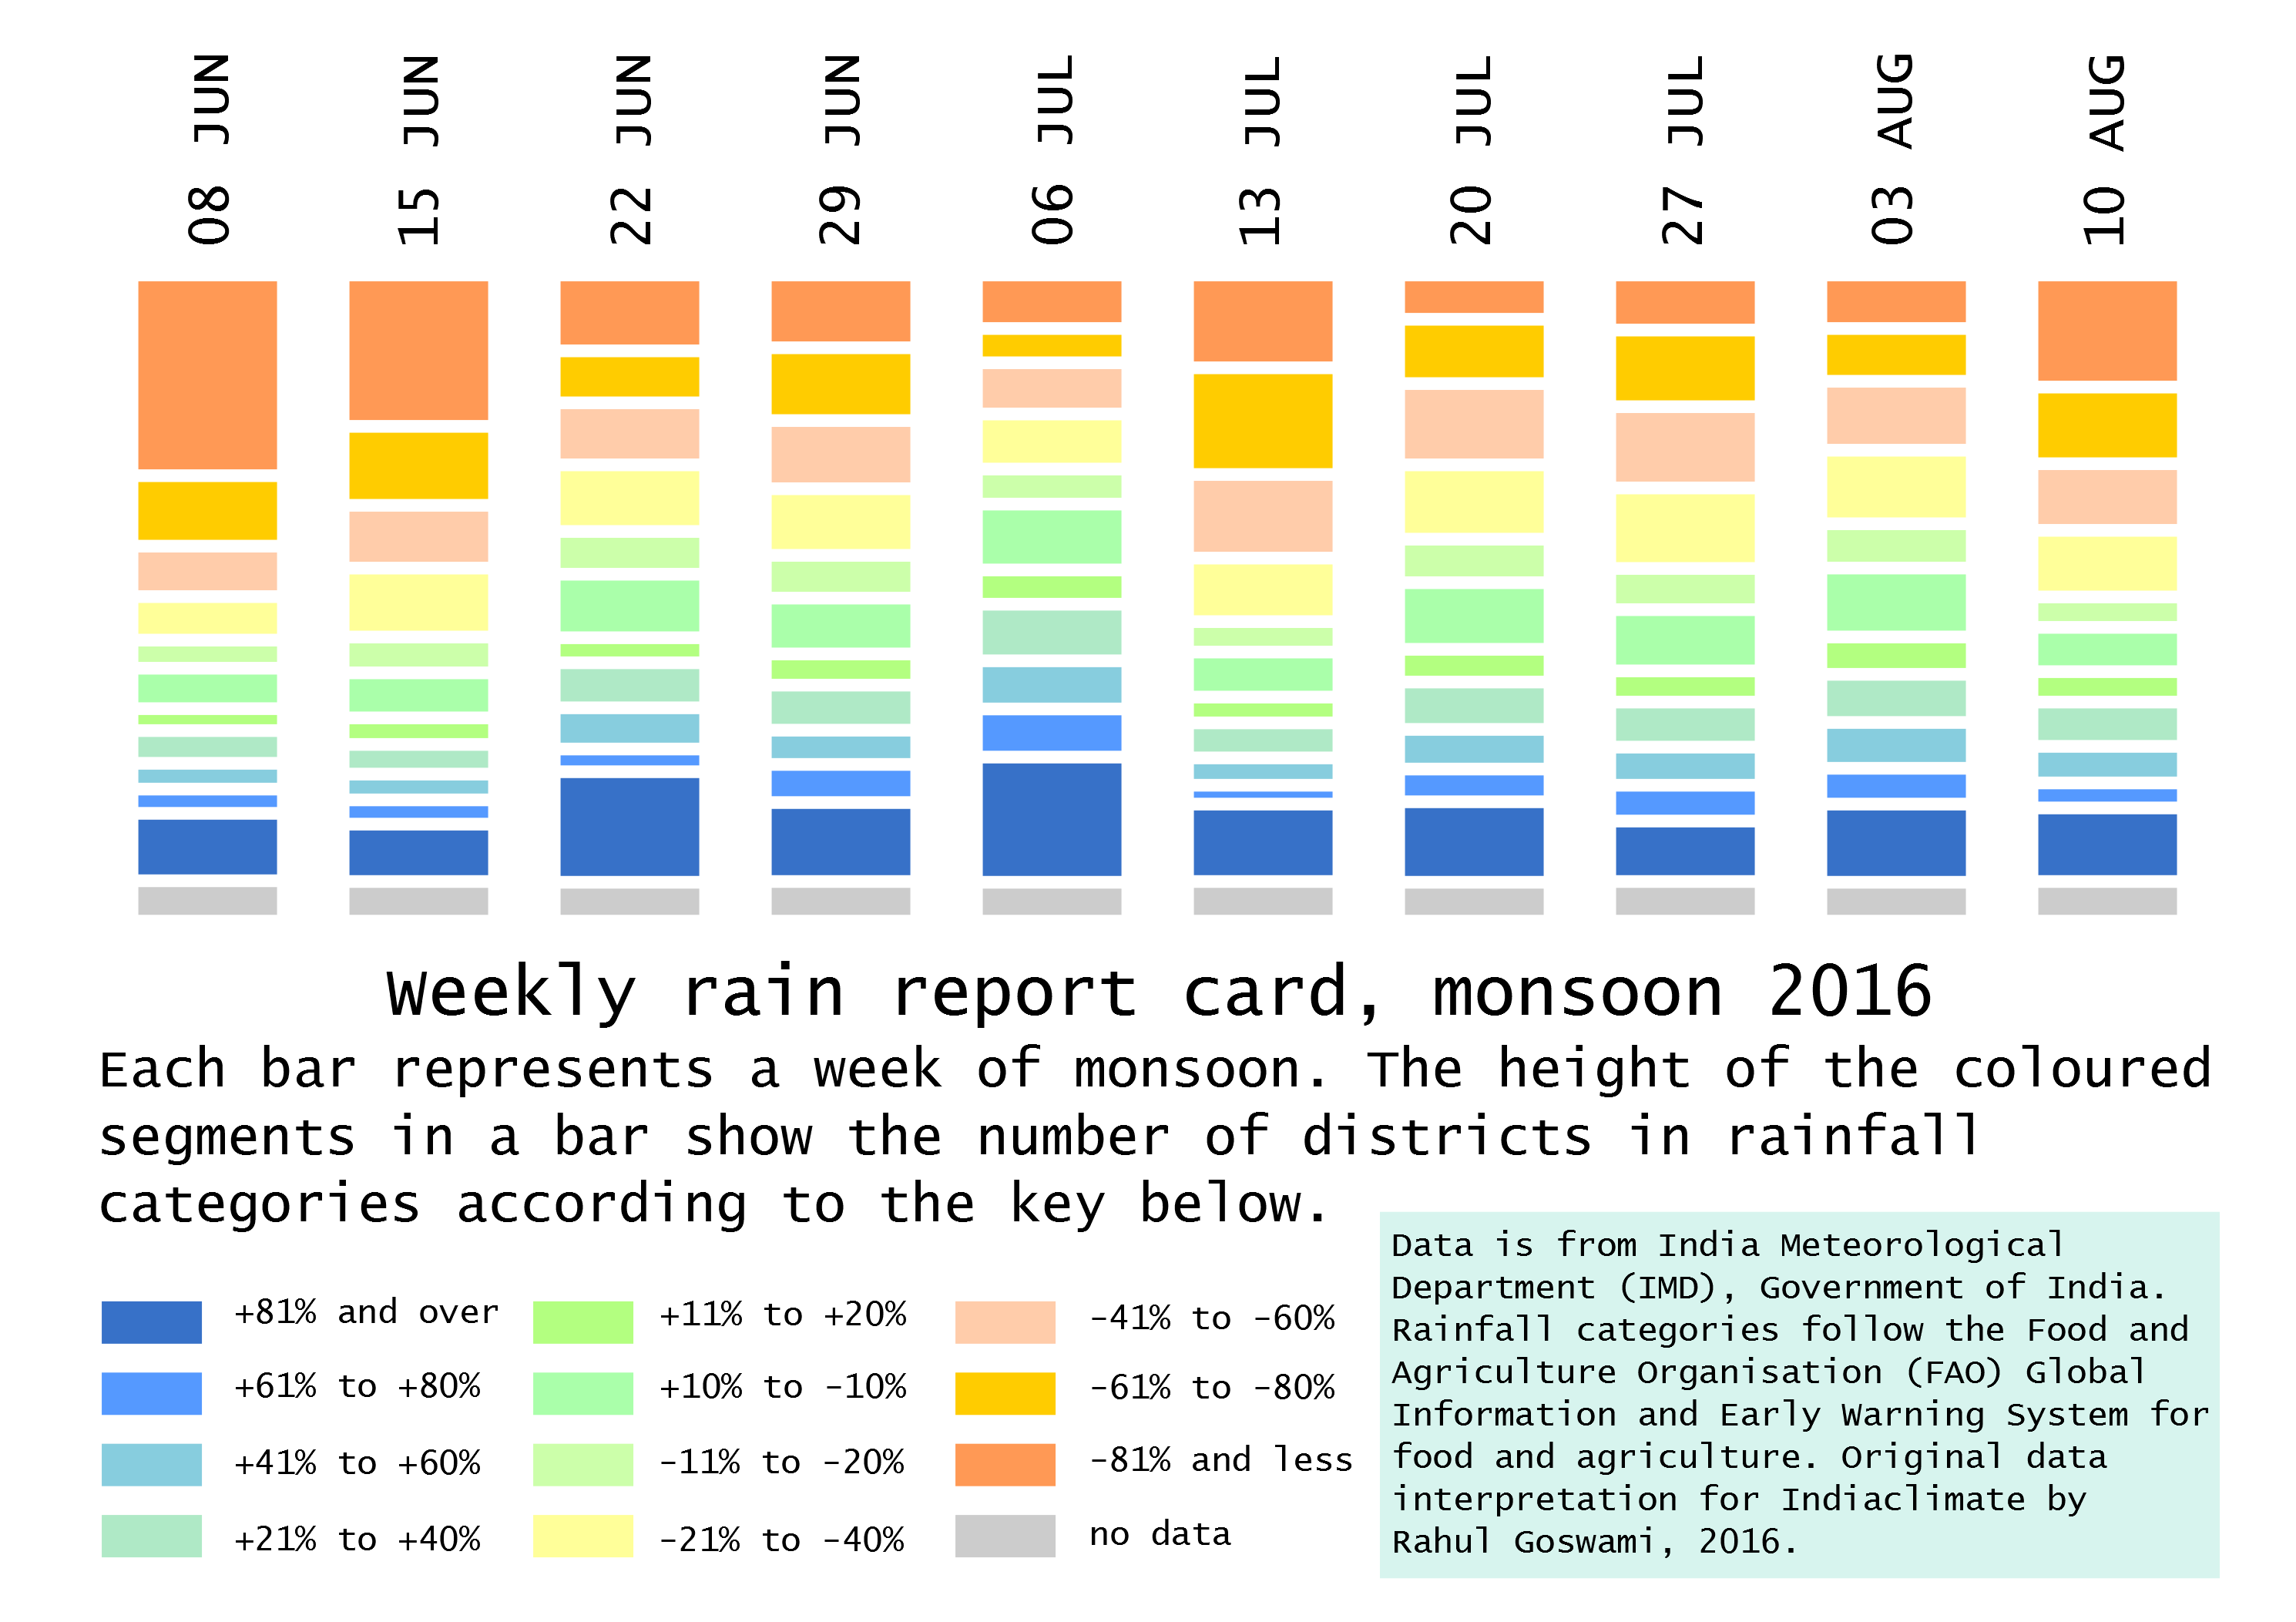
The graph (or visualisation as any such illustration is called nowadays, a word that makes the simple graph or chart sound sophisticated, but which usually complicates matters instead of simplifying them) is easy enough to read and interpret. What you have is several vertical bars, each corresponding to dates a week apart. The bars are made up of coloured segments – there are 11 coloured segments and one grey segment, a total of 12 segments.
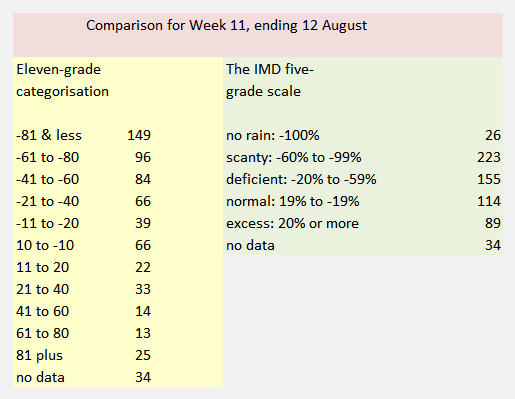
Each of the 11 colours represents the number of districts whose rainfall readings for a week (the week till the date given) fall within the parameters given in the accompanying legend. There are three groups of colours: three segments in the ‘normal’ ranges, four segments in the ‘excess’ ranges and four segments in the ‘deficient’ ranges. Grey represents no data for that week.
The gradation of the segments is based on, but is not a copy of, the grades used by the UN Food and Agriculture Organisation’s (FAO) Global Information and Early Warning System (GIEWS) indicators for precipitation. The numbers that we use are from the IMD’s Hydrometeorology Division, which releases its ‘rainfall departures’ table every week. We take these numbers, reprocess them and redistribute them across the 11 grades.
It is a much more readily readable graph and provides for quick interpretation. The grades are finer than the six used by the IMD: normal (+19% to -195), excess (+20% to +59%), large excess (+60% or more), deficient (-20% to -59%), large deficient (-60% to -99%), no rain (-100%).
Our index, in which most segments are of 20 percentage points, is designed for local administrations – in districts but also municipal bodies – to take their cues from weekly signals and prepare if need be for a drought-like situation with water shortages or a flood-like situation with inundation.
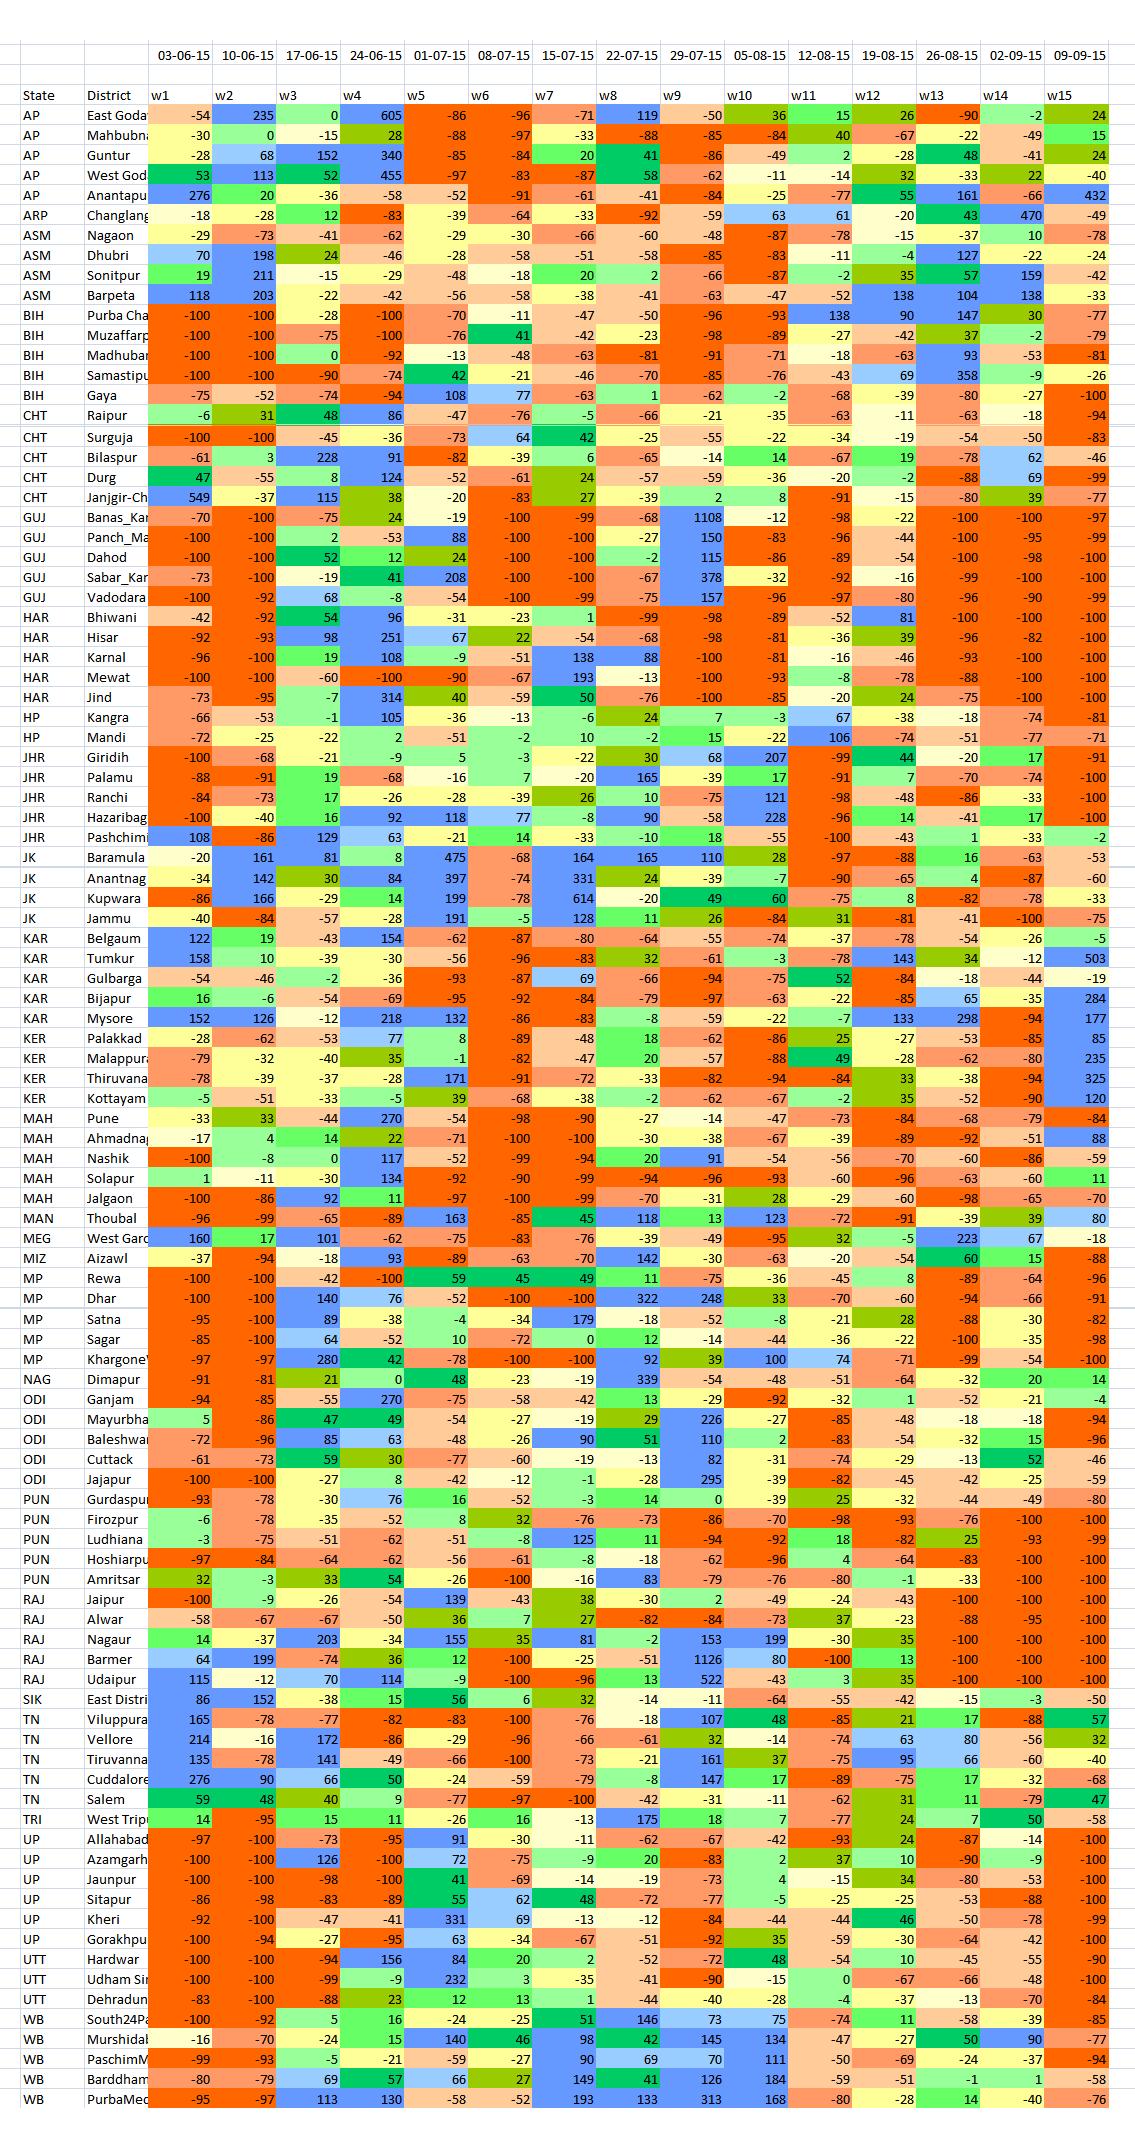
How does it work in practice? Let’s look at the district of Guna, in Madhya Pradesh, in the meteorological sub-division of Western MP. The first two monsoon weeks, ending 5 June and 12 June, Guna received no rain (that is, -100% of the rainfall it normally receives in those weeks) and that corresponds to the D4 indicator. The next week, ending 19 June, it received -29% which is D1, the fourth week (26 June) it slipped back to -72% which is D3, the following week (3 July) it improved to -32% which is again D1 and in the sixth week (10 July) Guna received +34% which took it into the E1 grade.
Normally, a district that has received no rainfall or neglible rainfall for six weeks becomes a candidate for a drought-like condition – water sources after the long and hot summer have dried up and crops become parched. If such conditions continue for another two weeks, the state administration must roll out relief measures.
In our example, for the five weeks until the week of 3 July Guna had two D4s, one D3 and two D1s before coming out of the D grades. Our index gives the district (or town) administration the means with which to set their own triggers for action. If the water sources in the district were still at 10%-15% of their water holding capacities by the week of 3 July, then they could consult the medium term forecasts to gauge whether likely rainfall will be enough to hold off relief action. If not, and stored water slipped under 10% with uncertain forecasts, they could ask for relief and issue appropriate crop advisories.
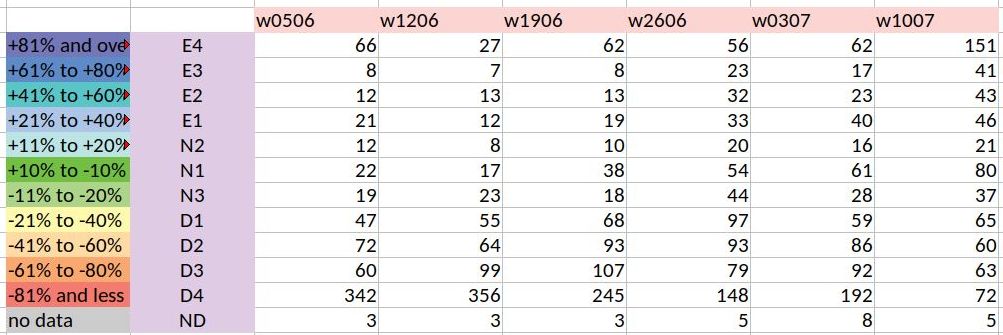
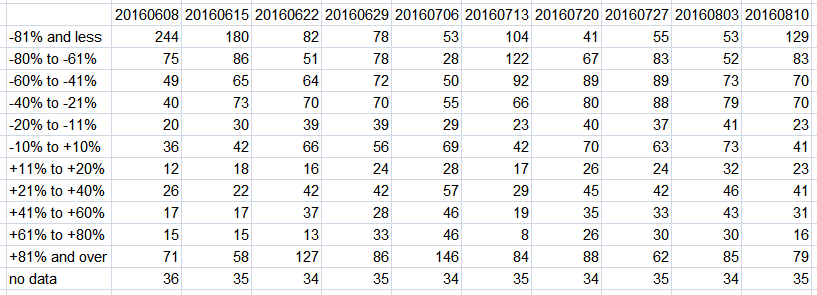
Our index graph – the stacked and segmented bar chart I am sorely tempted to call a ‘signature’ – is a representation of the numbers in the rainweeks table we compile. This table has 684 components which are the districts, each of which has a rainfall reading for the week given (in millimetres) and a rainfall departure (in %). The graph is a set of stacked bars for each week, with each segment sized according to the number of districts in the grade that the segment corresponds to.
What does the index graph for six weeks tell us? The first two monsoon weeks were alarming, with 342 and then 356 districts in the D4 grade. The situation has slowly improved thereafter, with the latest week, that of 10 July, being the best so far – it has 80 districts in the N1 grade. That last week also has for the first time in monsoon 2019 more E grade districts than D grade districts. What needs to be looked out for is districts that have been in the D4 and D3 grades for four and more weeks and whose recovery is patchy. That monitoring becomes much easier with the Indiaclimate District Rainfall Adequacy Index.
Rahul Goswami


 Every one of Haryana’s 21 districts received excess rain for the period 1 March to 30 April 2015. As these rains have destroyed crops, including food staples, the need to compensate the affected farming families is now paramount. Relief and support are only useful when they are arrive quickly, and unlike administrative conditions two generations ago, state governments and district collectors today can consult data around the clock about conditions in districts and blocks.
 What is germane to us is: has the IPCC process and method an Indian outlook that will be of as much utility at home as it has been to the inter-governmental effort? A short answer will be ‘no’ to the first query (because it is about science, evidence and international consensus and not about national priorities) and ‘don’t know’ to the second. There is no reason why a ‘don’t know’ should persist, as the Fifth Assessment process comes to a close, for the size of India’s population and economy, and the likely effects climate change has and is forecast to have on our 35 states and union territories ought to have turned climate change into common currency wherever planning is carried out and implemented.
 From the first week of June 2014 until the middle of September 2014, there have been floods and conditions equivalent to drought in many districts, and for India the tale of monsoon 2014 comes from a reading of individual districts, not from a national ‘average’ or a ‘cumulative’. [

