The Asian Development Bank has, amongst the world’s multilateral development banks, been a bit of a latecomer to the area of climate financing with the help of modelling. Its senior peers – the World Bank and the European Bank for Reconstruction and Development – have been at it for a while, with the World Bank being rather in its own league if one was to judge by the tonnage of reports it has printed. The ADB probably holds its own on the matter against the Inter-American Development Bank and the African Development Bank, but this latest effort, I think, pushes it ahead of the last two.
Not for any reason that would gladden a farmer or a municipal worker, for that is not the audience intended for ‘Assessing the costs of climate change and adaptation in South Asia’ (Asian Development Bank, 2014), which was released to the Asian world a few days ago. But the volume should immensely help the modelling crews from a dozen and more international agencies that specialise in this arcane craft. Providing the scientific basis around which a multilateral lending bank can plan its climate financing strategies will help the craft find a future. Rather less sunny is the outlook for states and districts, cities and panchayats, who may find an over-zealous administrator or two quoting blithely from such a report while in search of elusive ‘mitigation’.
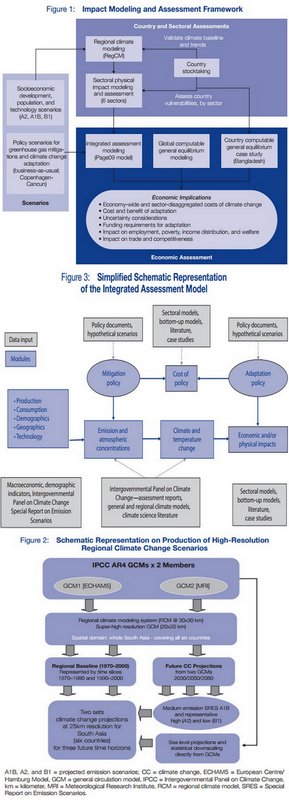
The reassuring shapes of indecipherable models
In my view, this volume is useless. It is so because it is based on a variety of modelling computations which have their origin in the methods used for the IPCC’s Fourth Assessment Report (that was released in 2007). The permanent problem with all such ‘earth science’ modelling approaches is that it uses global data sets which must be ‘downscaled’ to local regions. No matter how sophisticated they are claimed to be by their inventors and sponsors, such models can only work with regular and large sets of well-scrubbed data that have been collected the same way over a long period of time and recorded reliably. This may serve a ‘global’ model (which is irrelevant to us in the districts) but in almost every single case of ‘downscaling’, a scaling down may make a smattering of sense if there is some comparable data relating to the region for which the scaling is taking place. And this correlation, I can assure you, is not possible 99 times out of 100.
But that doesn’t bother the ADB, because it is a bank, it must find a way for Asian countries to agree to taking loans that help them mitigate the effects of rampaging climate change, as this report tries to convince us about. Which is why the ADB has said its unimpeachable analysis is based on “a three-step modeling approach” and this is “(i) regional climate modeling (ii) physical impact assessment, and (iii) economic assessment”, the last aspect being what they’re betting the thermometer on.
The numbers that have emerged from the ADB’s computable general equilibrium model must be satisfyingly enormous to the bank’s thematic project directors and country directors. For the scenario modellers have provided the ammunition for the bank to say: “The region requires funding with the magnitude of 1.3% of GDP on average per annum between 2010 and 2050 under the business-as-usual-1 scenario. The cost could rise to up to 2.3% (upper range) of GDP per annum taking into account climate uncertainties. To avoid climate change impact under the business-as-usual-2 scenario, adaptation cost of around $73 billion per annum on the average is required between now and 2050.”
I could not, in this needlessly dense and poorly written volume, find a mention of which rice strains have been measured for their yields in the example given for India, when the ADB report makes some dire forecasts about how yields will be lowered or will plunge under several forecast conditions. Perhaps they were buried in some footnote I have overlooked, but considering that the International Rice Research Institute (one of the more dangerous CGIAR monster institutes) has in its genebank more than 40,000 varieties from India, and considering that rice conservationist Debal Deb cultivates 920 varieties himself, the ADB (and its modelling troupe) talking about rice ‘yield’ means nothing without telling us which variety in which region. And that sort of negligence naturally leads me to ask what sort of thermometers they consulted while assembling these models.
– Rahul Goswami