Over eight weeks of recorded monsoon rain, the district-level data available with the India Meteorological Department (IMD) portrays a picture that is very different from its ‘national’ and ‘regional’ advice about the strength and consistency of rainfall.
In its first weekly briefing on the monsoon of August 2014, IMD said: “For the country as a whole, cumulative rainfall during this year’s monsoon (01 June to 30 July 2014) has so far upto 30 July been 23% below the Long Period Average.” Out of 36 meteorological sub-divisions, said the IMD, the rainfall has been normal over 15 and deficient over 21 sub-divisions.

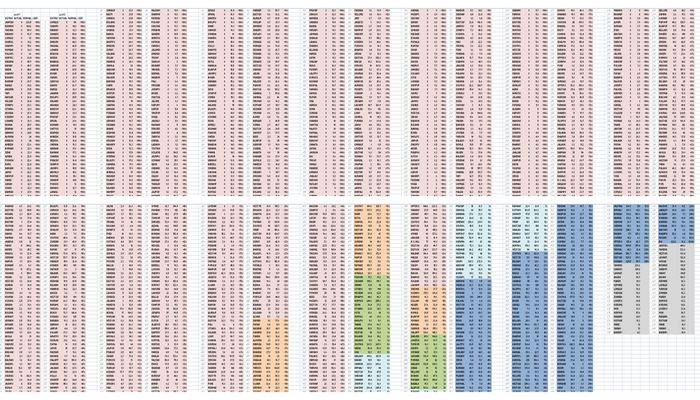
Readings for each district that has reported rainfall consistently for eight weeks. The columns represent the percentage value of actual rainfall for each district against their normal rainfall for eight weeks.
However, we have compiled a far more realistic reading of the monsoon season so far, from the IMD’s own data. For the 614 individual readings from districts that have regular rainfall readings, we have the following: 86 districts have registered scanty rainfall (-99% to -60%); 281 districts have registered deficient rainfall (-59% to -20%); 200 districts have registered normal rainfall (-19% to +19%); and 47 districts have registered excess rainfall (+20% and more).
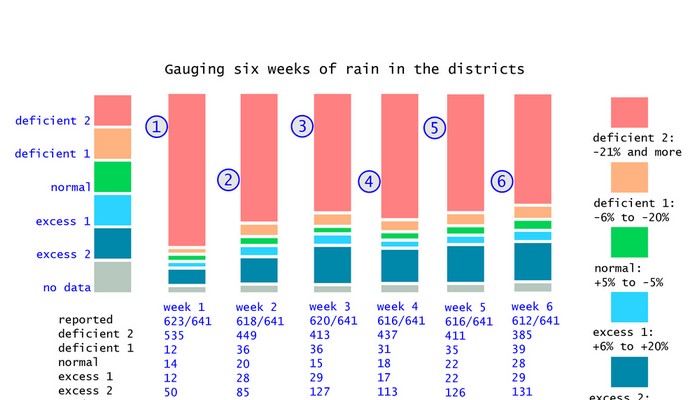
Moreover, using our running weekly district-level monsoon meter – the details of which and the reasoning for which you will find in here – we see that there was a substantial dip in the number of districts registering ‘deficient 2’ rainfall, which is less than 21% of the normal and lower, during the seventh week of rain, that is the week of 17 to 23 July. But the general trend returned the following week, 24 to 30 July.
What this means, and the bar chart we have provided to illustrate the 614 individual values leaves us in no doubt, is that 367 out of 614 districts have had meagre rain for eight weeks. This also means that over eight weeks where there should have been rainfall that – as the IMD predicted in early June – would be around 95% of the ‘long period average’, instead three out of five districts have had less than 80% of their usual quota.

Our running weekly district-level monsoon meter to aid governance decisions shows the overall trend has not changed substantially in the last fortnight despite good rains during the seventh monsoon week.
Unfortunately, the press and media – in particular the business and financial media – persist in reporting ‘national’ deficits and whether monsoon 2014 will ‘make up’ the average in the remaining period. This approach must be corrected by the IMD’s departmental divisions as it incorrectly makes popular the notion that total rainfall over a designated number of weeks is the most important monsoon metric (See ‘Why there is no ‘normal’ in our monsoon’). Of course it is not so, as different crops follow their own crop calendars according to the agro-ecological regions they are grown in, and require optimum rain at certain times during their respective crop calendars.
The following examples show why such reporting can be misleading:
From Reuters: “August rains hold the key to India’s major summer crops such as rice, soybean, cane and cotton, after a wet end to July failed to make up fully for a dry start to the four-month monsoon season. A late revival shrank the shortfall in rain to around 10 percent below average in July, the India Meteorological Department’s update showed on Thursday, a sharp improvement from the 43 percent deficit in the first month of the season.”
From Bloomberg: “Monsoon crops are sown from June and harvested from October. The country had less than 40 percent of average rains in the first six weeks of the monsoon season that runs through September. The shortage shrank to 23 percent by end-July. Oilseed planting in India is poised to slump as much as 24 percent to the lowest since 2002 after a weak start to the monsoon.”
From The Hindu: “With the country receiving good rain in July, monsoon deficiency has gone down to 23 percent, the MET department on Friday said. While the monsoon deficiency at the national level in June was 43 per cent, by July end it has come down to 23 per cent. Central India, which saw little rain in June, has by now seen some good rain. It received 402.2 mm of rainfall as compared to expected rainfall of 477.7 mm with a deficiency of 16 per cent, much lesser compared to other parts of the country.”
From Business Standard: “According to the India Meteorological Department (IMD), the rains managed to recoup much of the June losses due to strong revival over the central and western regions, and parts of northern India. Weather officials said the momentum of July would continue till about August 10 and then slacken a bit.”
From Mint: “India’s July rain deficit narrowed to 10% of the long-term average for the month, marking a recovery from the driest June in five years, the India Meteorological Department (IMD) said, as kharif crop sowing picked up in tandem. The shrinking of the rainfall deficit in July comes at a time when policymakers have been concerned about the impact of a below-average monsoon on foodgrain production and inflation. The June-September monsoon accounts for more than 70% of the annual rainfall in India and irrigates crops grown on half the country’s farmlands.”
 We urge the Ministry of Earth Sciences, the India Meteorology Department and the Ministry of Information and Broadcasting to cease the use of a ‘national’ rainfall average to describe the progress of monsoon 2014. This is a measure that has no meaning for cultivators in any of our agro-ecological zones, and has no meaning for any individual taluka or tehsil in the 36 meteorological sub-divisions. What we need to see urgently adopted is a realistic overview that numerically and graphically explains the situation, at as granular a level as possible.