By our conventional method of reckoning the adequacy of the 2015 monsoon, this is a year that is amongst the most deficient in rain over a period of 20 years. The monsoon season began late, compared with its usual onset, and apart from a few sustained heavy spells in a few locations, has been less than adequate and also less than normal in every one of our 36 meteorological sub-divisions.
When after eight weeks of the conventional monsoon season it became evident that a combination of factors was causing weak and erratic rainfall, that is when the central and state governments needed to place on alert the regions that were already facing rainfall deficits. At this point, when we have the evidence provided by data for 15 weeks of the monsoon season (until 9 September), every week from early August onwards that passed without such a declaration is a week of preparation and coping lost.
In this commentary, I have described the advantages of using a new methodology that grades rainfall adequacy at the level of the district, to a degree that is very much finer than the five categories of the India Meteorological Department (IMD), which are: normal, excess, deficient, scanty and no rain. The outputs from this methodology (illustrated and described here) are designed to: (1) alert national food and agriculture administrators to impending food insecurity conditions; (2) alert national water resources administrators to impending water scarcities; (3) alert line departments of state ministries and district collectorates to the build up of climatological distress at the district level so that contingency measures can be taken.
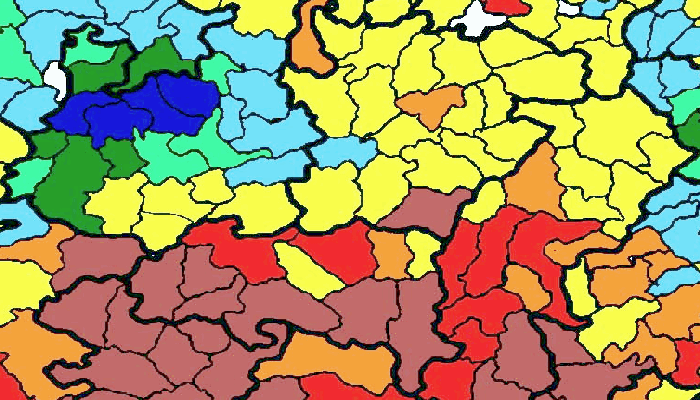
 Over the conventional season (1 June to 30 September) the inadequacy of rainfall in 2015 is revealed at a glance by the weekly rain report. It makes for a very alarming picture and shows that state administrations and especially district authorities should, by the sixth week which ended on 8 July, have made arrangements to prepare for below-normal rains. In the weekly rain report, each vertical bar corresponds to a week of districts categorised into eleven grades. This provides a weekly national barometer of the number of districts that are in the lower and upper (severely below and above normal rainfall) categories during a given week.
Such a weekly rainfall adequacy report is able to quickly put a stop to the recent tendency of administrations, the media and all those who must manage natural resources (particularly our farmers), to think in terms of an overall seasonal ‘deficit’ or an overall seasonal ‘surplus’. This ‘seasonal’ view must be abandoned because demands for water are not cumulative – they are made several times a day, and become more or less intense according to a cropping calendar, which in turn is influenced by the characteristics of a river basin and of a corresponding agro-ecological zone, and the rural and urban populations in a district.
The difference between the IMD five-grade assessment and the eleven-grade categorisation of rainfall becomes immediately apparent when a comparison is made for any given week. The data source is the same – the weekly tabulation compiled by the IMD’s Hydromet Division (which from this monsoon season provides the data sheets and detailed maps on its ‘customised rainfall information system’, or CRIS, website).
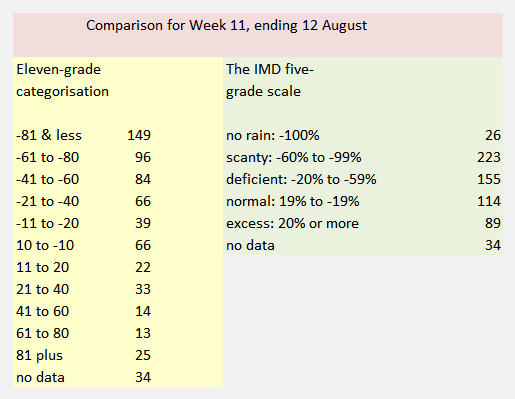 Week 11 of the monsoon season, which is the week until 12 August, provides such an example. Under the five-grade IMD scale, there were 114 districts with normal rain (from -19% to +19%). Under the 11-grade new categorisation, the middle grade is -10% to +10%, and included 66 districts. Under the five-grade IMD scale districts with below normal rainfall fall under deficient (-20% to -59%) or under scanty (-60% to -99%) and for this week the number of districts respectively were 155 and 223. Under the 11-grade new categorisation, there are four grades for below-normal rainfall that is -20%.
Thus while the ‘deficient’ grade includes 155 districts, under the 11-grade system there are 150 districts distributed between two grades – 84 and 66, but we see that a larger number of districts fall in the more severe of the two grades. The signal to be derived from this, at the state and districts administration level, is that if a district remains for two to three weeks at a grade, then contingency measures must be reviewed, readied or rolled out. This is a decision that becomes considerably easier with the 11-grade system when compared with the existing five-grade system.
In the same way, the week by week tabulation of districts under the 11-grade system reveals trends and patterns that are not visible under the existing IMD five-grade assessment. The table shows the distribution of districts by grade across weeks. In each week, the two grades that account for the largest number of districts are highlighted red. We see that for the the first five rain weeks – week ending 3 June to week ending 1 July – the +81% and above grade was one of the top two populated grades. This occurred once more for Week 7, ending 15 July. For the next eight rain weeks – ending 22 July to ending 9 September – the top two populated grades have been in the rainfall grades of -41% to -60%, -61% to -80% and -81% and less. At the country level, this starkly underlines the seriousness of the rainfall deficit.
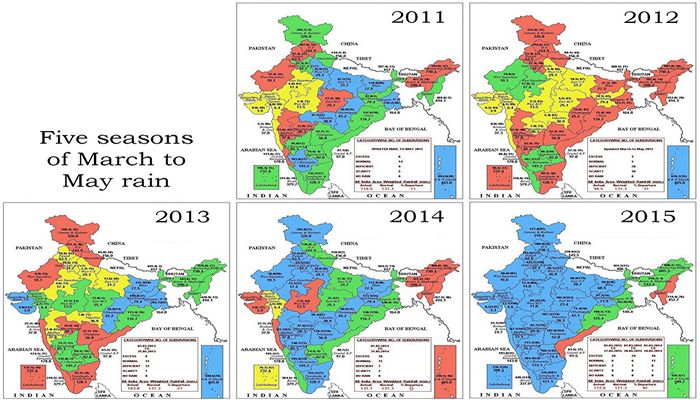
 The uses to which we have put available climatic observations no longer suit an India which is learning to identify the impacts of climate change. Until 2002, the monsoon season was June to September, there was an assessment in May of how well (or not) the monsoon could turn out.
The India Meteorology Department has added computational and analytical resources furiously over the last decade. The new research and observational depth is complemented by the efforts of a Ministry of Earth Sciences which has channelled the copious output from our weather satellites, under the Indian Space Research Organisation (ISRO), and which is interpreted by the National Remote Sensing Centre (NRSC), to serve meteorological needs.
The IMD, with 559 surface observatories, 100 Insat satellite-based data collection platforms, an ‘integrated agro-advisory service of India’ which has provided district-level forecasts since 2008, a High Performance Computing System commissioned in 2010 (whose servers run at Pune, Kolkata, Chennai, Mumbai, Guwahati, Nagpur, Ahmedabad, Bengaluru, Chandigarh, Bhubaneswar, Hyderabad and New Delhi) intelligently consumes an astonishing amount of numerical data every hour.
Over the last four years, more climate and weather ‘products’ (as the IMD system calls them) based on this data and their interpretations have been released via the internet into the public domain. These are reliable, timely (some observation series have even three-hour intervals), and valuable for citizen and administrator alike.
Even so, the IMD’s framing of how its most popular measures are categorised is no longer capable of describing what rain – or the absence of rain – affects our districts. These popular measures are distributed every day, weekly and monthly in the form of ‘departures from normal’ tables, charts and maps. The rain adequacy categories are meant to guide alerts and advisories.
These number four: ‘normal’ is rainfall up to +19% above a given period’s average and also down to -19% from that same average, ‘excess’ is +20% rain and more, ‘deficient’ is -20% to -59%, ‘scanty’ is -60% to -99%, and ‘no rain’ is -100%. These categories can mislead more than they inform, for the difference between an excess of +21% and an excess of +41% can be the difference between water enough to puddle rice fields and a river breaking its banks to ruin those fields.
In today’s concerns that have to do with the impacts of climate change, with the increasing variability of the monsoon season, and especially with the production of food crops, the IMD’s stock measurement ‘product’ is no longer viable. It ought to have been replaced at least a decade ago, for the IMD’s Hydromet Division maintains weekly data by meteorological sub-division and by district. This series of running records compares any given monsoon week’s rainfall, in a district, with the long period average (a 50-year period). Such fineness of detail must be matched by a measuring range-finder with appropriate interpretive indicators. That is why the ‘no rain’, ‘scanty’, ‘deficient’, ‘normal’ or ‘excess’ group of legacy measures must now be replaced. In its place an indicator of eleven grades translates the trends, patterns and messages in IMD’s district-level rainfall data into meaningful and actionable signals.
– Rahul Goswami
Notes
The new 11-grade indicator for assessing weekly rainfall departures in districts uses the same data IMD releases into the public domain, but provides dramatically more useful guidance. This yields the detailed reading required to alert state administrations to drought, drought-like and potential flood conditions. The modified methodology adapts the UN Food and Agriculture Organisation’s ‘Global Information and Early Warning System’ employment of 11 grades.
The weekly tallies of rainfall distribution for meteorological sub-divisions and for states are no longer able to signal administrative action and must be replaced with district-scale and (by 2016 monsoon) urban-scale assessments. The ability of the new 11-grade methodology to provide early warnings of climatic trauma in districts is now clear, and state administrations can respond to growing climatological distress in a targeted manner. Districts and blocks need to be supplied rainfall trends – and not only distribution data – that help farmers and administrators alike better plan for rainfall variability.


 Every one of Haryana’s 21 districts received excess rain for the period 1 March to 30 April 2015. As these rains have destroyed crops, including food staples, the need to compensate the affected farming families is now paramount. Relief and support are only useful when they are arrive quickly, and unlike administrative conditions two generations ago, state governments and district collectors today can consult data around the clock about conditions in districts and blocks.


 Our coverage of the ‘mausam’, the Indian summer monsoon of 2015, has begun. The unseasonal rains of March and April, which have proved so destructive to farmers, have shown why the conventional monsoon season must be widened. You will find all