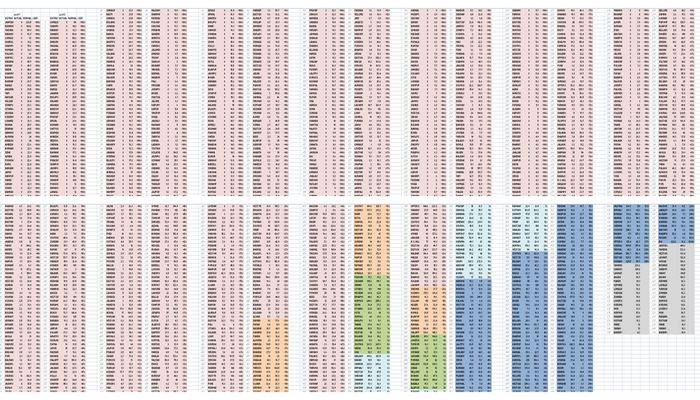
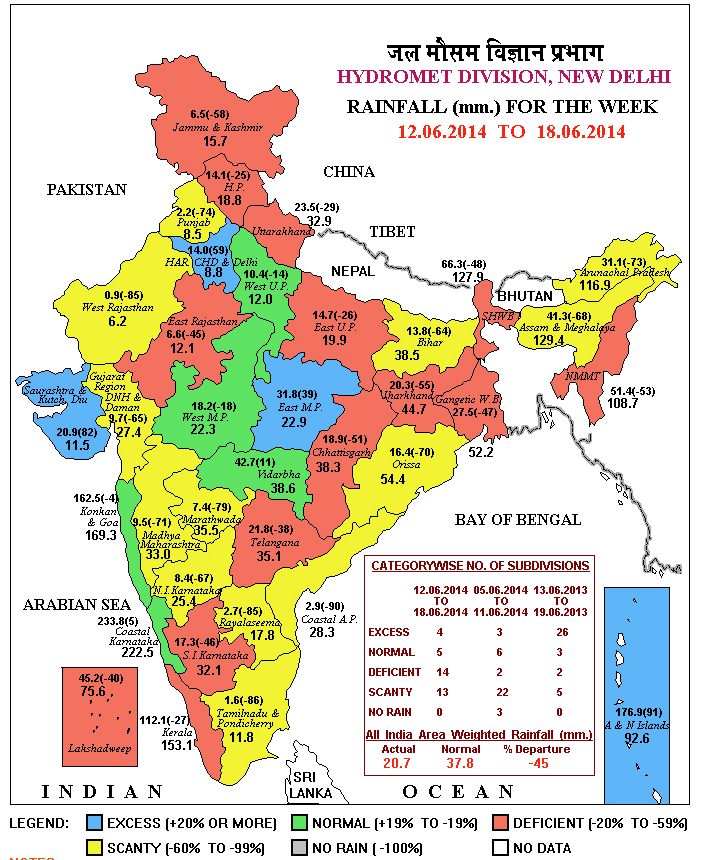
05 to 11 June is the first week. 12 to 18 June is the second week. 19 to 25 June is the third week. The bars represent the weeks and are divided by IMD’s rainfall categories, with the length of each category in a bar showing the proportion of that category’s number of districts. The colours used here match those used in IMD’s weekly rainfall map (below) which displays the category-wise rainfall in the 36 meteorological sub-divisions (but not by district).

The IMD weekly rainfall map for 19 to 25 June.
We now have rain data for three complete weeks from the India Meteorological Department (IMD) and for all the districts that have reported the progress of the monsoon.
The overall picture remains grim. In the third week of the monsoon the number of districts that reported normal rains in that week (-19% to +19% of the average) is only 74. No rain (-100%) was reported by 71 districts Scanty rain (-99% to -60%) was reported by 221 districts, deficient rain (-59% to -20%) was reported by 125 districts, excess rain (+20% and more) was reported by 129 districts, and there was no data from 21 districts.
 The Department of Agriculture and Cooperation, of the Ministry of Agriculture, has already issued its guidance to states on the contingency plans to be followed for a delayed monsoon. That is why it is important to make available the district-level normals and rainfall departures – the meteorological sub-divisions are too broad for such analysis and are irrelevant to any contingency plans and remedial work.
By end-June, when the IMD updates its outlook for the rest of monsoon 2014, we expect more detailed assessments of the districts to be publicly available – the agromet (agricultural meteorology section) already provides this to the states, with state agriculture departments given the responsibility of ensuring that the advice – which is especially important for farmers to plan the sowing of crop staples – reaches every panchayat.