The India Climate Observatory

Commentary, action and research on climate and development in India

  • Home
  • About
  • Monsoon 2018
  • Current
  • Bulletin
  • Contact
  • Announcements

The IPCC’s India voice?

November 4, 2014 by Climate portal editor Leave a Comment

RG_ICP_IPCC2_20141104

The three working groups of the Intergovernmental Panel on Climate Change (IPCC) Fifth Assessment Report have occupied, for months on end, 837 of what the IPCC method calls ‘authors’. Most are scientists, with considerable experience in the areas of atmospheric, cryospheric, oceanographic or bio-geochemical sciences, but they are also social scientists and economists, administrators and statisticians.

Insofar as the ‘inter-governmental’ aspect of the IPCC is concerned, they have been drawn from a number of countries, and have usually classified themselves by country of residence and work (though some are classified by institution too, especially when that institution is directly or indirectly a United Nations institute). All have contributed – as coordinating lead author, lead author, review editor, or for a technical summary – to the many voluminous chapters that have taken shape as the Fifth Assessment Report.

Amongst this corps is India’s contribution to the effort, with 33 authors. This is not a small group, for there are 43 from China and 31 from Japan (these groups exclude those of Indian or Asian origin who are authors but who have identified themselves under other countries and institutions). Compared with the contingents from western Europe, the USA and the OECD countries (as a bloc), Asia may be seen to be under-represented (and Africa very much more so) in the IPCC evidence examining and report writing process but that is a separate matter.

RG_ICP_IPCC2_20141104_2What is germane to us is: has the IPCC process and method an Indian outlook that will be of as much utility at home as it has been to the inter-governmental effort? A short answer will be ‘no’ to the first query (because it is about science, evidence and international consensus and not about national priorities) and ‘don’t know’ to the second. There is no reason why a ‘don’t know’ should persist, as the Fifth Assessment process comes to a close, for the size of India’s population and economy, and the likely effects climate change has and is forecast to have on our 35 states and union territories ought to have turned climate change into common currency wherever planning is carried out and implemented.

But that is not so, despite 33 Indian authors having contributed to the IPCC Fifth Assessment. They represent a far greater number who are, in one or more ways, concerned with the impacts of climate change in India and with our responses to those changes. What has seemed to have stood in the way of an Indian and a Bharatiya view of climate change is the predilection by academicians (particularly from those used to working in inter-governmental and UN circles) to propagate at home the language of international climate negotiation rather than direct statements and questions that have to do with conditions on the ground in Madhya Maharashtra or Assam or Jharkhand.

Consider one amongst the several quotes lent to our media following the release of the Fifth Assessment Synthesis Report: “The IPCC synthesis report suggests a way of thinking about climate change that is deeply relevant to India. There is a complex two way relationship between sustainable development and climate change: climate policies should support not undermine sustainable development; but limiting the effects of climate change is necessary to achieve sustainable development. The report clearly states there are limits to adaptation. For India the message is that while adaptation is critical, keeping the pressure on for global mitigation is also key.”

Unfortunately for any administrator (such as a district collector or a watershed mapper or the superintendent of a regional referral hospital) such a statement says very little. It neither draws out any interest in further understanding the effects of climate change in the districts and towns of Bharat, nor does it help provide a personal context to what is unquestionably a reporting process of vital importance to us all.

Part of the problem is the UN/inter-governmental language of negotiation that has become the norm when speaking about (or writing about, for several of these 33 contribute articles to the media regularly) climate change. As busy people, they may expect the media to interpret into popular idiom, simplify and amplify, and otherwise lend local colour to their prose. If so, they are plain wrong, for the responsibility to do so is theirs, not the media’s.

RG_ICP_IPCC2_20141104_3

Is there a demand for explanation that is true to context? There is practically none, and that is why this group (the 33 Indian contributors to the Fifth Assessment report) must be called upon to translate the IPCC method for local administrations. This is important as there are several worlds which do not intersect. That of the IPCC and the sophisticated cohort of institutions which have contributed to the Fifth Assessment report on the one hand, whereas everyday workaday life in Bharat’s 7,935 towns, cities and metropolises proceeds for many tens of millions with or without the magisterial pronouncements of the IPCC’s working groups. There will always be a gulf between these worlds, but there must also be bridges, and currently there are far too few.

Who can be called upon? Here is the current roll call. There are: Krishna Mirle Achutarao, Indian Institute of Technology; Pramod Aggarwal, CGIAR Research Program on Climate Change, Agriculture, and Food Security; Govindasamy Bala, Indian Institute of Science; Suruchi Bhadwal, The Energy and Resources Institute; Abha Chhabra, Indian Space Research Organisation; Pradeep Kumar Dadhich, Deloitte Touche Tohmatsu India Pvt. Ltd.; Purnamita Dasgupta, Institute of Economic Growth, University of Delhi Enclave; Navroz Dubash, Centre for Policy Research; Varun Dutt, Indian Institute of Technology; Amit Garg, Indian Institute of Management, Ahmedabad; Prashant Goswami, CSIR Centre for Mathematical Modelling and Computer Simulation; Anil Kumar Gupta, Wadia Institute of Himalayan Geology; Shreekant Gupta, University of Delhi; Sujata Gupta, Asian Development Bank (ADB); and Krishna Kumar Kanikicharla, Indian Institute of Tropical Meteorology.

Furthermore, there are: Arun Kansal, TERI University; Surender Kumar, University of Delhi; Ritu Mathur, The Energy & Resources Institute (TERI); Harini Nagendra, Ashoka Trust for Research in Ecology and the Environment (ATREE); Kirit S Parikh, Integrated Research and Action for Development (IRADe); Jyoti Parikh, Integrated Research and Action for Development (IRADe); Himanshu Pathak, Indian Agricultural Research Institute; Anand Patwardhan, Indian Institute of Technology-Bombay; Rengaswamy Ramesh, Physical Research Laboratory; Nijavalli H. Ravindranath, Indian Institute of Science; Aromar Revi, Indian Institute for Human Settlements; Joyashree Roy, Jadavpur University; Ambuj Sagar, Indian Institute of Technology Delhi; S. K. Satheesh, Indian Institute of Science; Priyadarshi R. Shukla, Indian Institute of Management, Ahmedabad; Eswaran Somanathan, Indian Statistical Institute, Delhi; Geetam Tiwari, Indian Institute of Technology; and Alakkat Unnikrishnan, National Institute of Oceanography. Who amongst these will stand up in the talukas and in the melee of our class II towns for Bharat?

– Rahul Goswami

Filed Under: Blogs Tagged With: AR5, Bharat, Climate Change, district, India, IPCC, policy, science, State, tehsil, town, UN, United Nations, urban

Climate measures that matter

October 8, 2014 by Climate portal editor Leave a Comment

RG_ICP_countries_emissions_201410

India has been saying during the last several international negotiations about climate change that our country, like other ‘developing’ countries, has a right to development. What this means is India has officially said our country will continue to burn coal and petroleum products in quantities that contribute to India emitting 1.954 million tons of CO2 a year (this figure is for 2012).

The ‘developed’ world (mostly countries in western Europe and North America) point to this large quantity and demand that India (and China, which emits very much more) do something to halt this rise and to decrease it. India’s response has been – recognise what you have done from the time of the Industrial Revolution and then we’ll resume talking.

This is unlikely to result in any constructive recognition of all that is linked. A country’s total emissions is one part of the ‘development’ picture and others are at least as important. There are also tons of CO2 emitted per capita (India has often said that its per capita emissions are far below those of the West). And there is per capita consumption of electricity (which is still mainly generated by burning coal).

That is why, when we look at the relationship between these three measures for a country, and between countries for any one of these three measures, we see connections that are otherwise missed due to a focus on a single measure. Our diagram, ‘Climate Measures that Matter’, helps explain these connections. It can be used as an aide to understanding better India’s position at climate negotiations, and provides much-needed context to the arguments about a country’s total emissions and its per capita emissions. [See the statement by Minster for Environment Prakash Javadekar, at the United Nations Climate Summit 2014.]

This diagram is an aide to understanding better India's position at climate negotiations. It provides much-needed context to the arguments about a country's total emissions and its per capita emissions.

This diagram is an aide to understanding better India’s position at climate negotiations. It provides much-needed context to the arguments about a country’s total emissions and its per capita emissions.

The country and energy data used in this diagram is for the latest year which is 2012. The source for the data is the International Energy Agency’s ‘Key World Energy Statistics 2014’ . This selection of countries compares countries of South Asia, East Asia, the larger economies of the OECD, the BRICS, other European countries, and countries of the Middle East. For each of the three measures, the size of the circles are relative to each other.

[The full size image is available here (png. 266kb). This diagram is distributed under a creative commons licence (2014) by the India Climate Portal. Reproduce only with full attribution.]

One could argue that the relationship between three measures for any country shows its responsibilities towards curbing the use of fossil fuels both nationally and individually, and towards capping electricity use. For example, per capita electricity use in a number of the countries shown in the diagram is seven or eight times more, and even ten times more and above, than India’s use.

Our South Asian neighbours – Bangladesh, Nepal, Pakistan and Sri Lanka – have by all three measures relatively small global impacts. The size of our population and the depth of our industry and economy however has made India the third largest emitter of CO2 (after China and the USA). But if India seeks some sort of ‘parity’ in electricity use – or if India sees the low per capita CO2 emissions as a ‘development’ gap – our total contribution to CO2 emissions will only rise faster, hurting the environment that we share with our neighbours.

The diagram helps display some of the most glaring and conspicuous differences between countries’ impacts on the atmosphere and ecosphere. These differences can be taken to mean fuel use and consumption must be halted and stringently curbed, whether or not the Kyoto Protocol and a successor treaty exist. That would be the way of acting responsibly for a country. [See the text of the Joint Statement issued at the 18th BASIC Ministerial Meeting on Climate Change in August 2014.]

These differences can also mean that the ‘developed’ countries recognise – as we and many ‘developing’ and ‘less developed’ countries have been reminding them repeatedly – that the way their economies and societies have functioned has caused much of the problem in the first place, and they must stop shunting the onus of responsibility onto us.

Finally, these differences should also show why being small is not being ‘poor’ and ‘less developed’. Households and families that use few kilowatts instead of many, burn few litres of fuel instead of many, are very much more responsible and environmentally balanced than others. It is the small circles in this diagram that ought to be the inspiration.

Creative Commons License
Climate Measures that Matter by India Climate Portal / Rahul Goswami is licensed under a Creative Commons Attribution-NonCommercial-NoDerivatives 4.0 International License.

Filed Under: Blogs, Reports & Comment Tagged With: atmosphere, Bangladesh, carbon, China, Climate Change, CO2, electricity, emissions, energy, environment, fossil fuels, India, Kyoto Protocol, Nepal, Pakistan, per capita, South Asia, Sri Lanka, UNFCCC

Warm streets, cold summits

September 25, 2014 by Climate portal editor Leave a Comment

A part of the people's march against climate change in New York, USA. Photo: Reuters / Eduardo Munoz

A part of the people’s march against climate change in New York, USA. Photo: Reuters / Eduardo Munoz

The United Nations Climate Summit 2014, held on 23 September, can be considered as a study in two contrasts. On the one hand was the People’s Climate March – an enormous gathering of concerned citizens in New York, USA, which may have seen a combined total of some 400,000 people. The marchers through their diversity and energy delivered one message in many creative ways. That message was: we citizens can and will rid the planet of fossil fuels and nuclear power, that such action will be demanding and difficult but we will do it at the grassroots and make a difference there.

On the other hand was the Climate Summit. This, said the UN, would serve as a public platform for leaders at the highest level, by which is meant all UN Member States, as well as finance, business, civil society and local leaders from public and private sectors. The gathering, said the UN, would “catalyse ambitious action on the ground to reduce emissions and strengthen climate resilience and mobilise political will for an ambitious global agreement by 2015 that limits the world to a less than 2-degree Celsius rise in global temperature”.

Did it succeed? No and yes. If there has been a gain from the events of 23 September it is to strengthen their individual and community resolve to act locally in an effort to tackle both the effects and the causes of climate change.

Where the Summit itself is concerned, against the background of 22 years of negotiations and conferences on climate change (the UN Framework Convention on Climate Change came about in 1992) it proved to be atypical. There were a number of promises and resolutions made to add to the mountain of such promises and resolutions but this summit – like every single other summit before it – brought no significant response from the political establishment.

Unsurprisingly, this is not how the UN sees the outcome of its recent work, for UN Secretary-General Ban Ki-moon summed up the Summit as “a great day, a historic day. Never before have so many leaders gathered to commit to action on climate change”. Ban said that the Summit he called “delivered” because the many leaders attending “reaffirmed determination to limit global temperature rise to less than 2 degrees Celsius by cutting emissions”.

Such announcements underline the contrast between the desire on the street and the cold comfort of summit announcements (now in their 22nd year). On 23 September the UN tip-toed around the large global and regional corporations (and their financier special interests) whose business practices have deepened environmental and socio-economic emergencies all over the world, and which are responsible for worsening – much less alleviating – the vulnerabilities of populations exposed to the risk of climate change.

The UN has regrettably turned into a recurring practice this avoiding of issues central to climate change (see the summary document, pdf, 243kb). But, at the same time, the UN together with a host of organisations that have more or less to do with climate change (private, academic, industry fora and so on) repeated once more a worn roster of promises.

These are:
* “Strong support” for the Green Climate Fund, with one more total being pledged (precious little has been actually transferred) and still more being “committed” (these are all commitments with renewable expiry dates).

* “A new coalition of governments, business, finance, multilateral development banks and civil society leaders” (what happened to all the other coalitions announced grandly at every other summit?) which once again was quick to commit to providing US$ 200 billion “for financing low-carbon and climate-resilient development”, including banks which want a ‘Green Bonds’ market.

* That carbon pricing continues to be “one of the most powerful tools available for reducing emissions and generating sustainable development and growth”, which in the end is a promise to continue the commodification and financialisation of emissions, an extremely troublesome industry whose regulation has proved difficult.

Instead of such expensive jamborees whose recycled announcements do little more than provide a false sense of security to citizens, the UN should emulate the example of the marchers and encourage small, local and meaningful action.

After the sound-and-light show of the Climate Summit 2014 we advocate just as strongly as before that it is local development – of, by, and for the people – which finds and leverages appropriate technology, encourages open source collaboration, and focuses on pragmatic, technical solutions to our problems, that will make the difference. Such action alone will reduce our impact on the environment and hedge households and communities against natural disasters made worse by a ritual of inaction.

Filed Under: Blogs Tagged With: 2014, carbon, Climate Change, climate summit, consumption, development, emissions, energy, fossil fuel, growth, New York, people's march, protest, resilient, sustainable, UN

India’s giant megawatt trap

September 10, 2014 by Climate portal editor 1 Comment

A panel of charts that show India's energy consumption, imports, and dependence on fossil fuel.

A panel of charts that show India’s energy consumption, imports, and dependence on fossil fuel.

Electricity as fundamental right and energy convenience as the basis of ‘development’ in Bharat and in India. If this is what Piyush Goyal means when he says his government is “is committed to ensure affordable 24×7 power” then it will come as yet another commitment that supports energy provision and consumption as the basis for determining the well-being of Bharat-vaasis and Indians (the UPA’s Bharat Nirman was the predecessor). But the Minister of State (Independent Charge) for Power, Coal and New and Renewable Energy cannot, using such a promise, ignore the very serious questions about the kind of ‘development’ being pursued by the NDA-BJP government and its environmental and social ramifications.

Goyal has said, via press conferences and meetings with the media, that the NDA government is committed to ensuring affordable power at all times (’24 x 7′ is the expression he used, which must be banished from use as being a violent idea – like nature our lives follow cycles of work and rest and ’24 x 7′ violently destroys that cycle). Goyal has promised, pending the taking of a series of steps his ministry has outlined, that such a round the clock provision of electric power will be extended to “all homes, industrial and commercial establishments” and that there will be “adequate power for farms within five years”.

The summary of India's power generation capacity, by type and by region. Source for data: Central Electricity Authority

The summary of India’s power generation capacity, by type and by region. Source for data: Central Electricity Authority

Some of the very serious questions we raise immediately pertain to what Goyal – with the help of senior ministry officials and advisers – has said. The NDA-BJP government will spend Rs 75,600 crore to (1) supply electricity through separate feeders for agricultural and rural domestic consumption, said Goyal, which will be used to provide round the clock power to rural households; and (2) on an “integrated power development initiative” which involves strengthening sub-transmission and distribution systems in urban areas. This is part of the “transformative change” the ministry has assured us is for the better. Goyal and his officials see as a sign of positive transformation that coal-based electricity generation from June to August 2014 grew by nearly 21 per cent (compared with the same months in 2013), that coal production is 9% higher in August 2014 compared with August 2013, and that Coal India (the largest coal producer company in the world which digs out 8 of every 10 tons of coal mined in India) is going to buy 250 more goods rakes (they will cost Rs 5,000 crore) so that more coal can be moved to our coal-burning power plants.

UN_Climate_Summit_2014_smWe must question the profligacy that the Goyal team is advancing in the name of round the clock, reliable and affordable electricity to all. To do so is akin to electoral promises that are populist in nature – and which appeal to the desire in rural and urban residents alike for better living conditions – and which are entirely blind to the environmental, health, financial and behavioural aspects attached to going ahead with such actions. In less than a fortnight, prime minister Narendra Modi (accompanied by a few others) will attend the United Nations Climate Summit 2014. Whether or not this summit, like many before it, forces governments to stop talking and instead act at home on tackling anthropogenic climate change is not the point. What is of concern to us is what India’s representatives will say about their commitment to reduce the cumulative impact of India’s ‘development’, with climate change being a part of that commitment.

At the UN Climate Summit 2014, it will be heard (in as many languages as there are translators available for them) that energy demand is growing along with expanding global wealth (but the UN will not say how unequally that extra wealth has been distributed). There will be grave references made to growing populations with a large number still without the round the clock electricity that Goyal has promised. Many speakers (eminent experts, as the UN system calls them) will be mobilised to remind the gathering that a shift toward renewable sources of energy (such as solar, wind and geothermal) is needed, that greater energy efficiency in appliances, buildings, lighting and vehicles are needed, and that this is so because it is essential to use the world’s resources sustainably, to diversify economies and successfully address the challenge of climate changes. It will sound suitably solemn and uplifting at the UN headquarters in New York, but the story at home in Bharat and India is solemn and deeply worrisome.

Where India's coal-burning power plants are. Map courtesy Global Energy Observatory.

Where India’s coal-burning power plants are. Map courtesy Global Energy Observatory.

Some of the tale is of very short-term inconvenience, such as when Mumbai went without electricity for a few hours on 02 September. The business and financial media reported that “back-up generators at banks and brokerages ensured that financial business was largely unaffected” and then circulated the familiar complain that India does not generate enough electricity to meet rapidly rising demand, that a severe shortage of coal (half our 150-odd coal burning plants are reported as having no more than a week’s supply of coal) has raised fears of more widespread blackouts.

Dire tweets from a leading industrialist, Anand Mahindra, were also reported: “Dark office in Mumbai. Lights out in the whole area. The coal crisis is beginning to literally show its dark side. A threat to the India story.” This senior member of the clutch of companies on the Bombay Stock Exchange ‘A’ List underlining a threat to the ‘India story’ led the business and financial media to quickly exert psychological duress on the NDA-BJP – “any grid collapse would cast doubt on the crisis management skills of the new government led by Prime Minister Narendra Modi”.

Electricity as fundamental right and energy convenience is moreover essential in the view of Indian industry to reaching the 8% per year GDP growth threshold, which this section appears to consider the single goal of the Republic of India. Hence where energy and the generation and provision of electricity is concerned, Goyal and his team have listed eight steps their ministry will undertake: (1) to rationalise coal supplies (by which is meant, as far as I can make out, move coal fewer kilometres to nearer power plants instead of distant ones); (2) create a statutory coal regulator; (3) civil nuclear cooperation agreement (Australia mentioned for uranium); (4) surveillance at major coal mines to control coal theft; (5) hydro-electric power generation in Jammu and Kashmir (“fast track” they say); (6) environmental clearances (“government will speed up environment and forest clearances to projects”); (7) bring more generation capacity at gas-based power online; (8) clear the solar ultra mega power plant at Sambhar near Jaipur, Rajasthan (the area is a site for migratory birds and an ecological refuge).

Had we an environment regulatory system and a project appraisal and clearances mechanism that protected environment, biodiversity, natural resources and our natural heritage, points 3, 5, 6 and 8 could under no circumstance have appeared on the Ministry of Power list. But the NDA-BJP government has in its first three months taken swift steps to eases clearances for industrial and infrastructure projects. Goyal’s colleague in the cabinet, Prakash Javadekar (minister of state for environment, forests and climate change), has worked to get the MoEF&CC to loosen the norms for expansion of coal mining projects producing up to 8 million tonnes of coal a year, and to adopt a ‘cluster approach’ in clearing smaller mines in the coal-rich belts of India. The environment ministry is also – as the Rajya Sabha was told – “streamlining environmental clearance process by delegating more powers to the State level Environment Impact Assessment Authorities (SEIAAs) for granting” such clearances, and neither house of Parliament has inquired critically as to whether the states so favoured have in place the evaluating expertise and capacities of sufficient authority and independence to not clear those projects which will harm environment, biodiversity, natural resources and our natural heritage.

Poor ambient air quality in our cities is hazardous to health, and emissions from coal-burning power plants are an important contributor to urban air pollution. This chart of a New Delhi region is courtesy Asia Air Pollution Real-time Air Quality Index (AQI).

Poor ambient air quality in our cities is hazardous to health, and emissions from coal-burning power plants are an important contributor to urban air pollution. This chart of a New Delhi region is courtesy Asia Air Pollution Real-time Air Quality Index (AQI).

While industry and a growing urban middle class expect ‘development’ and convenience, represented mainly by uninterruptible kilowatts, and exert a disproportionate amount of pressure on the state to fulfil these desires, there is a short list of steps very different from Goyal’s which must be recognised by the NDA-BJP government and state governments. This is:

(1) There is 172,986 MW of thermal power capacity (149,178 coal, 22,608 gas and 1,200 diesel), 40,798 MW of hydro-electric, 31,692 MW of renewables and 4,780 MW of nuclear, for a total of 250,257 MW. That’s on paper, whereas the actual power generation every average day (in 2014, according to the Central Electricity Authority, which is the apex power sector planning body) has been around 135,000 MW. From every power plant to every grid and to every distribution network, the aggregate transmission and commercial losses are estimated to be 26%. Judging from the trend of 2000 onwards, India’s coal consumption would have been 710 million tons in 2013 – almost twice the consumption in 2000 (359 mt) and more than three times the consumption in 1990 (224 mt).

To have allowed 26% of the generated electricity in 2013 to be ‘lost’ amounts to wasting the coal that was burned to generate it, and this is a gigantic sum, an amount equal to the 189 mt that India consumed in 1986. Secretary Pradeep Kumar Sinha, Additional Secretaries R N Choubey and Devendra Chaudhry, Joint Secretaries Mukesh Jain, B N Sharma, Pradeep Kumar, Satish Kumar and Jyoti Arora, and Economic Adviser Raj Pal must practice thrift and saving instead of entertaining industry’s demands for more power plants.

(2) India has for the last year consumed crude oil at the rate of about 3.5 million barrels a day and of this astounding amount 2.5 million barrels are imported. For 2013-14 (until 31 March) India’s appetite for crude oil cost US$ 143 billion (which represented 32% of India’s total imports for the financial year, according to the Ministry of Commerce). The standard oil barrel contains 159 litres of crude oil and, according to the Society of Petroleum Engineers, a barrel of crude oil represents about 1,700 kWh of electricity. Judging from the power consumption trend from 2000, our per capita average annual electricity consumption in 2014 will be 750-760 kWh, which is about 62 or 63 units a month.

A simple schematic for a 1,000 MW coal-burning power plant that shows the inputs and pollutants. Diagram courtesy Indian Power Sector.Com

A simple schematic for a 1,000 MW coal-burning power plant that shows the inputs and pollutants. Diagram courtesy Indian Power Sector.Com

Thus a single barrel of imported (or domestically produced) crude oil contains energy enough to supply two persons for a year, at current annual averages. Such a comparison between fuels is useful to illustrate what the country’s automobile addiction costs in terms of what it takes to furnish households with electricity. About 47% of the oil is used (after refining and being turned into various petroleum products) for transport, supporting an automobile industry that has placed 17.56 million cars, 2.01 million taxis, 3.9 million jeeps, 4.24 million light motor vehicles, 1.29 million buses, 7.37 million goods carriers, 9.42 million other vehicles (tractors, three-wheelers and so on), and 115.41 million two-wheelers, on our roads to congest our towns and cities into paralysis.

The oil import bill is Rs 872,300 crore, a number that defies the citizen’s attempts to size it (it is more than ten times the wages paid through MGNREGA (about Rs 78,106 crore) for the last three years for which 235.5 million people were provided wage employment). Goyal and his officials are therefore better advised to pay attention (together with cabinet colleague Nitin Gadkari, the minister of road transport and highways) to the 119,209 state transport buses in Bharat and India in which we travelled (economically and fairly reliably, round the clock too) some 552 million passenger kilometres.

(3) This NDA-BJP government in its first three months has blundered just as much as its predecessor government did on matters that concern every citizen: the environment, energy, the provisioning of agriculture and food, and human development. At every turn Goyal’s cabinet colleagues, and in particular Arun Jaitley, minister of finance and defence, have chanted out the tiresome refrain that India will grow, must grow, must build, must consume, must produce and so on. Their obduracy in the face of evidence to the opposite – evidence that has been available in Bharat and internationally from the time they were students, certainly – is just as tiresome. Gathering ever more citizens into the club of the urban middle class will only lead to a financial and technological trap from which there is no escape.

Coal India's share price for the last two years.

Coal India’s share price for the last two years.

One example amongst many illustrates why, quite starkly. Since 2004, the sale of room air-conditioners has grown at about 15% per year, and the industry reported sales of over 3.5 million air-conditioners in 2013. Concerned by the demand for electricity from homes and offices fitted, over the last three years, with new air-conditioners, the Bureau of Energy Efficiency (a statutory body under the Ministry of Power) set out to estimate what effect millions of new air-conditioners would have on peak electricity demand. The answer was provided by an ‘expert group on low carbon strategies for inclusive growth’ for the Planning Commission and independent analysis conducted by the Lawrence Berkeley National Laboratory (of the USA). This study found that peak electricity demand would rise by 75,000 MW to reach 150,000 MW by 2030. That is, in 15 years the peak electricity demand alone will be 60% of today’s total power generation capacity in India!

There is no financial fix and there is no technological fix for such a trend. There is no further excuse for the NDA-BJP government and for ministers like Goyal, Jaitley, Javadekar, Gadkari (and prime minister Modi) to continue to ignore the obvious. Goyal and Jaitley both need an immediate refresher in revisiting the reasons why the marginal cost curve of any action they have announced in the last three months will rise steeply. That rise will be due to a combination of activities, and the natural consequences, which will ruinously amplify the impacts of a changing climate. Bharat cannot continue to shirk the duty – of government and of citizen – of caring first for our ‘prakruti’ (what the west has recently begun to call ecological services) and instead pursuing the ‘maya’ of continuous growth.

– Rahul Goswami

Filed Under: Blogs, Reports & Comment Tagged With: Arun Jaitley, automobiles, BJP, carbon, Climate Change, climate summit, coal, consumption, ecological services, electricity, emissions, energy, energy efficiency, environment, fossil fuel, Goyal, India, Narendra Modi, Nitin Gadkari, oil, oil import, per capita units, power, Prakash Javadekar, prakruriti, UN, urja

How ADB cooks the climate pot

August 21, 2014 by Climate portal editor 1 Comment

RG_ICP_pic_20140821

The Asian Development Bank has, amongst the world’s multilateral development banks, been a bit of a latecomer to the area of climate financing with the help of modelling. Its senior peers – the World Bank and the European Bank for Reconstruction and Development – have been at it for a while, with the World Bank being rather in its own league if one was to judge by the tonnage of reports it has printed. The ADB probably holds its own on the matter against the Inter-American Development Bank and the African Development Bank, but this latest effort, I think, pushes it ahead of the last two.

Not for any reason that would gladden a farmer or a municipal worker, for that is not the audience intended for ‘Assessing the costs of climate change and adaptation in South Asia’ (Asian Development Bank, 2014), which was released to the Asian world a few days ago. But the volume should immensely help the modelling crews from a dozen and more international agencies that specialise in this arcane craft. Providing the scientific basis around which a multilateral lending bank can plan its climate financing strategies will help the craft find a future. Rather less sunny is the outlook for states and districts, cities and panchayats, who may find an over-zealous administrator or two quoting blithely from such a report while in search of elusive ‘mitigation’.

The reassuring shapes of indecipherable models

The reassuring shapes of indecipherable models

In my view, this volume is useless. It is so because it is based on a variety of modelling computations which have their origin in the methods used for the IPCC’s Fourth Assessment Report (that was released in 2007). The permanent problem with all such ‘earth science’ modelling approaches is that it uses global data sets which must be ‘downscaled’ to local regions. No matter how sophisticated they are claimed to be by their inventors and sponsors, such models can only work with regular and large sets of well-scrubbed data that have been collected the same way over a long period of time and recorded reliably. This may serve a ‘global’ model (which is irrelevant to us in the districts) but in almost every single case of ‘downscaling’, a scaling down may make a smattering of sense if there is some comparable data relating to the region for which the scaling is taking place. And this correlation, I can assure you, is not possible 99 times out of 100.

But that doesn’t bother the ADB, because it is a bank, it must find a way for Asian countries to agree to taking loans that help them mitigate the effects of rampaging climate change, as this report tries to convince us about. Which is why the ADB has said its unimpeachable analysis is based on “a three-step modeling approach” and this is “(i) regional climate modeling (ii) physical impact assessment, and (iii) economic assessment”, the last aspect being what they’re betting the thermometer on.

The numbers that have emerged from the ADB’s computable general equilibrium model must be satisfyingly enormous to the bank’s thematic project directors and country directors. For the scenario modellers have provided the ammunition for the bank to say: “The region requires funding with the magnitude of 1.3% of GDP on average per annum between 2010 and 2050 under the business-as-usual-1 scenario. The cost could rise to up to 2.3% (upper range) of GDP per annum taking into account climate uncertainties. To avoid climate change impact under the business-as-usual-2 scenario, adaptation cost of around $73 billion per annum on the average is required between now and 2050.”

I could not, in this needlessly dense and poorly written volume, find a mention of which rice strains have been measured for their yields in the example given for India, when the ADB report makes some dire forecasts about how yields will be lowered or will plunge under several forecast conditions. Perhaps they were buried in some footnote I have overlooked, but considering that the International Rice Research Institute (one of the more dangerous CGIAR monster institutes) has in its genebank more than 40,000 varieties from India, and considering that rice conservationist Debal Deb cultivates 920 varieties himself, the ADB (and its modelling troupe) talking about rice ‘yield’ means nothing without telling us which variety in which region. And that sort of negligence naturally leads me to ask what sort of thermometers they consulted while assembling these models.

– Rahul Goswami

Filed Under: Blogs, Latest Tagged With: ADB, agriculture, Asian Development Bank, climate, climate finance, GDP, India, modelling, scenario

The IMD’s shaky monsoon math

August 7, 2014 by Climate portal editor Leave a Comment

RG_ICP_pic_20140806

Over eight weeks of recorded monsoon rain, the district-level data available with the India Meteorological Department (IMD) portrays a picture that is very different from its ‘national’ and ‘regional’ advice about the strength and consistency of rainfall.

In its first weekly briefing on the monsoon of August 2014, IMD said: “For the country as a whole, cumulative rainfall during this year’s monsoon (01 June to 30 July 2014) has so far upto 30 July been 23% below the Long Period Average.” Out of 36 meteorological sub-divisions, said the IMD, the rainfall has been normal over 15 and deficient over 21 sub-divisions.

Readings for each district that has reported rainfall consistently for eight weeks. The columns represent the percentage value of actual rainfall for each district against their normal rainfall for eight weeks.

Readings for each district that has reported rainfall consistently for eight weeks. The columns represent the percentage value of actual rainfall for each district against their normal rainfall for eight weeks.

However, we have compiled a far more realistic reading of the monsoon season so far, from the IMD’s own data. For the 614 individual readings from districts that have regular rainfall readings, we have the following: 86 districts have registered scanty rainfall (-99% to -60%); 281 districts have registered deficient rainfall (-59% to -20%); 200 districts have registered normal rainfall (-19% to +19%); and 47 districts have registered excess rainfall (+20% and more).

Moreover, using our running weekly district-level monsoon meter – the details of which and the reasoning for which you will find in here – we see that there was a substantial dip in the number of districts registering ‘deficient 2’ rainfall, which is less than 21% of the normal and lower, during the seventh week of rain, that is the week of 17 to 23 July. But the general trend returned the following week, 24 to 30 July.

What this means, and the bar chart we have provided to illustrate the 614 individual values leaves us in no doubt, is that 367 out of 614 districts have had meagre rain for eight weeks. This also means that over eight weeks where there should have been rainfall that – as the IMD predicted in early June – would be around 95% of the ‘long period average’, instead three out of five districts have had less than 80% of their usual quota.

Our running weekly district-level monsoon meter to aid governance decisions shows the overall trend has not changed substantially in the last fortnight despite good rains during the seventh monsoon week.

Our running weekly district-level monsoon meter to aid governance decisions shows the overall trend has not changed substantially in the last fortnight despite good rains during the seventh monsoon week.

Unfortunately, the press and media – in particular the business and financial media – persist in reporting ‘national’ deficits and whether monsoon 2014 will ‘make up’ the average in the remaining period. This approach must be corrected by the IMD’s departmental divisions as it incorrectly makes popular the notion that total rainfall over a designated number of weeks is the most important monsoon metric (See ‘Why there is no ‘normal’ in our monsoon’). Of course it is not so, as different crops follow their own crop calendars according to the agro-ecological regions they are grown in, and require optimum rain at certain times during their respective crop calendars.

The following examples show why such reporting can be misleading:

From Reuters: “August rains hold the key to India’s major summer crops such as rice, soybean, cane and cotton, after a wet end to July failed to make up fully for a dry start to the four-month monsoon season. A late revival shrank the shortfall in rain to around 10 percent below average in July, the India Meteorological Department’s update showed on Thursday, a sharp improvement from the 43 percent deficit in the first month of the season.”

From Bloomberg: “Monsoon crops are sown from June and harvested from October. The country had less than 40 percent of average rains in the first six weeks of the monsoon season that runs through September. The shortage shrank to 23 percent by end-July. Oilseed planting in India is poised to slump as much as 24 percent to the lowest since 2002 after a weak start to the monsoon.”

From The Hindu: “With the country receiving good rain in July, monsoon deficiency has gone down to 23 percent, the MET department on Friday said. While the monsoon deficiency at the national level in June was 43 per cent, by July end it has come down to 23 per cent. Central India, which saw little rain in June, has by now seen some good rain. It received 402.2 mm of rainfall as compared to expected rainfall of 477.7 mm with a deficiency of 16 per cent, much lesser compared to other parts of the country.”

From Business Standard: “According to the India Meteorological Department (IMD), the rains managed to recoup much of the June losses due to strong revival over the central and western regions, and parts of northern India. Weather officials said the momentum of July would continue till about August 10 and then slacken a bit.”

From Mint: “India’s July rain deficit narrowed to 10% of the long-term average for the month, marking a recovery from the driest June in five years, the India Meteorological Department (IMD) said, as kharif crop sowing picked up in tandem. The shrinking of the rainfall deficit in July comes at a time when policymakers have been concerned about the impact of a below-average monsoon on foodgrain production and inflation. The June-September monsoon accounts for more than 70% of the annual rainfall in India and irrigates crops grown on half the country’s farmlands.”

Filed Under: Blogs, Current, Monsoon 2014 Tagged With: 2014, agriculture, climate, crop, district, food, foodgrain, IMD, India, inflation, irrigation, kharif, meteorology, monsoon, rainfall, water

Decoding reservoirs for the rest of us

July 21, 2014 by Climate portal editor Leave a Comment

RG_ICP_reservoirs_201407_image
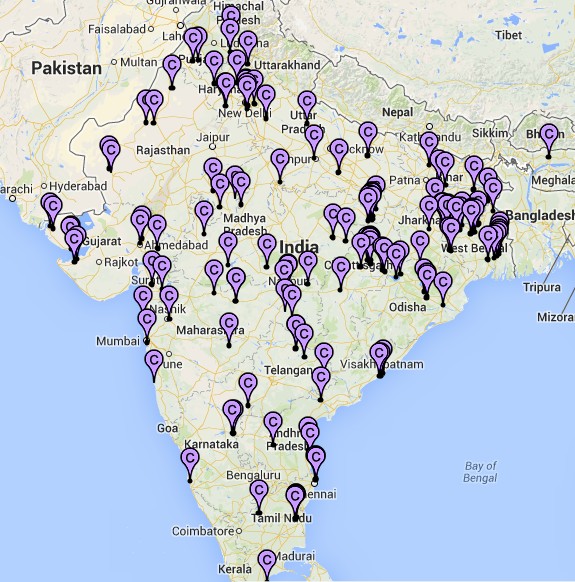
Every week, the Central Water Commission releases to the public and to government departments the numbers that describe how much water is stored in 85 reservoirs in India. These are the reservoirs designated as nationally important, because of their roles in providing water for large irrigated command areas and for generating hydro-electric power (37 of these dams).

These readings are taken as the authoritative compilation of the current weekly state of water storage, and are widely used in government. Amongst the uses is to recommend the rationing of water consumption in the states and urban settlements. Another use is to help determine what advice to broadcast to our farmers about when they can sow seeds (if their fields are irrigated by the canals that radiate outwards from these dams).

RG_ICP_reservoirs_panel_201407But of course these are only 85, even if they are the biggest. Whether Bargi in Madhya Pradesh is half full does not interest in the least a farmer in Purnea, Bihar. Whether Tungabhadra in Karnataka is filling up well in the last two weeks is of no consequence to the residents of Rohtak in Haryana. That Yeldari in Maharashtra has water at a level very much lower it should be at this time of the year does not affect the cultivators of Virudhanagar, Tamil Nadu.

Bihar has 24 large dams (and groundwater) and Tamil Nadu has 116 while Madhya Pradesh has 898 large dams other than Bargi, but we have no weekly or monthly information about how much water these hold, in the first week of June or at end July. And this is what we don’t know for all the 4,839 dams – in the national register of large dams – that are not amongst the list of 85. The Central Water Commission tells us that it uses the combined readings for the 85 large dams because, with their total of about 155 billion cubic metres (bcm) of water storage (if they are all full), they form a large portion of the approximately 254 (bcm) of total reservoir storage available in India (excluding tanks, ponds and traditional water storage structures). But, for the smallholder cultivator and the town council of a Class 2 urban settlement, it is the 50 million cubic metres reservoir in the next taluka that they depend on for water, not on any of the big 85.

What can we then do with the weekly reservoir storage bulletin from the CWC? My approach is to treat it as an indicator of the collection of rainfall by reservoirs in the same meteorological region and agro-ecological zone. When the list is divided into ten groups, by reservoir size, we see far more clearly the effect of the last two weeks of rainfall on the storage levels. Until we can persuade state and central governments to invest in widespread and cheap monitoring of as many of our water storage receptacles as possible, we may use the CWC bulletin as an indicator.

By Rahul Goswami

The panel of charts shows water storage ranges (at full capacity of the dams) for the groups of reservoirs. Starting with the smallest first: 56 million cubic metres (mcm) to 176 mcm (tenth group); 184 mcm to 380 mcm (ninth group); 399 mcm to 523 mcm (eighth group); 524 mcm to 735 mcm (seventh group); 767 mcm to 927 mcm (sixth group); 935 mcm to 1.436 billion cubic metres (bcm) (fifth group); 1.456 bcm to 1.994 bcm (fourth group); 2.171 bcm to 2.676 bcm (third group); 3.046 bcm to 5.378 bcm (second group); 5.649 bcm to 9.745 bcm (first group).

Filed Under: Blogs, Monsoon 2014 Tagged With: 2014, Central Water Commission, command area, dam, hydel, hydro-electric, irrigation, monsoon, reservoir, storage, water scarcity

Why there is no ‘normal’ in our monsoon

July 4, 2014 by Climate portal editor Leave a Comment

RG_ICP_monsoon_20140704

The idea of a ‘revival’ of a delayed and weakened monsoon is a misleading one and the country’s earth science agencies must advise against the term being used. In particular, our news media must cease using this term as it implies, incorrectly, that rainfall can be ‘made up’ even though current ‘averages’ are low.

This group of maps of the 2014 monsoon is in three parts. Each part is composed of four separate but linked maps, two each in two rows. This is how you read each of the three sets: the top left map in a group of four shows the anomaly (in millimetres) of rainfall for the days measured. In this map, ochre yellow and dark growns are regions with the least rain compared to what they should have received, while those shaded in blues have received more than they normally do. The second map, top right, shows the percent of normal rain - light and dark browns being percentages very much lower than normal and greens and blues above. The lower left map in each group shows the accumulated rainfall for the measured days in millimetres, with green then blue and then orange showing the increasing levels of accumulated rain. In contrast, the lower right map shows the normal cumulative rainfalls for the same period. As with the group of four maps for the seven day period, the groups for the ten and 30 day rainfall measurement cycles follow the same pattern. In this panel, the seven day period is 26 June to 02 July 2014, the ten day period is 23 June to 02 July 2014 and the 30 day period is 03 June to 02 July 2014. The maps are by the Climate Prediction Center, NOAA Center for Weather and Climate Prediction, USA.

This group of maps of the 2014 monsoon is in three parts. Each part is composed of four separate but linked maps, two each in two rows.
This is how you read each of the three sets: the top left map in a group of four shows the anomaly (in millimetres) of rainfall for the days measured. In this map, ochre yellow and dark browns are regions with the least rain compared to what they should have received, while those shaded in blues have received more than they normally do. The second map, top right, shows the percent of normal rain – light and dark browns being percentages very much lower than normal and greens and blues above.
The lower left map in each group shows the accumulated rainfall for the measured days in millimetres, with green then blue and then orange showing the increasing levels of accumulated rain. In contrast, the lower right map shows the normal cumulative rainfalls for the same period.
As with the group of four maps for the seven day period, the groups for the ten and 30 day rainfall measurement cycles follow the same pattern. In this panel, the seven day period is 26 June to 02 July 2014, the ten day period is 23 June to 02 July 2014 and the 30 day period is 03 June to 02 July 2014.
The maps are by the Climate Prediction Center, NOAA Center for Weather and Climate Prediction, USA.

This is simply not so. A normal monsoon is certainly not one that can statistically be called ‘normal’ on the basis of cumulative rainfall for a region – such as any one of our 36 meteorological sub-divisions – adding up to what is expected over four weeks after a few heavy showers in the last few days have helped tilt the reading from ‘below normal’ to ‘normal’. The three panels of maps alongside convincingly explain why.

Yet senior meteorological department officials, including those at the National Weather Forecasting Centre at the India Meteorological Department, issue statements such as “the monsoon has revived in many parts of central and north India”. This may be meant to assuage the concerns especially of farming and cultivating households, but in fact they only distract from the recognition a continuing climatological crisis urgently needs.

The evidence till now is extremely worrisome. June’s rainfall was 43% below average (a ‘national’ statistic that has no meaning in a district, but which helps in a small way to describe the degree of dryness) and this makes June 2014 the worst first month for recorded rainfall since 2009, a year in which the monsoon was the worst after the dreadful dry of 1972.

Especially given the growing evidence of the effects of climate change in India – from rising sea levels, to increasing meltwater from Himalayan glaciers causing torrents in hilly and mountainous districts, to rising mean temperatures in peninsular and north India – there is reason enough to set aside the usual measures such as the date of what is called ‘the onset of the rains over Kerala’ which is pegged to 01 June, and then a progress of the rain up the peninsula based on patterns of 40, 50 and more years ago. These time-tables no longer stand. [A full resolution set of the maps used here is available as a zip archive (2.68 MB).]

What continues to stand in the food staples calendar is the sowing that takes place in July and August but although there is more cooperation between the official earth sciences agencies and the Ministry of Agriculture, the central government has continues to link, in recent statements, the rising prices of food staples to the probability that these will continue should the monsoon be inadequate – which is what all the indicators are pointing to at this time.

This insistence is a contradiction, for a late and weak monsoon (or even an uneven and heavy monsoon that is statistically ‘normal’) will not help the usual sowing time-table and that is why agricultural contingency plans for every district are readied at the first indication of a wayward monsoon. The role of the central and state governments at times like these is not to blame poor rains for volatile and rising food prices but to help determine crop time-tables that match the circumstances.

By Rahul Goswami

Filed Under: Blogs, Monsoon 2014 Tagged With: 2014, agriculture, average, crop staple, drought, hydrology, IMD, India, inflation, monsoon, rainfall, water resources

ENSO, ISMR, EQUINOO and rain

June 5, 2014 by Climate portal editor Leave a Comment

RG_ICP_20140605An editorial in the journal Current Science (25 May 2014) has helpfully linked three phenomena that will affect the monsoon of 2014. The first is the El Niño (and the El Niño Southern Oscillation or ENSO) over the Pacific Ocean, considered unfavourable for us and the monsoon. The editorial has pointed out that El Niño has featured in the news already, with likely impacts being considered such as “a decrease of about 1.75% of GDP”. The question the editorial asks is: how reliable is the forecast of an impending El Niño? When it does occur, will it bring a deficit monsoon or a drought inevitably?

The second phenomenon is the Indian summer monsoon rainfall (abbreviated to ISMR by those who study climate for the sub-continent). The Current Science editorial makes an important point which is, studying the relationship between the sufficiency of the monsoon, the GDP and food-grain production during 1950–2004 reveals that the magnitude of the adverse impact of deficit rainfall is much larger than the magnitude of the positive impact of above average rainfall. This means that India being able to predict the possibility of drought (and therefore factors that influence it such as the ENSO) is more important than being able to predict a good monsoon.

The editorial has said that the ISMR “is significantly correlated with this ENSO index, with the relationship explaining 29% of the variance of monsoon rainfall”. Thus the warm phase of ENSO, which is characterised by more rainfall over the equatorial central Pacific, is associated with a decrease in rainfall over India. Now that we know this, what are the implications for monsoon 2014? By April, the warm phase of ENSO has already commenced with enhanced convection/rainfall over the central Pacific and all the models predict that it will amplify and persist until the end of the summer monsoon (the models vary in how they look at linked phenomena and the specific conclusions but agree broadly that El Niño conditions are here.

While the editorial has said that by “mid-June we should get a better idea of whether an El Niño is imminent”, the already unfavourable ENSO conditions mean that the probability of drought has gone up to just over 30%. If an El Niño does fully develop by end-June, the chance of a drought increases to 70%.

The explanation becomes more complete with the assessment of the third phenomenon. This is the Equatorial Indian Ocean Oscillation (EQUINOO). In 2003, it was discovered that in addition to ENSO, EQUINOO plays an important role in the variations, from one year to the next, of the ISMR. There is what is called “a see-saw between a state with enhanced rainfall over western equatorial Indian Ocean and suppressed rainfall over eastern equatorial Indian Ocean” (and its opposite). How this becomes manifest from one year to the next is considered by climatologists to account for about 19% of the variance of the monsoon rainfall.

The equation that we will have to finish writing and balance in the next few weeks is this. During the Indian summer monsoon season, ENSO and EQUINOO are poorly correlated – an ENSO unfavourable to us can be counter-balanced to some degree by a favourable EQUINDO. When both are unfavourable to us, drought has occurred. But the records also show that twice recently, in 1963 and in 1997, a favourable EQUINDO has protected us from the harmful impact of an El Niño. We need, in short, to be watching closely multiple large climatic phenomena every day until at least end-June. Is the IMD up to the job?

Filed Under: Blogs, Latest, Monsoon 2014 Tagged With: 2014, drought, El Nino, ENSO, IMD, Indian Ocean, ISMR, monsoon, Pacific

At Durban Platform, India on historical responsibility

March 22, 2014 by Climate portal editor Leave a Comment

The point, said India, is not about finance or capabilities alone, but how we tackle the burdens of history. Photo: India Climate Portal / RG

The point, said India, is not about finance or capabilities alone, but how we tackle the burdens of history. Photo: India Climate Portal / RG

A very interesting exchange took place among Parties on how to operationalise equity in the 2015 agreement
under the Ad Hoc Working Group on the Durban Platform for Enhanced Action, as reported by the Third World Network news service (‘Operationalising equity in the new agreement’).

India emphasised the importance of the historical responsibility of developed countries in terms of their cumulative emissions (of greenhouse gases) that provide the basic rationale for developed countries to take the lead on mitigation actions and to ensure equity. This was also echoed by China and Kuwait.

India further stressed that equity rejects any notion that ambition levels in the post-2015 period should be decided solely on whether a country has financial resources or not, or on the basis of “respective capabilities”. Many developing countries also emphasised the need for the provision of finance and technology transfer in order to allow them to choose low-carbon development pathways.

China, India and the Alliance of Small Island States (AOSIS) highlighted the importance of pre-2020 action as a foundation for a future agreement that was ambitious and equitable.

India said that although Parties may have different views on equity, the Convention is clear and the outcome in 2015 will be under the Convention. It said that the historical responsibility of developed countries in terms of their cumulative emissions provides the basic rationale for developed countries to take the lead on mitigation actions and ensure equity.

Given the wide gulf in the per capita income and expenditure between developed and developing countries, it is only desirable that the 2015 arrangements must ensure that Annex 1 and Annex II Parties take the lead and shoulder the major burden on climate change.

Filed Under: Blogs Tagged With: Durban Platform, India, IPCC

  • « Previous Page
  • 1
  • 2

Indiaclimate twitter

Tweets by @Indiaclimate

Notable

Between contemplation and climate

Whether or not the USA, Europe, the Western world, the industrialised Eastern world (China, Japan, South Korea, Taiwan), adhere to or not their paltry promises about being more responsible concerning the factors that lead to climate change, is of very little concern to us. We have never set any store by international agreements on climate […]

The ‘Hindu’, ignorant about weather and climate, but runs down IMD

We find objectionable the report by ‘The Hindu’ daily newspaper accusing the India Meteorological Department of scientific shortcoming (‘IMD gets its August forecast wrong’, 1 September 2016). The report claims that the IMD in June 2016 had forecast that rains for August would be more than usual but that the recorded rain was less than […]

dialogue

  • Misreading monsoon | Resources Research on Misreading monsoon
  • Satish on A tribute to the weathermen of Bharat
  • Climate portal editor on A tribute to the weathermen of Bharat
  • Climate portal editor on A tribute to the weathermen of Bharat
  • Climate portal editor on A tribute to the weathermen of Bharat

Categories

Copyright © 2025 indiaclimateportal.org.