What a monsoon season is can no longer be judged by the over-simplified sums that assure the country about departures from an ‘average’ and the potential of ‘catching up’ as a season progresses. Since the 2009 drought, the awareness of farmers’ cooperatives and groups about the meteorological products and data available with the only provider of such measurements has grown. What has not grown is the willingness of government agencies on the one hand, and the consuming public on the other, to make similar investments in pursuing such clarity.
The area chart with its jagged stripes is the simplest indicator of the gap between the central government’s sanguine response to a very serious monsoon deficit, and the conditions that our districts have recorded since the first week of June 2014. The chart, based on the Indian Meteorological Department’s weekly district recordings of rainfall, plots 641 of these readings over ten weeks.

Our modified monsoon measure shows the overall trend, and made the case early for state and district level relief.
It is immediately clear that the green stripe (for ‘normal’) has at no point been significantly larger than any one of the other three important stripes, coloured deep red (for ‘scanty’), peach (for ‘deficient’) and blue (for ‘excess’).
In the seventh week of monsoon 2014 (17 to 23 July 2014) the number of districts that recorded normal rainfall for that week was 126, and that is the maximum number that have reported normal rainfall for a week. The next highest number of districts reporting normal for a week is 92, which was for the preceding week (10 to 16 July 2014).
More serious is the district-level reporting for the following three weeks – ending 30 July, 06 August and 13 August – which show the number of districts that reported normal rain for each week was less than 20% of the number of districts that reported deficient, scanty or excess rainfall. It was during this period that central government ministries and agencies did not publicly disclose the widespread monsoon deficiency and which did not act, by alerting the consuming public, to the short and medium term consequences of the monsoon crisis.
The modified monsoon measure (which has been advocated as a method to prime local administrations towards early recognition of the need for relief and remedial action in drought and drought-like conditions) displays to greater effect the glaring imbalance between ‘normals’ and their absence in the districts. In every one of the ten weeks, the light red bar (the ‘deficient 2’ measure, for rainfall of 21% less and lower) dominates.
Otherwise it is the dark blue bar (the ‘excess 2’ measure, for rainfall of 21% more and above) which is next most prominent. This is the clearest signal from a close reading of the district rainfall reportage that volatility in rainfall quantities is the feature most visible throughout monsoon 2014.
The IMD’s running table of the distict rainfall departures confirms this trend for monsoon 2014. In many of the 36 meteorological sub-divisions, weeks of scanty and deficient rainfall are broken by normal or excess rainfall, only to return to scanty and deficient. Taking the districts of Odisha and of western Madhya Pradesh as examples, this volatility can be seen at a glance, and is in concurrence with the overall trends that the modified monsoon measure has been indicating for the last two months.


 quibbling by both Ramesh and Dasgupta are of very little use locally in India. That is why we think the Centre for Policy Research and similar institutes and establishments which study climate change in all its perplexing colours (none of them more frustrating than the UN negotiations) must alter the subject – to the ‘whom’ of people where they live rather than the ‘what’ of negotiating positions.
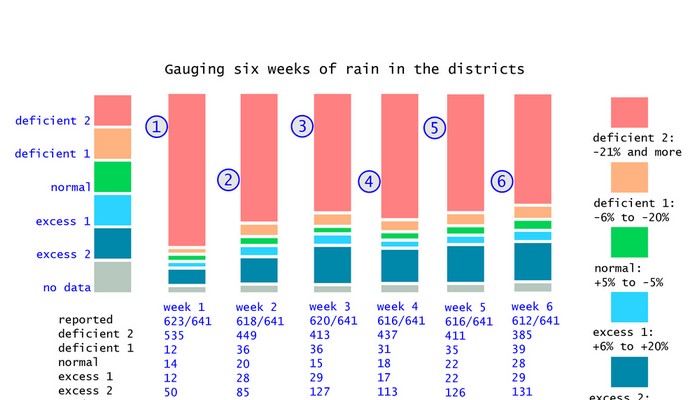 We urge the Ministry of Earth Sciences, the India Meteorology Department and the Ministry of Information and Broadcasting to cease the use of a ‘national’ rainfall average to describe the progress of monsoon 2014. This is a measure that has no meaning for cultivators in any of our agro-ecological zones, and has no meaning for any individual taluka or tehsil in the 36 meteorological sub-divisions. What we need to see urgently adopted is a realistic overview that numerically and graphically explains the situation, at as granular a level as possible.
 Every week, the Central Water Commission releases to the public and to government departments the numbers that describe how much water is stored in 85 reservoirs in India. These are the reservoirs designated as nationally important, because of their roles in providing water for large irrigated command areas and for generating hydro-electric power (37 of these dams).

 The first Union Budget of the Bharatiya Janata Party-led National Democratic Alliance government has focused on the growth of the economy. Finance Minister Arun Jaitley has through India’s 2014-15 budget said he will “usher in a policy regime” that takes the country “towards a sustained growth of 7-8 per cent or above within the next 3-4 years”.