The India Climate Observatory

Commentary, action and research on climate and development in India

  • Home
  • About
  • Monsoon 2018
  • Current
  • Bulletin
  • Contact
  • Announcements

Call for Earth Care Awards 2015

October 14, 2014 by Climate portal editor Leave a Comment

RG_ICP_CEE_20141014

The Earth Care Awards are an effort to honour excellence in initiatives towards climate change mitigation and adaptation by industries, communities and individuals. The call for the 2015 awards is now open.

The activity is led by JSW and Times of India as the joint sponsors, with the Centre for Environment Education (CEE) as the knowledge partner and TERRE Policy Center as the outreach partner. Initiated in year 2007 with India as key focus country, the award now reaches out to countries in SAARC region – Afghanistan, Nepal, Pakistan, Bhutan, India, Sri Lanka, Maldives and Bangladesh. More details on the award and the nomination process can be found here.

The award focuses on three important areas: GHG mitigation by large and small & medium industries, land use land use changes and water resources by community groups, NGOs and research and development institutions, and, innovation for climate protection by individuals or institutions. CEE as the knowledge partner assists the Earth Care Jury in evaluating the applications.

CEE_earth_care_awards_2015The challenges posed by climate change in the region needs to have response strategies suitable to the region climatic and socio-economic contexts. The present compilation of case studies puts forward responses emanating from ground level on mitigation and adaptation requirement to climate change.

This has been compiled through a process of application and field level due diligence. The awards process has been continually involved in exploring projects which reflect commitment and results integrating climate change considerations in their operations, development activities and innovations.

These case studies are aimed to bring out those who have put conscientious efforts to recognize and integrate climate concerns into their activities. The cases reflect how communities, industries and innovators are putting efforts and taking steps to minimize and adapt to climate change.

The case studies highlight activities related to building institutional mechanism, strengthening local bodies for managing common property resource and ecosystem functions, identifying and developing synergy and partnerships, plan for maximizing resource efficiency and translate management commitment and prioritizing local needs for technology innovations.

Filed Under: Announcements, Reports & Comment Tagged With: adaptation, CEE, Centre for Environment Education, Climate Change, Earth Care award, GHG, industry, JSW, mitigation, SAARC, Times of India

India braces for cyclone Hudhud

October 11, 2014 by Climate portal editor Leave a Comment

Insat-3D’s view of the path inland of Hudhud at 1730 IST (5:30pm IST) on 12 October. The cyclonic storm is now moving north-northwest through Odisha into Jharkhand, Chhattisgarh and south Bihar. Image: IMD

Insat-3D’s view of the path inland of Hudhud at 1730 IST (5:30pm IST) on 12 October. The cyclonic storm is now moving north-northwest through Odisha into Jharkhand, Chhattisgarh and south Bihar. Image: IMD

Oct 14 – The Armed Forces have further stepped up their rescue and relief operations in the coastal areas of Andhra Pradesh and Odisha. The Press Information Bureau has reported that eight ‘composite’ Army teams have been deployed in Vishakhapatnam and another eight teams in Srikakulam.

Prime Minister Narendra Modi examining pictures of destruction caused by Cyclone HudHud, at Vizag Collectorate, on 14 October 2014. Image: PIB

Prime Minister Narendra Modi and Andhra Pradesh chief minister N Chandrababu Naidu examining pictures of destruction caused by Cyclone HudHud, at Vizag Collectorate, on 14 October 2014. Image: PIB

The Indian Air Force has deployed C-17, C130J, AN-32, IL-76, Mi-17 and Chetak aircraft and helicopters for rescue and relief work. A total of 120 tonnes of essential supplies have been airlifted to Visakhapatnam from Vijayawada and Rajamundry, while essential supplies have also been marshalled at the Naval airfield at Visakhapatnam. Until the evening of 14 October, 36 sorties were made towards relief operations. Two road clearance teams of Army have been employed in the north of Srikakulum district and the road between Achutapuram and Vizag has been cleared by the armed forces teams.

An aerial survey was conducted by C-130J of the IAF and P-8I of the Navy with satellite imagery having been used to assess the impact of cyclone Hudhud while coastal reconnaissance is being done by the Coast Guard. Additional Engineer Units of the Army are being flown to Visakhapatnam.

Oct 12 – The IMD has issued its evening alert on cyclone Hudhud. The 1700 IST (5:00pm IST) alert contains a heavy rainfall warning and a wind warning.

Heavy rainfall warning: Rainfall at most places with heavy (6.5-12.4 cm) to very heavy falls (12.5-24.4 cm) at a few places and isolated extremely heavy falls (>24.5 cm) would occur over West and East Godavari, Visakhapatnam, Vijayanagaram and Srikakulam districts of north Andhra Pradesh and Ganjam, Gajapati, Koraput, Rayagada, Nabarangpur, Malkangiri, Kalahandi, Phulbani districts of south Odisha during next 24 hrs. Rainfall would occur at most places with heavy to very heavy rainfall at isolated places over Krishna, Guntur and Prakasham districts of Andhra Pradesh and north Odisha during the same period. Rainfall at most places with heavy falls at a few places would occur over south Chattisgarh, adjoining Telangana and isolated heavy to very heavy falls over north Chattisgarh, east Madhya Pradesh, Jharkhand and Bihar.

Cyclone Hudhud will degrade into a severe cyclonic storm, then a cyclonic storm and by 13 October morning into a deep depression. Until 14 October it will continue to pose a danger with heavy rainfall and high winds. This IMD table explains why.

Cyclone Hudhud will degrade into a severe cyclonic storm, then a cyclonic storm and by 13 October morning into a deep depression. Until 14 October it will continue to pose a danger with heavy rainfall and high winds. This IMD table explains why.

Press Information Bureau distributes very useful railway helpline numbers.

Press Information Bureau distributes very useful railway helpline numbers.

Wind warning: Current gale wind speed reaching 130-140 kmph gusting to 150 kmph would decrease gradually to 100-110 kmph gusting to 120 kmph during next 3 hours and to 80-90 kmph during subsequent 6 hours over East Godavari, Visakhapatnam, Vizianagaram and Srikakulam districts of North Andhra Pradesh. Wind speed of 80-90 kmph gusting to 100 kmph would prevail over Koraput, Malkangiri, Nabarangpur and Rayagada districts during next 6 hrs and 50 to 60 kmph during subsequent 12 hrs. Squally wind speed reaching upto 55-65 kmph gusting to 75 kmph would also prevail along and off West Godavari and Krishna districts of Andhra Pradesh, Ganjam and Gajapati districts of Odisha, south Chattisgarh and adjoining districts of north Telangana during next 12 hours.

Andhra Pradesh helpline numbers here. (Thanks to Ankur Singh ‏@ankurzzzz)

Andhra Pradesh helpline numbers here. (Thanks to Ankur Singh ‏@ankurzzzz)

Odisha district control room phone numbers have been distributed thanks to eodisha.org.

They are: Mayurbhanj 06792 252759, Jajpur 06728 222648, Gajapati 06815 222943, Dhenkanal 06762 221376, Khurda 06755 220002, Keonjhar 06766 255437, Cuttack 0671 2507842, Ganjam 06811 263978, Puri 06752 223237, Kendrapara 06727 232803, Jagatsinghpur 06724 220368, Balasore 06782 26267, Bhadrak 06784 251881.

There are reports on twitter that the leading edge of cyclone Hudhud crossed the coast at around 1030 IST (0500 UTC). The reported maximum wind speed is just above 200 kmph which means the destructive force threatens structures too.

Strangely calm right Now. Everything outside is eerily quiet. We’re IN THE EYE of the storm now #Cyclone #Hudhud #Vizag #Visakhapatnam

— Deepa Ghosh (@deepaghosh2007) October 12, 2014

This tweet means the western ‘wall’ of the cyclone has now crossed completely – it has taken just under two hours. The eastern ‘wall’ crossing will now begin.

Cyclone #Hudhud hits the coast of Andhra Pradesh at Kailashgiri in Visakhapatnam. Live updates http://t.co/FQU6kZvVSR pic.twitter.com/YGzZYwIUpg

— Sudhan Rajagopal BJP (@BJPsudhanRSS) October 12, 2014

Cyclone #Hudhud makes landfall at Bheemunipatanam, slightly north of Vizag. #TVnews

— Saswat K Swain (@saswat28) October 12, 2014

Roofs of houses fly away like leaves, huge trees falling everywhere #Hudhud creating maximum destruction.

— Imran Baig (@imranbaig) October 12, 2014

Navy officials warn that there will be a lull in the storm at around 11.30 am, but the storm will again intensify after that for a few hours.
Zee News has a list of cancelled and curtailed trains.
At least 400,000 people have been evacuated from the coastal areas of Andhra Pradesh and Odisha states as authorities aimed for zero casualties.

Oct 11 -Where is Cyclone Hudhud and how fast is it moving towards land? The India Meteorological Department has said in its most recent alert – 1430/2:30pm on 11 October – that “the Very Severe Cyclonic Storm” is now about 260 kilometres south-east of Visakhapatnam and 350 km south-south-east of Gopalpur. IMD expects the cyclone to travel north-west and cross the coast of north Andhra Pradesh, near Visakhapatnam, by mid-morning on 12 October 2014.

The projected path of the cyclone and its outer rainbands, which in the case of Hudhud are around 80 km thick measured from the eye. Image: GDACS

The projected path of the cyclone and its outer rainbands, which in the case of Hudhud are around 80 km thick measured from the eye. Image: GDACS

Around 100,000 people have been evacuated in Andhra Pradesh to high-rise buildings, shelters and relief centres, with plans to move a total of 300,000 to safety. Authorities in Odisha said they were monitoring the situation and would, if necessary, move 300,000 people most at risk.

The evacuation effort was comparable in scale to the one that preceded Cyclone Phailin exactly a year ago, and which was credited with minimising the fatalities to 53. When a huge storm hit the same area 15 years ago, 10,000 people died.

Authorities have been stocking cyclone shelters with dry rations, water purification tablets and generators. They have opened up 24-hour emergency control rooms and dispatched satellite phones to officials in charge of vulnerable districts.

IMD’s table of wind speeds at the surface (sea level) brought by Hudhud. Note the exceptionally strong winds between 2330/11:30pm on 11 October and 1130/11:30am on 12 October.

IMD’s table of wind speeds at the surface (sea level) brought by Hudhud. Note the exceptionally strong winds between 2330/11:30pm on 11 October and 1130/11:30am on 12 October.

The AP government has cancelled leaves of employees and has asked everyone to remain on duty on the weekend.  In Vizag, where the cyclone is expected to make landfall, the administration has opened 175 shelters and moved close to 40,000 people from the coastal villages. In Srikakulam, people of 250 villages in 11 mandals which may be affected have been evacuated.

Vishakhapatnam, Bhimunipatnam, Chittivalasa and Konada are expected to face storm surges of over 1 metre. Source: GDACS

Vishakhapatnam, Bhimunipatnam, Chittivalasa and Konada are expected to face storm surges of over 1 metre. Source: GDACS

While human casualties are not expected due to the massive evacuation, power and telecommunication lines will be uprooted leading to widespread disruption. A warning has been issued that flooding and uprooted trees will cut off escape routes, national and state highways and traffic is being regulated to ensure that no one is caught in the flash floods caused by heavy rains.

Officials said that National Disaster Response Force teams have been strategically placed along the coast to be deployed wherever they are required. Railways has cancelled all trains passing through the three districts which are likely to be affected.

The IMD has issued a “Heavy Rainfall Warning” which has said that driven by the cyclonic winds, rainfall at most places along the AP and Odisha coast will be heavy (6.5–12.4cm) to very heavy (12.5–24.4 cm). These places include West and East Godavari, Visakhapatnam, Vijayanagaram and Srikakulam districts of north Andhra Pradesh and Ganjam, Gajapati, Koraput, Rayagada, Nabarangpur, Malkangiri, Kalahandi, Phulbani districts of south Odisha.

This panel of four images shows the wind patterns of the cyclone at different altitudes. Top left is at 1,000 millibars (mb) of atmospheric pressure which is around sea level, top right is at 850 mb which is at around 1,500 metres high, bottom left is at 700 mb which is at around 3,500 metres, and bottom right is at 500 mb which is at around 5,000 metres. The direction of the greenish lines shows the winds rushing into the cyclonic centre. The visualisations have been collected from the ‘earth.nullschool.net’, which visually processes global weather conditions forecast by supercomputers and updated every three hours.

This panel of four images shows the wind patterns of the cyclone at different altitudes. Top left is at 1,000 millibars (mb) of atmospheric pressure which is around sea level, top right is at 850 mb which is at around 1,500 metres high, bottom left is at 700 mb which is at around 3,500 metres, and bottom right is at 500 mb which is at around 5,000 metres. The direction of the greenish lines shows the winds rushing into the cyclonic centre. The visualisations have been collected from the ‘earth.nullschool.net’, which visually processes global weather conditions forecast by supercomputers and updated every three hours.

The India Meteorological Department said on the evening of 10 October that the “Very Severe Cyclonic Storm” is centered near latitude 15.0ºN and longitude 86.8ºE about 470 km east-southeast of Visakhapatnam and 520 km south-southeast of Gopalpur. This was the fix IMD had on the centre of the cyclone at 1430 IST on 10 October 2014.

Here are the salient points from news reports released during the afternoon of 10 October:

Cyclone Hudhud will cross the north Andhra Pradesh coast on October 12 and is expected to make landfall close to Visakhapatnam, according to the Cyclone Warning Centre (CWC) at Visakhapatnam. “It is forecast that Hudhud, which is already a severe cyclonic storm, will intensify into a very severe cyclonic storm in next 12 hours. Hudhud is likely to make landfall on October 12 close to Visakhapatnam,” said IMD’s Hyderabad centre.

Cyclone Hudhud has moved closer to the coast of Odisha and eight districts of the state are likely to be affected by it. The districts likely to be affected by the cyclone are Ganjam, Gajapati, Rayagada, Koraput, Malkangiri, Nabarangpur, Kalahandi and Kandhamal. All these districts have been provided with satellite phones for emergency and constant vigil was being maintained on the rivers like Bansadhara, Rusikulya and Nagabali as heavy rain is expected in southern districts.

With cyclone Hudhud fast approaching the states of Odisha, Andhra Pradesh and Telangana, Union Home Minister Rajnath Singh today spoke to the chief ministers of the three states on the steps being taken to deal with the situation. Odisha Chief Minister Naveen Patnaik sought satellite phones which could be used in case high-speed winds disturbed the telecommunication system.

According to the India Meteorological Department, the wind speeds of cyclone Hudhud will be less than what the east coast experienced during Phailin in October 2013. The wind speed during cyclone Phailin was nearly 210 kmph, which made the cyclone the second-strongest ever to hit India’s coastal region. The country had witnessed its severest cyclone in Odisha in 1999.

Frequent updates and advisories can also be found at GDACS – the Global Disaster Alert and Coordination System (a cooperation framework under the UN umbrella). GDACS provides real-time access to web-based disaster information systems and related coordination tools.

Cities that will directly be affected by cyclone Hudhud are Vishakhapatnam in Andhra Pradesh, Jagdalpur in Chhattisgarh, Vizianagaram in AP, Bhogapuram in AP, and Anakapalle in AP.

Filed Under: Current, Latest, Monsoon 2014 Tagged With: Andhra Pradesh, Bay of Bengal, Chandrababu Naidu, cyclone, cyclonic storm, disaster, emergency, evacuation, flood, Gajapati, Ganjam, Godavari, Hudhud, IMD, Kalahandi, Koraput, Malkangiri, Modi, Nabarangpur, Odisha, Phailin, Phulbani, Rayagada, relief, Srikakulam, storm, Vijayanagaram, Visakhapatnam

Climate measures that matter

October 8, 2014 by Climate portal editor Leave a Comment

RG_ICP_countries_emissions_201410

India has been saying during the last several international negotiations about climate change that our country, like other ‘developing’ countries, has a right to development. What this means is India has officially said our country will continue to burn coal and petroleum products in quantities that contribute to India emitting 1.954 million tons of CO2 a year (this figure is for 2012).

The ‘developed’ world (mostly countries in western Europe and North America) point to this large quantity and demand that India (and China, which emits very much more) do something to halt this rise and to decrease it. India’s response has been – recognise what you have done from the time of the Industrial Revolution and then we’ll resume talking.

This is unlikely to result in any constructive recognition of all that is linked. A country’s total emissions is one part of the ‘development’ picture and others are at least as important. There are also tons of CO2 emitted per capita (India has often said that its per capita emissions are far below those of the West). And there is per capita consumption of electricity (which is still mainly generated by burning coal).

That is why, when we look at the relationship between these three measures for a country, and between countries for any one of these three measures, we see connections that are otherwise missed due to a focus on a single measure. Our diagram, ‘Climate Measures that Matter’, helps explain these connections. It can be used as an aide to understanding better India’s position at climate negotiations, and provides much-needed context to the arguments about a country’s total emissions and its per capita emissions. [See the statement by Minster for Environment Prakash Javadekar, at the United Nations Climate Summit 2014.]

This diagram is an aide to understanding better India's position at climate negotiations. It provides much-needed context to the arguments about a country's total emissions and its per capita emissions.

This diagram is an aide to understanding better India’s position at climate negotiations. It provides much-needed context to the arguments about a country’s total emissions and its per capita emissions.

The country and energy data used in this diagram is for the latest year which is 2012. The source for the data is the International Energy Agency’s ‘Key World Energy Statistics 2014’ . This selection of countries compares countries of South Asia, East Asia, the larger economies of the OECD, the BRICS, other European countries, and countries of the Middle East. For each of the three measures, the size of the circles are relative to each other.

[The full size image is available here (png. 266kb). This diagram is distributed under a creative commons licence (2014) by the India Climate Portal. Reproduce only with full attribution.]

One could argue that the relationship between three measures for any country shows its responsibilities towards curbing the use of fossil fuels both nationally and individually, and towards capping electricity use. For example, per capita electricity use in a number of the countries shown in the diagram is seven or eight times more, and even ten times more and above, than India’s use.

Our South Asian neighbours – Bangladesh, Nepal, Pakistan and Sri Lanka – have by all three measures relatively small global impacts. The size of our population and the depth of our industry and economy however has made India the third largest emitter of CO2 (after China and the USA). But if India seeks some sort of ‘parity’ in electricity use – or if India sees the low per capita CO2 emissions as a ‘development’ gap – our total contribution to CO2 emissions will only rise faster, hurting the environment that we share with our neighbours.

The diagram helps display some of the most glaring and conspicuous differences between countries’ impacts on the atmosphere and ecosphere. These differences can be taken to mean fuel use and consumption must be halted and stringently curbed, whether or not the Kyoto Protocol and a successor treaty exist. That would be the way of acting responsibly for a country. [See the text of the Joint Statement issued at the 18th BASIC Ministerial Meeting on Climate Change in August 2014.]

These differences can also mean that the ‘developed’ countries recognise – as we and many ‘developing’ and ‘less developed’ countries have been reminding them repeatedly – that the way their economies and societies have functioned has caused much of the problem in the first place, and they must stop shunting the onus of responsibility onto us.

Finally, these differences should also show why being small is not being ‘poor’ and ‘less developed’. Households and families that use few kilowatts instead of many, burn few litres of fuel instead of many, are very much more responsible and environmentally balanced than others. It is the small circles in this diagram that ought to be the inspiration.

Creative Commons License
Climate Measures that Matter by India Climate Portal / Rahul Goswami is licensed under a Creative Commons Attribution-NonCommercial-NoDerivatives 4.0 International License.

Filed Under: Blogs, Reports & Comment Tagged With: atmosphere, Bangladesh, carbon, China, Climate Change, CO2, electricity, emissions, energy, environment, fossil fuels, India, Kyoto Protocol, Nepal, Pakistan, per capita, South Asia, Sri Lanka, UNFCCC

A report card on monsoon 2014

October 1, 2014 by Climate portal editor Leave a Comment

RG_ICP_districts_table_201410
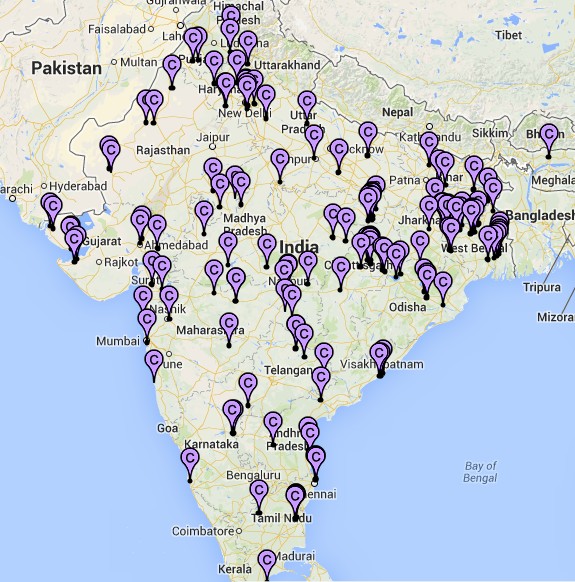
From the first week of June 2014 until the middle of September 2014, there have been floods and conditions equivalent to drought in many districts, and for India the tale of monsoon 2014 comes from a reading of individual districts, not from a national ‘average’ or a ‘cumulative’. [This article was published by the newspaper DNA.]

Despite the advances made by our agencies in weather forecasting and climate monitoring, the science of meteorology still remains to be effectively distilled so that it can be used by citizens and, wherever possible, expanded and given context by ground-based observation and recording. One sector in which this does take place – albeit at a level still far below its potential – is agriculture. The reason is clear: our crop staples (the cereals, pulses, vegetables and fruit) have their individual calendars for preparation, sowing, tending and harvesting.

This line chart tells some of the tale. It shows that for the first six weeks of monsoon 2014, most districts recorded rain below their 'normals' for those weeks. The lines are percentile lines; they tell us what percent of districts recorded how much rainfall in a monsoon week relative to their normals for that week. This chart does not show how much rain - it shows distance away from a weekly normal for districts. The left scale is a percentage - higher percentages indicate how far above normal districts recorded their rainfall, negative numbers show us how far below normal their rainfall was. The dates (the bottom scale) are for weeks ending on that date for which normals and departures from normal were recorded. The P_01 to P_09 lines are the percentiles (10th to 90th) of all districts in every week.

This line chart tells some of the tale. It shows that for the first six weeks of monsoon 2014, most districts recorded rain below their ‘normals’ for those weeks. The lines are percentile lines; they tell us what percent of districts recorded how much rainfall in a monsoon week relative to their normals for that week. This chart does not show how much rain – it shows distance away from a weekly normal for districts.
The left scale is a percentage – higher percentages indicate how far above normal districts recorded their rainfall, negative numbers show us how far below normal their rainfall was. The dates (the bottom scale) are for weeks ending on that date for which normals and departures from normal were recorded. The P_01 to P_09 lines are the percentiles (10th to 90th) of all districts in every week.

And so we have an agricultural meteorology system that faithfully and reliably informs ‘kisans’ and cultivators in 641 districts what to expect from the weather for the next week. Thanks to mobile phones, weather alerts and crop advisories are distributed in all our major languages to a portion of the farming households working on 138 million farm holdings, (of which 117 million are small). But this is still only a portion, and is far from adequate in distributing the results of the work of our earth scientists and field staff.

Moreover, every other sector of development requires such raw data and location-specific analysis: the Department of Rural Development, the National Rural Health Mission, the Nirmal Bharat Abhiyan (for drinking water and sanitation), the food-based programmes (like the mid-day meals) for which the availability of ingredients and their supply is the essence of their work, the Central Water Commission and the Central Ground Water Board, whose work it is to determine the water flows and balances in river sub-basins and watersheds (there are 3,257), and districts administrations (which administer 232,855 panchayats) and municipal councils alike which must implement relief measures when drought sets in or must ration supply when there are shortages. This is but a small list of agencies whose work is directly affected by the Indian summer monsoon and its activity where they work.

A dense network of weather stations (more of these are being automated every month, but every taluka still does not have one) is complemented by dedicated satellites which provides continuous coverage of the sub-continent, the northern Asian land mass, the surrounding oceans southwards until beyond the Tropic of Capricorn.

The typical IMD map of 'normal' rainfall measured by the meteorological sub-divisions. The detailed weekly tables give us a very different picture

The typical IMD map of ‘normal’ rainfall measured by the meteorological sub-divisions. The detailed weekly tables give us a very different picture

Methods to simply and accurately funnel this stream of real-time data and imagery are available, mostly at no cost, in order to aid local administrations, farmers and cultivators, and all citizens. It is this availability and relative simplicity of use (block-level weather forecasts for 72 hours are now available as local language apps on smartphones) that must be encouraged by the official agencies – for they simply do not have the persons to do so at the scale and detail required.

Consider the setting in early July 2014. India’s summer monsoon was already late, and where it was late but active it was weak (as shown by the chart). The indications from the central earth science agencies (including the India Meteorological Department), from the Indian Institute of Tropical Meteorology, from the National Centre for Medium Range Weather Forecasting were that it would be end-June before the summer monsoon system settles over central India and the western Gangetic plains. This did not happen for another two weeks, until six of the usual 16 monsoon weeks had passed.

When in mid-July more rainfall was recorded in the districts, even then, as the chart shows, only 50% of the districts reached their ‘normals’ for that week only. Thereafter, the volatility of rainfall set in and while for those in our towns and cities there was relief from the searing summer temperatures the rains did not assure sowing conditions for farmers and cultivators, nor did it add, in July, to the stores of water in major and minor reservoirs.

That is why the IMD’s outdated and stodgy public outreach practice must be overhauled, completely. The bland map (see example) of sub-divisions is of little use when what we want to know pertains to tehsil and town. The Met Department’s rain adequacy categories must be replaced too by measures that are geared towards aiding alerts and advisories – ‘normal’ is rainfall up to +19% above a given period’s average and also down to -19% from that same average, a range that can make or break the efforts of a horticulturist.

This table illustrates the trend of weekly rainfall in 40 districts. These districts are selected as being home to the largest rural populations, two from the 20 major states (by population). The numbers by week and district describe how far from a 'normal' the recorded rainfall for that week was. Several overall observations stand out. Districts with weeks coloured light rose dominate, for these show those that received much less rain than they should have. Districts with a shade of deeper blue are the next most frequent category, and those received excess rain. Taken together, this tells us that extremes - very much less or more - were common for this group of districts in India with large rural populations. We can see the prolonged dry spells for districts in Haryana and Punjab; likewise the absence of rain for the first six monsoon weeks in Gujarat and Maharashtra; are examples of wide swings around weekly 'normal' in Giridih (Jharkhand), Muzaffarpur (Bihar), Haridwar (Uttarakhand), Mandi (Himachal Pradesh), Viluppuram (Tamil Nadu), and Mahbubnagar (Andhra Pradesh). The weeks ending 20 August in Bihar and the weeks ending September 3 and 10 in Jammu and Kashmir immediately stand out - the Kosi had breached its banks in Bihar and the Chenab submerged Srinagar and Jammu.

This table illustrates the trend of weekly rainfall in 40 districts. These districts are selected as being home to the largest rural populations, two from the 20 major states (by population). The numbers by week and district describe how far from a ‘normal’ the recorded rainfall for that week was.
Several overall observations stand out. Districts with weeks coloured light rose dominate, for these show those that received much less rain than they should have. Districts with a shade of deeper blue are the next most frequent category, and those received excess rain. Taken together, this tells us that extremes – very much less or more – were common for this group of districts in India with large rural populations.
We can see the prolonged dry spells for districts in Haryana and Punjab; likewise the absence of rain for the first six monsoon weeks in Gujarat and Maharashtra; are examples of wide swings around weekly ‘normal’ in Giridih (Jharkhand), Muzaffarpur (Bihar), Haridwar (Uttarakhand), Mandi (Himachal Pradesh), Viluppuram (Tamil Nadu), and Mahbubnagar (Andhra Pradesh). The weeks ending 20 August in Bihar and the weeks ending September 3 and 10 in Jammu and Kashmir immediately stand out – the Kosi had breached its banks in Bihar and the Chenab submerged Srinagar and Jammu.

Likewise, excess is +20% and more, deficient is -20% to -59% and scanty is -60% to -99%. To illustrate how misleading these categories can be, the difference between an excess of +21% and +41% can be the difference between water enough to puddle rice fields and a river breaking its banks to ruin those fields. [Get a full resolution image of the table here, 1.85 MB.]

The yawning gap between the technical competence of India’s climate monitoring systems, and they ways in which they are used, must be bridged and this is best done through public participation and citizen initiative. The politics of monsoon and of water will continue, but must not be allowed to define how our systems are used. Nor must they detract from our long history of weather observation, which dates back at least to the ‘Vrhat Sanhita’ of Varahamihira.

It has only signalled policy confusion for central and state governments to have not declared districts and talukas as affected by drought – which they should have by late July 2014 – while at the same time quietly announcing to administrations, as the Ministry of Agriculture did, that “to deal with challenges posed by delayed and aberrant monsoon and in the wake of shortfall in sowing of major crops during kharif 2014, the government has initiated interventions”. These being a diesel subsidy for what is called ‘protective irrigation’ of crops, raising the ceiling on the seed subsidy, rolling out a drought mitigating programme for horticulture, boosting fodder cultivation through the flagship Rashtriya Krishi Vikas Yojana.

The new government has stated time and again its desire to improve and strengthen governance. This must come to include a concerted drive to democratise the use of public domain information, including our monsoon and water, in order that we residents of 4,041 statutory towns (large cities included) and 3,894 census towns can judge for ourselves the relationships between the food we buy, they rain we receive, our individual use of about 70 litres of water a day, and the fluctuation of these trends from one monsoon to another. The moral of monsoon 2014 is that we must reclaim local measures for local use.

Rahul Goswami

Filed Under: Latest, Monsoon 2014 Tagged With: 2014, administration, agriculture, crop, district, ground water, health, IMD, India, krishi, meteorology, monsoon, policy, remote sensing, river, sanitation, smartphone, varahamihira, vrhat samhita, water, watershed, weather station

Warm streets, cold summits

September 25, 2014 by Climate portal editor Leave a Comment

A part of the people's march against climate change in New York, USA. Photo: Reuters / Eduardo Munoz

A part of the people’s march against climate change in New York, USA. Photo: Reuters / Eduardo Munoz

The United Nations Climate Summit 2014, held on 23 September, can be considered as a study in two contrasts. On the one hand was the People’s Climate March – an enormous gathering of concerned citizens in New York, USA, which may have seen a combined total of some 400,000 people. The marchers through their diversity and energy delivered one message in many creative ways. That message was: we citizens can and will rid the planet of fossil fuels and nuclear power, that such action will be demanding and difficult but we will do it at the grassroots and make a difference there.

On the other hand was the Climate Summit. This, said the UN, would serve as a public platform for leaders at the highest level, by which is meant all UN Member States, as well as finance, business, civil society and local leaders from public and private sectors. The gathering, said the UN, would “catalyse ambitious action on the ground to reduce emissions and strengthen climate resilience and mobilise political will for an ambitious global agreement by 2015 that limits the world to a less than 2-degree Celsius rise in global temperature”.

Did it succeed? No and yes. If there has been a gain from the events of 23 September it is to strengthen their individual and community resolve to act locally in an effort to tackle both the effects and the causes of climate change.

Where the Summit itself is concerned, against the background of 22 years of negotiations and conferences on climate change (the UN Framework Convention on Climate Change came about in 1992) it proved to be atypical. There were a number of promises and resolutions made to add to the mountain of such promises and resolutions but this summit – like every single other summit before it – brought no significant response from the political establishment.

Unsurprisingly, this is not how the UN sees the outcome of its recent work, for UN Secretary-General Ban Ki-moon summed up the Summit as “a great day, a historic day. Never before have so many leaders gathered to commit to action on climate change”. Ban said that the Summit he called “delivered” because the many leaders attending “reaffirmed determination to limit global temperature rise to less than 2 degrees Celsius by cutting emissions”.

Such announcements underline the contrast between the desire on the street and the cold comfort of summit announcements (now in their 22nd year). On 23 September the UN tip-toed around the large global and regional corporations (and their financier special interests) whose business practices have deepened environmental and socio-economic emergencies all over the world, and which are responsible for worsening – much less alleviating – the vulnerabilities of populations exposed to the risk of climate change.

The UN has regrettably turned into a recurring practice this avoiding of issues central to climate change (see the summary document, pdf, 243kb). But, at the same time, the UN together with a host of organisations that have more or less to do with climate change (private, academic, industry fora and so on) repeated once more a worn roster of promises.

These are:
* “Strong support” for the Green Climate Fund, with one more total being pledged (precious little has been actually transferred) and still more being “committed” (these are all commitments with renewable expiry dates).

* “A new coalition of governments, business, finance, multilateral development banks and civil society leaders” (what happened to all the other coalitions announced grandly at every other summit?) which once again was quick to commit to providing US$ 200 billion “for financing low-carbon and climate-resilient development”, including banks which want a ‘Green Bonds’ market.

* That carbon pricing continues to be “one of the most powerful tools available for reducing emissions and generating sustainable development and growth”, which in the end is a promise to continue the commodification and financialisation of emissions, an extremely troublesome industry whose regulation has proved difficult.

Instead of such expensive jamborees whose recycled announcements do little more than provide a false sense of security to citizens, the UN should emulate the example of the marchers and encourage small, local and meaningful action.

After the sound-and-light show of the Climate Summit 2014 we advocate just as strongly as before that it is local development – of, by, and for the people – which finds and leverages appropriate technology, encourages open source collaboration, and focuses on pragmatic, technical solutions to our problems, that will make the difference. Such action alone will reduce our impact on the environment and hedge households and communities against natural disasters made worse by a ritual of inaction.

Filed Under: Blogs Tagged With: 2014, carbon, Climate Change, climate summit, consumption, development, emissions, energy, fossil fuel, growth, New York, people's march, protest, resilient, sustainable, UN

We need more than summits and marches to deal with climate change

September 22, 2014 by Climate portal editor Leave a Comment

Ban Ki-moon with marchers. "There is no 'Plan B' because we do not have 'Planet B'." Photo: UN Photo / Mark Garten

Who is the man in the blue cap and why is he on the street? Ban Ki-moon with marchers. “There is no ‘Plan B’ because we do not have ‘Planet B’.” Photo: UN Photo / Mark Garten

On September 20 and 21, the gathering of what has been called ‘climate marchers’, including many youth, expresses a growing popular concern over the impact of global warming on the world’s environment. During the march in New York, USA, the largest of the several marches held in several cities and countries, the secretary general of the United Nations, Ban Ki-moon, joined the marchers. On 23 September, the Climate Summit he has called is expected to draw more than 120 heads of government to, as the UN puts it, “galvanise action on climate change”.

Ban said he hoped the peoples’ voices will be “truly reflected to the leaders” when they meet. “Climate change is a defining issue of our time,” he added. “There is no time to lose. If we do not take action now we will have to pay much more.” There is widespread expectation that government delegations to the summit will have “concrete initiatives and that it will provide significant momentum for a global agreement on tackling climate change”.

All this has likely been of interest to the youth, but the expectation of a new push towards a global agreement on dealing with climate change needs to be balanced by even the most cursory examination of the last 20 years of climate negotiations, under the auspices of the UN Framework Convention on Climate Change (the UNFCCC), and particularly the last four years of an ever larger number of meetings all of which have singly and together contributed nothing to any hoped-for global agreement.

Nonetheless, climate change continues, the science gathers experience and the evidence accumulates. Moreover, it has become clear that a climate treaty (if and when it is signed) will not be about a single issue. Climate change is one amongst an inter-connected web of subjects related to development, sustainability, habitats and settlements, equity and justice, trade, public and social institutions, technology, investments and finance, innovation and national priorities. In many ways, the responses to climate change are directly influenced by thinking and practice in all these areas.

In a short new collection of working ideas, ‘The Way Forward in International Climate Policy: Key Issues and New Ideas 2014’, published and distributed by the Climate and Development Knowledge Network, the thesis that is advanced is: “research suggests that economic and ecological aims can co-exist, and even reinforce each other”. This may be partly true but is also contestable. As the CDKN collection also has pointed out, political tensions persist between economic growth and development on the one hand (but these should more correctly be called business and industry interests), and environmental sustainability on the other.

The term ‘sustainable development’ has engaged policy-makers and academics for 40 years now, and remains central to a set of goals (and large numbers of ‘targets’ and indicators) which will be finalised by the UN this year. Much more swiftly, ‘green growth’ has come forward as a competing idea, because ‘growth’ sounds more powerful to industry and investors, whereas ‘sustainability’ seems to imply conservation and status quo.

Historical contributions to greenhouse gases and the socio-political Southern view.

Historical contributions to greenhouse gases and the socio-political Southern view.

The marchers in New York may harbour some ideas about fairness, equity and the ethical issues surrounding climate change and those it affects. These concepts have indeed been highlighted by the IPCC climate change mitigation and adaptation reports. Although necessary, these concepts may be interpreted and implemented within the framework of national priorities and goals, yet the connections – between the concepts around equity, between what happens on the ground, and between the thickets of negotiating text – must be made.

Fairness between countries also underlies the idea of ‘common but differentiated responsibilities’ which many of the so-called ‘developing’ and the so-called ‘less developed’ countries invoke during climate negotiations. It is a concept seen as being one of the key principles of the UNFCCC and a central element of fairness and equity discussions. But it has lead to intractable arguments that pit South versus North. Who should bear the burden of investments towards adaptation and mitigation and who should benefit? Without internationally agreed climate action costs continue to mount: how should these be dealt with? Unfortunately, these questions are debated in the UN and at international negotiations not by those affected but by the financial institutions and their technology providers.

The 23 September UN Climate Summit has already focused on public spectacle and visual stylistics in the days before the meeting, rather than outline the substantial and very delayed points of discussion. The UN headquarters has been lit up with what is described as “a spectacular 30-storey architectural projection show aimed to inspire global citizens to take climate action” which is to provide a “visual reminder of what is at stake”. This is wasteful and distracting – those who have been affected by climate change in its many forms have no need to be reminded by expensive spectacle half a world away.

That is why, 22 years after countries joined the UNFCCC, there remains a clear contrast between the urgency of the situation and the absence of any significant response from the political establishment. The urgency is:

(1) The hottest March-May period in the global record which has pushed numerous record spikes in the global measures this summer. By August, according to NASA, the global average had again climbed to new high levels. NASA showed that the Global Land-Ocean Surface Temperature Index had climbed to 0.70 degrees Celsius above the mid 20th century average and about 0.95 degrees Celsius above the 1880s average. The previous record high for the period was set in 2011 at 0.69 degrees C above the global 1951 to 1980 average.

(2) For the first time, monthly concentrations of carbon dioxide (CO2) in the atmosphere topped 400 parts per million (ppm) in April 2014 throughout the northern hemisphere. “This threshold is of symbolic and scientific significance and reinforces evidence that the burning of fossil fuels and other human activities are responsible for the continuing increase in heat-trapping greenhouse gases warming our planet.” All the northern hemisphere monitoring stations forming the World Meteorological Organisation (WMO) Global Atmosphere Watch network reported record atmospheric CO2 concentrations during the seasonal maximum. This occurs early in the northern hemisphere spring before vegetation growth absorbs CO2.

The contrast between urgency and the response of the world’s political leaders has occurred, in large part, due to the contradiction which climate negotiations carefully steer around – it is not possible to resolve climate change and other major environmental problems within the framework of a macro-economic system based on GDP growth and monetary expansion. For this reason, the perspective on which the People’s Climate March was organised offers no way forward and will contribute little to a lasting and fair climate treaty.

Five months ago the secretary general of the World Meteorlogical Organisation warned that “time is running out” when the 400 ppm was crossed. “This should serve as yet another wakeup call about the constantly rising levels of greenhouse gases which are driving climate change. If we are to preserve our planet for future generations, we need urgent action to curb new emissions of these heat trapping gases.” he said. Growth and consumption – green or sustainable or otherwise – is not the answer. And a recognition of that essential condition must be the starting point at the UN Climate Summit on 23 September 2014.

– Rahul Goswami

Filed Under: Current, Reports & Comment Tagged With: 2014, 400 ppm, Ban Ki-moon, Climate Change, climate summit, development, global warming, IPCC, meteorological, NASA, surface temperature, sustainable, UN, UNFCCC, United Nations, WMO

The ‘Better Growth, Better Climate’ report

September 18, 2014 by Climate portal editor Leave a Comment

ICP_New_Climate_Economy_201409

‘Better Growth, Better Climate: The New Climate Economy Report’ has just been released by the Global Commission on the Economy and Climate, which was set up to examine whether it is possible to achieve lasting economic growth while also tackling the risks of climate change.

The report “seeks to inform economic decision-makers in both public and private sectors, many of whom recognise the serious risks caused by climate change, but also need to tackle more immediate concerns such as jobs, competitiveness and poverty”.

The report’s conclusion is that “countries at all levels of income now have the opportunity to build lasting economic growth at the same time as reducing the immense risks of climate change”. This is made possible, it has said, by structural and technological changes unfolding in the global economy and opportunities for greater economic efficiency. The capital for the necessary investments is available, and the potential for innovation is vast.

“The next 15 years will be critical, as the global economy undergoes a deep structural transformation. It will not be ‘business as usual’. The global economy will grow by more than half, a billion more people will come to live in cities, and rapid technological advance will continue to change businesses and lives. Around US$90 trillion is likely to be invested in infrastructure in the world’s urban, land use and energy systems. How these changes are managed will shape future patterns of growth, productivity and living standards.”

According to the Global Commission on the Economy and Climate, the next 15 years of investment will also determine the future of the world’s climate system. “Without stronger action in the next 10-15 years, which leads global emissions to peak and then fall, it is near certain that global average warming will exceed 2°C, the level the international community has agreed not to cross”.

Future economic growth does not have to copy the high-carbon, unevenly distributed model of the past, is the message from the report. “There is now huge potential to invest in greater efficiency, structural transformation and technological change in three key systems of the economy.”

The Commission’s work has been conducted by a partnership of eight research institutes: World Resources Institute (WRI), Climate Policy Initiative (CPI), Ethiopian Development Research Institute (EDRI), Global Green Growth Institute (GGGI), Indian Council for Research on International Economic Relations (ICRIER), LSE Cities, Stockholm Environment Institute (SEI) and Tsinghua University.

Filed Under: Reports & Comment Tagged With: cities, Climate Change, climate economy, energy, global commission, ICRIER, land use, LSE, Stockholm Environment Institute, Tsinghua, urban, World Resources Institute

Climate change is not the only villain

September 11, 2014 by Climate portal editor Leave a Comment

A woman weeps at the site of her home, devastated by floods in Kuppar village near Jammu, in Jammu and Kashmir, India. Photo: Thomson Reuters Foundation / Ashutosh Sharma

A woman weeps at the site of her home, devastated by floods in Kuppar village near Jammu, in Jammu and Kashmir, India. Photo: Thomson Reuters Foundation / Ashutosh Sharma

About 200 kilometres separates Srinagar, in the valley of Kashmir in India, from the wide and flat northern plains of Pakistan’s Punjab province, the land between Gujranwala and Sialkot. The river that links these two regions, on either side of the border between two countries, is the Jhelum and its many mountain-fed tributaries. From early September, rains that are torrential in volume and frequency for the region steadily fed the streams, swelled the rivers and then rushed through the settlements and towns of northern Pakistan and India.

On both sides of the Pakistan-India border the scene is depressingly similar. The toll of the dead will not be known until the waters drain, and even then will be estimates, as they always are. Until two days ago, 220 or 230 was the number of lives reported lost in both countries. The number of lives disrupted, displaced and reduced to misery is far greater – more than 100,000 have been rescued by the Indian Army in the state of Jammu and Kashmir. In Pakistan too it has been its army that has performed extraordinary feats of rescue and provided relief when every other administrative mechanism failed, but as the waters continued to gather in volume and speed, the September floods are already estimated to have affected more than a million in Pakistan.

A couple wades through a flooded road after heavy rains in Lahore, Pakistan, on 4 September 2014. Photo: Reuters / Mohsin Raza

A couple wades through a flooded road after heavy rains in Lahore, Pakistan, on 4 September 2014. Photo: Reuters / Mohsin Raza

There has been mourning and resignation, for lives lost and for homes destroyed, but there is also anger in both Pakistan’s Punjab and India’s Jammu and Kashmir. Economic need and the search for livelihoods has brought migrants into urban settlements, while older and more established households have sought to better their standards of living. Overlooked every single year, despite at least one emergency caused by natural phenomena, has been implementing the regulations needed for fast-growing settlements in flood-prone regions. Both countries have national disaster management authorities, and yet the complaint most commonly heard by those escaping floodwaters and by those seeking relief is: where was the warning and where was the help when we needed it?

The very recent history in India (the catastrophic rain and landslides in Uttarakhand in 2013) and in Pakistan (the record flooding of 2010) of natural disasters appears not to have led to the institutionalisation of a culture that is willing to learn from past misfortune. In both countries, media has reported scores of survivors praising swift and selfless action by the armed forces and at the same time condemning inaction by local and provincial authorities.

Climate change and its impacts has become a catch-all villain for the record floods and the devastation they have caused (and continue to). But amongst the complex menu of reasons for the failure of systems and responses, several others stand out in bolder relief. The encroachment by galloping urbanisation of river catchment areas, unregistered and illegal construction (both residential and commercial) along river banks and the blind conversion of wetlands into agricultural lands has, in both countries, turned historically familiar floods into fearsome deathtraps.

When the waters ebb and families can reunite, both Pakistan and India must together confront the real reasons behind the destruction and toll wrought by the floods of September 2014.

Filed Under: Latest, Monsoon 2014 Tagged With: army, Chenab, disaster, flood, Gujranwala, India, Jhelum, Kashmir, Lahore, Pakistan, Punjab, river, Sialkot, Srinagar, urban

India’s giant megawatt trap

September 10, 2014 by Climate portal editor 1 Comment

A panel of charts that show India's energy consumption, imports, and dependence on fossil fuel.

A panel of charts that show India’s energy consumption, imports, and dependence on fossil fuel.

Electricity as fundamental right and energy convenience as the basis of ‘development’ in Bharat and in India. If this is what Piyush Goyal means when he says his government is “is committed to ensure affordable 24×7 power” then it will come as yet another commitment that supports energy provision and consumption as the basis for determining the well-being of Bharat-vaasis and Indians (the UPA’s Bharat Nirman was the predecessor). But the Minister of State (Independent Charge) for Power, Coal and New and Renewable Energy cannot, using such a promise, ignore the very serious questions about the kind of ‘development’ being pursued by the NDA-BJP government and its environmental and social ramifications.

Goyal has said, via press conferences and meetings with the media, that the NDA government is committed to ensuring affordable power at all times (’24 x 7′ is the expression he used, which must be banished from use as being a violent idea – like nature our lives follow cycles of work and rest and ’24 x 7′ violently destroys that cycle). Goyal has promised, pending the taking of a series of steps his ministry has outlined, that such a round the clock provision of electric power will be extended to “all homes, industrial and commercial establishments” and that there will be “adequate power for farms within five years”.

The summary of India's power generation capacity, by type and by region. Source for data: Central Electricity Authority

The summary of India’s power generation capacity, by type and by region. Source for data: Central Electricity Authority

Some of the very serious questions we raise immediately pertain to what Goyal – with the help of senior ministry officials and advisers – has said. The NDA-BJP government will spend Rs 75,600 crore to (1) supply electricity through separate feeders for agricultural and rural domestic consumption, said Goyal, which will be used to provide round the clock power to rural households; and (2) on an “integrated power development initiative” which involves strengthening sub-transmission and distribution systems in urban areas. This is part of the “transformative change” the ministry has assured us is for the better. Goyal and his officials see as a sign of positive transformation that coal-based electricity generation from June to August 2014 grew by nearly 21 per cent (compared with the same months in 2013), that coal production is 9% higher in August 2014 compared with August 2013, and that Coal India (the largest coal producer company in the world which digs out 8 of every 10 tons of coal mined in India) is going to buy 250 more goods rakes (they will cost Rs 5,000 crore) so that more coal can be moved to our coal-burning power plants.

UN_Climate_Summit_2014_sm
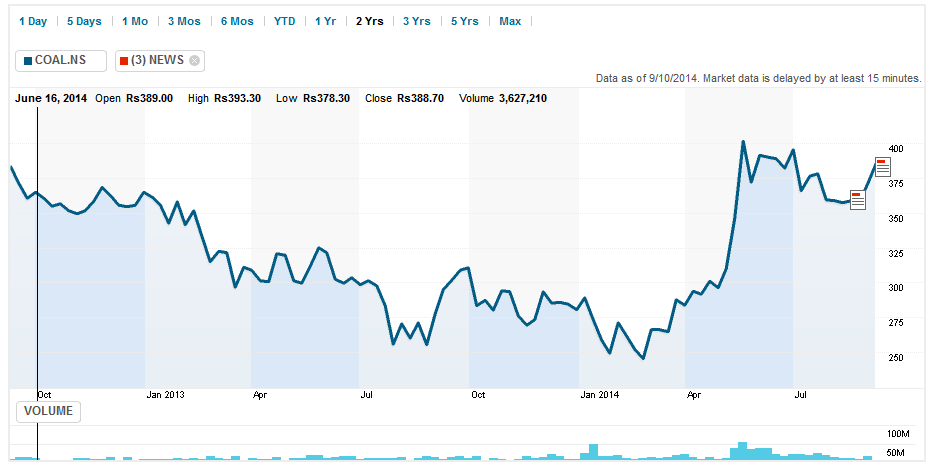
We must question the profligacy that the Goyal team is advancing in the name of round the clock, reliable and affordable electricity to all. To do so is akin to electoral promises that are populist in nature – and which appeal to the desire in rural and urban residents alike for better living conditions – and which are entirely blind to the environmental, health, financial and behavioural aspects attached to going ahead with such actions. In less than a fortnight, prime minister Narendra Modi (accompanied by a few others) will attend the United Nations Climate Summit 2014. Whether or not this summit, like many before it, forces governments to stop talking and instead act at home on tackling anthropogenic climate change is not the point. What is of concern to us is what India’s representatives will say about their commitment to reduce the cumulative impact of India’s ‘development’, with climate change being a part of that commitment.

At the UN Climate Summit 2014, it will be heard (in as many languages as there are translators available for them) that energy demand is growing along with expanding global wealth (but the UN will not say how unequally that extra wealth has been distributed). There will be grave references made to growing populations with a large number still without the round the clock electricity that Goyal has promised. Many speakers (eminent experts, as the UN system calls them) will be mobilised to remind the gathering that a shift toward renewable sources of energy (such as solar, wind and geothermal) is needed, that greater energy efficiency in appliances, buildings, lighting and vehicles are needed, and that this is so because it is essential to use the world’s resources sustainably, to diversify economies and successfully address the challenge of climate changes. It will sound suitably solemn and uplifting at the UN headquarters in New York, but the story at home in Bharat and India is solemn and deeply worrisome.

Where India's coal-burning power plants are. Map courtesy Global Energy Observatory.

Where India’s coal-burning power plants are. Map courtesy Global Energy Observatory.

Some of the tale is of very short-term inconvenience, such as when Mumbai went without electricity for a few hours on 02 September. The business and financial media reported that “back-up generators at banks and brokerages ensured that financial business was largely unaffected” and then circulated the familiar complain that India does not generate enough electricity to meet rapidly rising demand, that a severe shortage of coal (half our 150-odd coal burning plants are reported as having no more than a week’s supply of coal) has raised fears of more widespread blackouts.

Dire tweets from a leading industrialist, Anand Mahindra, were also reported: “Dark office in Mumbai. Lights out in the whole area. The coal crisis is beginning to literally show its dark side. A threat to the India story.” This senior member of the clutch of companies on the Bombay Stock Exchange ‘A’ List underlining a threat to the ‘India story’ led the business and financial media to quickly exert psychological duress on the NDA-BJP – “any grid collapse would cast doubt on the crisis management skills of the new government led by Prime Minister Narendra Modi”.

Electricity as fundamental right and energy convenience is moreover essential in the view of Indian industry to reaching the 8% per year GDP growth threshold, which this section appears to consider the single goal of the Republic of India. Hence where energy and the generation and provision of electricity is concerned, Goyal and his team have listed eight steps their ministry will undertake: (1) to rationalise coal supplies (by which is meant, as far as I can make out, move coal fewer kilometres to nearer power plants instead of distant ones); (2) create a statutory coal regulator; (3) civil nuclear cooperation agreement (Australia mentioned for uranium); (4) surveillance at major coal mines to control coal theft; (5) hydro-electric power generation in Jammu and Kashmir (“fast track” they say); (6) environmental clearances (“government will speed up environment and forest clearances to projects”); (7) bring more generation capacity at gas-based power online; (8) clear the solar ultra mega power plant at Sambhar near Jaipur, Rajasthan (the area is a site for migratory birds and an ecological refuge).

Had we an environment regulatory system and a project appraisal and clearances mechanism that protected environment, biodiversity, natural resources and our natural heritage, points 3, 5, 6 and 8 could under no circumstance have appeared on the Ministry of Power list. But the NDA-BJP government has in its first three months taken swift steps to eases clearances for industrial and infrastructure projects. Goyal’s colleague in the cabinet, Prakash Javadekar (minister of state for environment, forests and climate change), has worked to get the MoEF&CC to loosen the norms for expansion of coal mining projects producing up to 8 million tonnes of coal a year, and to adopt a ‘cluster approach’ in clearing smaller mines in the coal-rich belts of India. The environment ministry is also – as the Rajya Sabha was told – “streamlining environmental clearance process by delegating more powers to the State level Environment Impact Assessment Authorities (SEIAAs) for granting” such clearances, and neither house of Parliament has inquired critically as to whether the states so favoured have in place the evaluating expertise and capacities of sufficient authority and independence to not clear those projects which will harm environment, biodiversity, natural resources and our natural heritage.

Poor ambient air quality in our cities is hazardous to health, and emissions from coal-burning power plants are an important contributor to urban air pollution. This chart of a New Delhi region is courtesy Asia Air Pollution Real-time Air Quality Index (AQI).

Poor ambient air quality in our cities is hazardous to health, and emissions from coal-burning power plants are an important contributor to urban air pollution. This chart of a New Delhi region is courtesy Asia Air Pollution Real-time Air Quality Index (AQI).

While industry and a growing urban middle class expect ‘development’ and convenience, represented mainly by uninterruptible kilowatts, and exert a disproportionate amount of pressure on the state to fulfil these desires, there is a short list of steps very different from Goyal’s which must be recognised by the NDA-BJP government and state governments. This is:

(1) There is 172,986 MW of thermal power capacity (149,178 coal, 22,608 gas and 1,200 diesel), 40,798 MW of hydro-electric, 31,692 MW of renewables and 4,780 MW of nuclear, for a total of 250,257 MW. That’s on paper, whereas the actual power generation every average day (in 2014, according to the Central Electricity Authority, which is the apex power sector planning body) has been around 135,000 MW. From every power plant to every grid and to every distribution network, the aggregate transmission and commercial losses are estimated to be 26%. Judging from the trend of 2000 onwards, India’s coal consumption would have been 710 million tons in 2013 – almost twice the consumption in 2000 (359 mt) and more than three times the consumption in 1990 (224 mt).

To have allowed 26% of the generated electricity in 2013 to be ‘lost’ amounts to wasting the coal that was burned to generate it, and this is a gigantic sum, an amount equal to the 189 mt that India consumed in 1986. Secretary Pradeep Kumar Sinha, Additional Secretaries R N Choubey and Devendra Chaudhry, Joint Secretaries Mukesh Jain, B N Sharma, Pradeep Kumar, Satish Kumar and Jyoti Arora, and Economic Adviser Raj Pal must practice thrift and saving instead of entertaining industry’s demands for more power plants.

(2) India has for the last year consumed crude oil at the rate of about 3.5 million barrels a day and of this astounding amount 2.5 million barrels are imported. For 2013-14 (until 31 March) India’s appetite for crude oil cost US$ 143 billion (which represented 32% of India’s total imports for the financial year, according to the Ministry of Commerce). The standard oil barrel contains 159 litres of crude oil and, according to the Society of Petroleum Engineers, a barrel of crude oil represents about 1,700 kWh of electricity. Judging from the power consumption trend from 2000, our per capita average annual electricity consumption in 2014 will be 750-760 kWh, which is about 62 or 63 units a month.

A simple schematic for a 1,000 MW coal-burning power plant that shows the inputs and pollutants. Diagram courtesy Indian Power Sector.Com

A simple schematic for a 1,000 MW coal-burning power plant that shows the inputs and pollutants. Diagram courtesy Indian Power Sector.Com

Thus a single barrel of imported (or domestically produced) crude oil contains energy enough to supply two persons for a year, at current annual averages. Such a comparison between fuels is useful to illustrate what the country’s automobile addiction costs in terms of what it takes to furnish households with electricity. About 47% of the oil is used (after refining and being turned into various petroleum products) for transport, supporting an automobile industry that has placed 17.56 million cars, 2.01 million taxis, 3.9 million jeeps, 4.24 million light motor vehicles, 1.29 million buses, 7.37 million goods carriers, 9.42 million other vehicles (tractors, three-wheelers and so on), and 115.41 million two-wheelers, on our roads to congest our towns and cities into paralysis.

The oil import bill is Rs 872,300 crore, a number that defies the citizen’s attempts to size it (it is more than ten times the wages paid through MGNREGA (about Rs 78,106 crore) for the last three years for which 235.5 million people were provided wage employment). Goyal and his officials are therefore better advised to pay attention (together with cabinet colleague Nitin Gadkari, the minister of road transport and highways) to the 119,209 state transport buses in Bharat and India in which we travelled (economically and fairly reliably, round the clock too) some 552 million passenger kilometres.

(3) This NDA-BJP government in its first three months has blundered just as much as its predecessor government did on matters that concern every citizen: the environment, energy, the provisioning of agriculture and food, and human development. At every turn Goyal’s cabinet colleagues, and in particular Arun Jaitley, minister of finance and defence, have chanted out the tiresome refrain that India will grow, must grow, must build, must consume, must produce and so on. Their obduracy in the face of evidence to the opposite – evidence that has been available in Bharat and internationally from the time they were students, certainly – is just as tiresome. Gathering ever more citizens into the club of the urban middle class will only lead to a financial and technological trap from which there is no escape.

Coal India's share price for the last two years.

Coal India’s share price for the last two years.

One example amongst many illustrates why, quite starkly. Since 2004, the sale of room air-conditioners has grown at about 15% per year, and the industry reported sales of over 3.5 million air-conditioners in 2013. Concerned by the demand for electricity from homes and offices fitted, over the last three years, with new air-conditioners, the Bureau of Energy Efficiency (a statutory body under the Ministry of Power) set out to estimate what effect millions of new air-conditioners would have on peak electricity demand. The answer was provided by an ‘expert group on low carbon strategies for inclusive growth’ for the Planning Commission and independent analysis conducted by the Lawrence Berkeley National Laboratory (of the USA). This study found that peak electricity demand would rise by 75,000 MW to reach 150,000 MW by 2030. That is, in 15 years the peak electricity demand alone will be 60% of today’s total power generation capacity in India!

There is no financial fix and there is no technological fix for such a trend. There is no further excuse for the NDA-BJP government and for ministers like Goyal, Jaitley, Javadekar, Gadkari (and prime minister Modi) to continue to ignore the obvious. Goyal and Jaitley both need an immediate refresher in revisiting the reasons why the marginal cost curve of any action they have announced in the last three months will rise steeply. That rise will be due to a combination of activities, and the natural consequences, which will ruinously amplify the impacts of a changing climate. Bharat cannot continue to shirk the duty – of government and of citizen – of caring first for our ‘prakruti’ (what the west has recently begun to call ecological services) and instead pursuing the ‘maya’ of continuous growth.

– Rahul Goswami

Filed Under: Blogs, Reports & Comment Tagged With: Arun Jaitley, automobiles, BJP, carbon, Climate Change, climate summit, coal, consumption, ecological services, electricity, emissions, energy, energy efficiency, environment, fossil fuel, Goyal, India, Narendra Modi, Nitin Gadkari, oil, oil import, per capita units, power, Prakash Javadekar, prakruriti, UN, urja

Flood waters batter North India, Pakistan

September 7, 2014 by Climate portal editor Leave a Comment

RG_ICP_201409_Hindu_JK_4

Women and children being transported in a boat through a flooded road to a safer place during incessant rains in Srinagar. Photo: The Hindu

Four days of very heavy rain has affected districts in northern India and north-eastern Pakistan, causing damage and deaths, and leading to continuing misery in Pakistan. In Jammu and Kashmir, the death toll is 160 while in Pakistan it is 170.

Prime Minister Narendra Modi arrived in Jammu on Sunday to personally review the situation in the flood-hit state after over 160 people lost their lives in the worst floods to affect Jammu and Kashmir in 60 years.

Accumulated rainfall from 2-5 September for the north India and north-eastern Pakistan regions.

Accumulated rainfall from 2-5 September for the north India and north-eastern Pakistan regions.

Floods and landslides, due to very heavy rains, affected parts of Jammu and Kashmir while in Pakistan very heavy rains continue, causing floods in parts of Punjab and Pakistan-occupied Kashmir. Pakistan’s National Disaster Management Authority announced that “Very High to Exceptionally High Flood Level” is likely to continue in the Chenab and Jhelum along with their associated streams for the next two days.

On 4 September a bus, filled to capacity with 52 members of a wedding group, was on its way to Lam, around 120 km from Jammu city, when it was hit by surging waters of the Gambhir river. Only three people survived the accident.

The state capital of Srinagar also braced for major floods with the Jhelum, Kashmir’s main river, flowing more than 2.13 metres (seven feet) above the danger mark. Vast swathes of Srinagar remain inundated. The 300-km-long Jammu-Srinagar national highway also closed for traffic after two landslides in the Ramban district left hundreds of vehicles stranded. South Kashmir’s Anantnag and Kulgam districts are among the worst hit, with at least 50 villages under water.

A flooded ward in Srinagar. Photo: Waseem Andrabi / Hindustan Times

A flooded ward in Srinagar. Photo: Waseem Andrabi / Hindustan Times

The Indian Army has evacuated 11,000 people to safety by deploying 100 columns of troops in flood-hit areas of the state. About 2,000 people have been provided food and temporary shelter in Jammu and Kashmir. A total of 100 Army columns (each column is 75-100 troops), 13 teams of Army engineers are working in the flood-affected regions of the state. The Army’s ‘Mission Sahayata’ is rescuing people trapped in flooded villages, isolated houses and multi-storied buildings in the inundated areas all over Kashmir, with tented shelter being provided to those who have lost their homes to the floodwaters.

Torrential monsoon rains have again wreaked havoc in Pakistan’s largest province Punjab and in Pakistan-administered Kashmir since 4 September. A Pakistan Meteorological Department report given to the Indus River Commission – which looks after Indus, Jhelum and Chenab rivers – said on September 5 that around 0.9 million cusecs (cubic feet per second, equal to over 25,000 cumecs, or cubic metres per second) of additional water was flowing down the Himalayan rivers, according to Ghulam Rasul, Chief Meteorological Officer. Rasul said the floods would have a devastating impact in Kashmir, Punjab and Sindh due to lack of preparations and absence of water management strategies.

Map of the flood-affected areas from the from European Commission Humanitarian Aid department.

Map of the flood-affected areas from the from European Commission Humanitarian Aid department.

However, Sindh and Punjab are expected to face severe flooding in the coming days, the Pakistan Meteorological Department warned on Sunday. A press release issued by the Meteorological Department said that water levels in the Indus River at Sukkur and Guddu Barrage are constantly increasing, and consequently, there will be severe floods on September 13 and 14 in both provinces.

Ahmad Kamal, a spokesman for Pakistan’s National Disaster Management Authority, said at least 69 people have died in the eastern Punjab province since Thursday. He said another 48 people died in the Pakistan-occupied Kashmir and 11 died in northern Gilgit Baltistan province.

Filed Under: Latest, Monsoon 2014 Tagged With: army, Chenab, disaster, flood, India, Jammu, Jhelum, Kashmir, landslide, Pakistan, Ravi, rescue, river, Srinagar

  • « Previous Page
  • 1
  • …
  • 6
  • 7
  • 8
  • 9
  • 10
  • …
  • 110
  • Next Page »

Indiaclimate twitter

Tweets by @Indiaclimate

Notable

Between contemplation and climate

Whether or not the USA, Europe, the Western world, the industrialised Eastern world (China, Japan, South Korea, Taiwan), adhere to or not their paltry promises about being more responsible concerning the factors that lead to climate change, is of very little concern to us. We have never set any store by international agreements on climate […]

The ‘Hindu’, ignorant about weather and climate, but runs down IMD

We find objectionable the report by ‘The Hindu’ daily newspaper accusing the India Meteorological Department of scientific shortcoming (‘IMD gets its August forecast wrong’, 1 September 2016). The report claims that the IMD in June 2016 had forecast that rains for August would be more than usual but that the recorded rain was less than […]

dialogue

  • Misreading monsoon | Resources Research on Misreading monsoon
  • Satish on A tribute to the weathermen of Bharat
  • Climate portal editor on A tribute to the weathermen of Bharat
  • Climate portal editor on A tribute to the weathermen of Bharat
  • Climate portal editor on A tribute to the weathermen of Bharat

Categories

Copyright © 2025 indiaclimateportal.org.