The India Climate Observatory

Commentary, action and research on climate and development in India

  • Home
  • About
  • Monsoon 2018
  • Current
  • Bulletin
  • Contact
  • Announcements

Preparing for the Indian summer

April 1, 2016 by Climate portal editor Leave a Comment

ICP_insat_20160101

The India Meteorological Department (IMD) has issued its forecast for the 2016 hot weather season (April to June). The forecast shows that during the 2016 hot weather season, temperatures (mean, maximum and minimum) in all the sub-divisions are likely to be above normal. All the temperatures (maximum, minimum and mean) of most of the subdivisions from northwest India, Kerala from south India and Vidharbha from Central India are likely to be above normal by 1.0° C or more. Read the full forecast document here (pdf).

The season averaged maximum temperatures of coastal Andhra Pradesh, Odisha, Assam and Meghalaya, sub-Himalayan west Bengal and Sikkim, and NMMT – Nagaland, Manipur, Mizoram and Tripura – are likely to be warmer by 0.5° C and that of the remaining subdivisions are likely to warmer than normal by 0.5° to 1° C. The season averaged minimum temperatures of sub-Himalayan west Bengal and Sikkim, and NMMT are likely to be warmer than normal by <0.5° C and that of the remaining subdivisions are likely to warmer than normal by 0.5° to 1° C.

There is also a high probability (76%) of maximum temperatures in the core heat wave zone during the 2016 hot weather season to be above normal. The core heat wave zone covers the states of Punjab, Himachal Pradesh, Uttarakhand, the National Capital Territory and Delhi, Haryana, Rajasthan, Uttar Pradesh, Gujarat, Madhya Pradesh, Chhattisgarh, Bihar, Jharkhand, West Bengal, Odisha and Telengana and the meteorological sub-divisions of Marathwada, Vidharbha, Madhya Maharashtra and coastal Andhra Pradesh. This in turn suggests high probability of moderate and severe heat wave conditions in the core heat wave zone during the hot weather season.

From this season, the IMD will also provide extended range forecasts (five–day averaged forecasts for the next 15 days) of heat wave conditions over the country. This will be based on the Dynamical Extended Range Forecasting System developed by the Indian Institute of Tropical Meteorology (IITM) in Pune. The forecast will consist of the probability of occurrence of hot days, heat waves and severe heat waves for the next 15 days updated every fifth day from 1 April, 2016. The forecasts will be available on the IMD website.

Filed Under: Latest Tagged With: Bharat, heat, heat wave, hot weather, IMD, India, India Meteorological Department, summer, temperature, पृथ्‍वी विज्ञान, भारत, मौसम

March heat patterns in India

March 25, 2016 by Climate portal editor Leave a Comment

Temperature anomalies expected for March 25-31 in India

From now until the end of March 2016, the maximum temperature anomalies will be less than what has been experienced in March until the 24th.

The India Meteorological Department’s (IMD) numerical weather prediction service has however shown that maximum temperatures will still be above normal by 1 to 3 Celsius over most of central and northern India between 25 and 31 March.

We find that when read with the minimum temperature anomalies, most of peninsular, central and northern India have in March experienced an upward shift in overall temperatures by 1 to 3 Celsius. The meteorological sub-divisions of Telengana, Rayalaseema and coastal Andhra Pradesh in particular stand out for higher minimum temperatures.

Over the last week, maximum temperatures were markedly above normal (5.1° C or more) at most places over West Rajasthan; at many places over Uttarakhand and East Rajasthan; at a few places over Gujarat  and at isolated places over Madhya Pradesh; appreciably above normal (3.1°C to 5.0°C) at most places over Haryana, Chandigarh and Delhi; at many places over Punjab, rest Gujarat and West Madhya Pradesh.

Maximum temperatures were also appreciably above normal at a few places over Madhya Maharashtra and at isolated places over Marathawada, Vidarbha and Kerala; above normal (1.6°C to 3.0°C) at most places over Rayalaseema and West Uttar Pradesh; at many places over Tamil Nadu, Interior Karnataka, East Madhya Pradesh, and the north-eastern states.

Filed Under: Current, Latest Tagged With: 2016, climate, heat, India, summer, temperature

Visualising the December ice-box

January 2, 2016 by Climate portal editor 1 Comment

ICP_20160102

Between 10 and 15 December 2015, minimum temperatures all over northern India and Pakistan, in particular in the Hindu Kush and western Himalaya (including the state of Jammu and Kashmir) dropped sharply. The cold and strong north-westerly winds blowing in from the distant Central Asian region during this period of December deepened the persistent chill.

This panel of the 30-day temperature charts for 40 cities shows the sudden dip all experienced from around 10 December. Original charts are from the NOAA Center for Weather and Climate Prediction and reassembled for this panel.

This panel of the 30-day temperature charts for 40 cities shows the sudden dip all experienced from around 10 December. Original charts are from the NOAA Center for Weather and Climate Prediction and reassembled for this panel.

The cold wave was also experienced in the north-western region – including Rajasthan, Gujarat and adjacent north Maharashtra as far south as Mumbai. From 10 December until 27 and 28 December, unusually cold conditions gripped entire agro-ecological regions – the north Gujarat plain together with the Kathiawad peninsula, the Aravalli ranges and the east Rajasthan uplands, the Ganga-Yamuna Doab, Rohilkhand and the Avadah plain, the Madhya Bharat plateau and the Bundelkhand uplands, and the Central (or Malwa) highlands.

These 30-day temperature charts shows the sudden dip in minimum for 40 cities from 9 and 10 December, and the setting in of cold conditions which continued for two weeks thereafter. During this time, the higher reaches of Kashmir Valley received snowfall, New Delhi recorded minimums of around 5 Celsius with the maximums being two to three degrees below normal, Amritsar in Punjab was at 2 Celsius while Ludhiana and Patiala recorded between 4 and 6 Celsius. Churu in Rajasthan recorded a low of 3 Celsius and Mt Abu, at an altitude of 1,200 metres was just below 0 Celsius. State capital Jaipur recorded a minimum 6 Celsius.

Filed Under: Latest Tagged With: cold wave, Delhi, Gujarat, Himalaya, Hindu Kush, India, Pakistan, Punjab, Rajasthan, winter

The 1 degree mark we’ll recall 2015 for

November 27, 2015 by Climate portal editor Leave a Comment

ICP_WMO_20151127

The global average surface temperature in 2015 is likely to be the warmest on record and to reach the symbolic and significant milestone of 1° Celsius above the pre-industrial era. This is due to a combination of a strong El Niño and human-induced global warming, according to the World Meteorological Organization (WMO).

The years 2011-2015 have been the warmest five-year period on record, with many extreme weather events – especially heatwaves – influenced by climate change, according to a WMO five-year analysis. Levels of greenhouse gases in the atmosphere reached new highs and in the Northern hemisphere spring 2015 the three-month global average concentration of CO2 crossed the 400 parts per million barrier for the first time. 2015 is likely to be the hottest year on record, with ocean surface temperatures at the highest level since measurements began.  It is probable that the 1°C Celsius threshold will be crossed, said the WMO.

Greenhouse gas emissions, which are causing climate change, can be controlled. We have the knowledge and the tools to act. We have a choice. Future generations will not. Added to that, we are witnessing a powerful El Niño event, which is still gaining in strength. This is influencing weather patterns in many parts of the world and fuelled an exceptionally warm October. The overall warming impact of this El Niño is expected to continue into 2016.

Global annual average temperatures anomalies (relative to 1961-1990) based on an average of three global temperature data sets (HadCRUT.4.4.0.0, GISTEMP and NOAAGlobalTemp) from 1950 to 2014. The 2015 average is based on data from January to October. Bars are coloured according to whether the year was classified as an El Niño year (red), a La Niña year (blue) or an ENSO-neutral year (grey).Note uncertainty ranges are not shown, but are around 0.1°C. Chart: WMO

Global annual average temperatures anomalies (relative to 1961-1990) based on an average of three global temperature data sets (HadCRUT.4.4.0.0, GISTEMP and NOAAGlobalTemp) from 1950 to 2014. The 2015 average is based on data from January to October. Bars are coloured according to whether the year was classified as an El Niño year (red), a La Niña year (blue) or an ENSO-neutral year (grey).Note uncertainty ranges are not shown, but are around 0.1°C. Chart: WMO

WMO issued its provisional statement on the status of the climate in 2015, and an additional five-year analysis for 2011-2015, to inform negotiations at the U.N. Climate Change Conference in Paris. A preliminary estimate based on data from January to October shows that the global average surface temperature for 2015 so far was around 0.73 °C above the 1961-1990 average of 14.0°C and approximately 1°C above the pre-industrial 1880-1899 period.

This temperature tendency indicates that 2015 will very likely be the warmest year on record. The global average sea-surface temperature, which set a record last year, is likely to equal or surpass that record in 2015. The global average temperatures over land areas only from January to October suggest that 2015 is also set to be one of the warmest years on record over land. South America is having its hottest year on record, as is Asia (similar to 2007), and Africa and Europe their second hottest.

According to preliminary figures as of the end of September 2015, 2011-15 was the world’s warmest five-year period on record, at about 0.57°C (1.01°F) above the average for the standard 1961-90 reference period. It was the warmest five-year period on record for Asia, Europe, South America and Oceania, and for North America. WMO compiled the five-year analysis because it provides a longer-term climate signal than the annual report.

Filed Under: Latest Tagged With: Climate Change, CO2, conference, COP21, El Nino, global warming, greenhouse gas, meteorological, ppm, temperature, WMO

Fair shares and the INDCs

November 12, 2015 by Climate portal editor Leave a Comment

ICP_CSO_INDCs_report

The initial climate action pledges made by countries, and submitted to the UN Framework Convention on Climate Change (UNFCCC), called Intended Nationally Determined Contributions (INDCs), have been analysed and reviewed by a group of 17 international civil society organisations. These findings have been released in a report, ‘Fair Shares: A Civil Society Equity Review of INDCs’.

INDCs refer to Intended Nationally Determined Contributions, the official name of the UNFCCC for the climate targets and actions which a majority of countries submitted on or before October 1, the deadline set by the UNFCCC. They are commonly referred to as “national climate targets/actions” or “pledges”. They are referred to as the initial offers of countries in terms of responding to climate change, and as the building blocks of the new global climate agreement, which is set to be finalized at the upcoming Paris climate conference. The current INDCs will be implemented from 2020 to 2025 or 2030.

The assessment includes INDCs covering 145 countries and some 80 percent of current global emissions. This review is different because it uses not only a science-based assessment of the necessary global level of climate action, but also uses widely accepted notions of equity to present fair shares of the necessary effort for each country. The equity and fair shares standards are anchored on the UNFCCC’s core principles of “common but differentiated responsibilities and respective capabilities” and the “right to sustainable development”. The equity and fair shares standards used in this review take into account a range of interpretations of these principles. The group of international civil society organisations has said that the principles of equity and fair shares can be defined and quantified robustly, rigorously, transparently and scientifically, while accounting for differences of perspectives.

This review has said: “All countries should undertake their fair share of the global effort to tackle climate change. Each country’s fair share is based on its historical responsibility and capacity. Some countries have already emitted a great deal for a long time, contributing to warming that is happening already, and they thrive from the infrastructure and institutions they have been able to set up because of this. Some countries have much higher capacity to act than others, due to their higher income and wealth, level of development and access to technologies.”

This review is important because if the INDCs are not reviewed using a global carbon budget based on the science and widely held notions of equity, we will not be able to determine if each country committed its fair share of climate action. Equity and fairness are vital to unlocking cooperation, because – as the IPCC concluded in its most recent report – agreements that are seen to be fair are more likely to actually work. We will also not know if they are enough collectively to stave off dangerous global warming. The review sets a basis to demand higher ambition from each countries in Paris and beyond.

The review shows that the INDC commitments will likely lead the world to a devastating 3°C or more warming above pre-industrial levels. The current INDCs amount to barely half of the emissions cuts required by 2030.

Moreover, the INDCs submitted by all major developed countries fall well short of their fair shares. From the list of countries highlighted in the report, Russia’s INDC represents zero contribution towards committing its fair share. Japan’s represents about a tenth, the United States’ about a fifth, and the European Union’s just over a fifth of its fair share.

Most developed countries have fair shares that are already too large to fulfill exclusively within their borders, which is why there is a need for them to provide additional resources for developing countries to do more than their fair share, particularly through finance, technology, and capacity-building. However, there remains a striking lack of clear financial commitments from developed countries.

On the other hand, the majority of developing countries’ mitigation pledges exceed or broadly meet their fair share, including Kenya, the Marshall Islands, China, Indonesia, and India. Brazil’s INDC represents slightly more than two thirds of its fair share.

The question is: can developing countries with the largest rising emissions, such as China and Indonesia, now sit back because they have met their fair share? While the report clearly shows that the onus is on developed countries to commit more emissions cuts and financing, by no means does it give a free pass to developing countries. Our primary call is for each country – developing and developed – to do all it can in terms of climate action, working even to surpass its fair share.

What must therefore be done to close the emissions gap? The Paris COP21 agreement must ensure that domestic commitments and global targets alike are set in accordance with science and equity. It must also include a strong mechanism to increase the ambition of INDCs before their implementation in 2020, and every five years thereafter. Developed countries must make substantial new commitments to finance mitigation, adaptation, and loss and damage in developing countries for a fully equitable climate agreement. Finally, countries must scale up action for sustainable energy transformation.

[The group: ActionAid International, Asian Peoples’ Movement on Debt and Development, Climate Action Network South Asia, CARE International, Center for International Environmental Law, Christian Aid, CIDSE, Climate Action Network Latin America, Friends of the Earth International, International Trade Union Confederation, LDC Watch International, Oxfam, Pan African Climate Justice Alliance, SUSWATCH Latin America, Third World Network, What Next Forum, and WWF International. The Climate Equity Reference Project, an initiative of EcoEquity and the Stockholm Environment Institute, provided analytical support. It is also supported by numerous social movements, networks, and other civil society groups in the international, regional, and national levels.]

Filed Under: Reports & Comment Tagged With: carbon budget, China, climate agreement, Climate Change, climate conference, COP21, development, emissions, equity, Europe, INDC, India, Russia, UNFCCC, USA

Join a climate chat with the minister

October 25, 2015 by Climate portal editor Leave a Comment

ICP_mygov_201510

MyGov.in which is the citizen-centric platform that connects people with the Government of India is holding a MyGov Talk event with Prakash Javadekar, Minister for Environment, Forest and Climate Change on 26 October at 5 pm.

This is a part of the preparations the central government and the Ministry of Environment are making as the Conference of Parties (COP) 21 meeting draws nearer (30 November to 11 December). The MyGov Talk is intended to seek the views and suggestions of citizens on the proposals contained in the Intended Nationally Determined Contribution (INDC) plan submitted to the UNFCCC by India.

With India’s Intended Nationally Determined Contribution (INDC), the country is keen to attempt to work towards a low carbon emission pathway, while simultaneously endeavouring to meet all the developmental challenges that it faces today. The INDC aims at promoting clean energy, especially renewable energy, enhancement of energy efficiency, development of less carbon intensive and resilient urban centres, promotion of waste to wealth, safe, smart and sustainable green transportation network, abatement of pollution and India’s efforts to enhance carbon sink through creation of forest and tree cover.

Climate Change experts, senior journalists and social media influencers will join the online panel discussion with Javadekar.  Citizens are invited to share their ideas, questions and inputs on India’s role in COP 21 and on the following proposals laid down by Intended Nationally Determined Contribution (INDC):

Sustainable Lifestyles
Cleaner Economic Development
Reduce Emission intensity of Gross Domestic Product (GDP)
Increase the Share of Non-Fossil Fuel Based Electricity
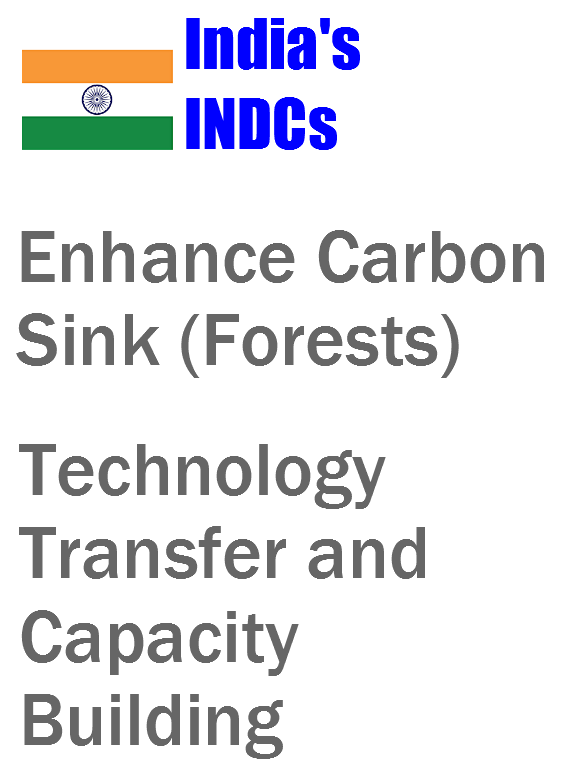
Enhancing Carbon Sink (Forests)
Adaptation
Mobilising Finance
Technology Transfer and Capacity Building

Selected ideas and names would also be mentioned by the minister and other experts during the MyGov Talk. Also see ‘India spells out a climate action plan’.

Filed Under: Announcements, Current Tagged With: carbon, Climate Change, COP21, emissions, INDC, India, Javadekar, renewable energy, UNFCCC

From space, a district and its water

October 9, 2015 by Climate portal editor 3 Comments

RG_ICP_water_district_map_201510

In this panel of maps the relationship between the district of Parbhani (in the Marathwada region of Maharashtra) and water is graphically depicted over time. The blue squares are water bodies, as seen by a satellite equipped to do so. The intensity of the blue colour denotes how much water is standing in that coloured square by volume – the deeper the blue, the more the water.

Water bodies consist of all surface water bodies and these are: reservoirs, irrigation tanks, lakes, ponds, and rivers or streams. There will be variation in the spatial dimensions of these water bodies depending on how much rainfall the district has recorded, and how the collected water has been used during the season and year. In addition to these surface water bodies, there are other areas representing water surface that may appear, such as due to flood inundations, depressions in flood plains, standing water in rice crop areas during transplantation stages. Other than medium and large reservoirs, these water features are treated as seasonal and some may exist for only a few weeks.

RG_ICP_water_district_map_201510_section

Click for a section of the full size image. The detail can be mapped to panchayat level.

The importance of monitoring water collection and use at this scale can be illustrated through a very brief outline of Parbhani. The district has 830 inhabited villages distributed through nine tehsils that together occupy 6,214 square kilometres, eight towns, 359,784 households in which a population of 1.83 million live (1.26 rural and 0.56 million urban). This population includes 317,000 agricultural labourers and 295,000 cultivators – thus water use and rainfall is of very great importance for this district, and indeed for the many like it all over India.

This water bodies map for Parbhani district is composed of 18 panels that are identical spatially – that is, centred on the district – and display the chronological progression of water accumulation or withdrawal. Each panel is a 15-day period, and the series of mapped fortnights begins on 1 January 2015.

The panels tell us that there are periods before the typical monsoon season (1 June to 30 September) when the accumulation of water in surface water bodies has been more than those 15-day periods found during the monsoon season. See in particular the first and second fortnights of March, and the first fortnight of April.

During the monsoon months, it is only the two fortnights of June in which the accumulation of water in the surface water bodies of Parbhani district can be seen. The first half of July and the second half of August in particular have been recorded as relatively dry.

This small demonstration of the value of such information, provided at no cost and placed in the public domain, is based on the programme ‘Satellite derived Information on Water Bodies Area (WBA) and Water Bodies Fraction (WBF)’ which is provided by the National Remote Sensing Centre (NRSC), Indian Space Research Organisation (ISRO), Department of Space, Government of India.

For any of our districts, such continuous monitoring is an invaluable aid to: facilitate the study of water surface dynamics in river basins and watersheds; analyse the relationships between regional rainfall scenarios and the collection and utilisation of water in major, medium reservoirs and irrigation tanks and ponds; inventory, map and administer the use of surface water area at frequent intervals, especially during the crop calendar applicable to district and agro-ecological zones.

Filed Under: Blogs, Monsoon 2015 Tagged With: agriculture, district, ISRO, Maharashtra, monsoon, NRSC, rain, remote sensing, reservoir, river, rural, space, town, urban, village, water

India spells out a climate action plan

October 7, 2015 by Climate portal editor Leave a Comment

flag_india_INDC

We present here the summary of India’s Intended Nationally Determined Contributions (INDCs) which have been submitted to the UN Climate Change Convention (the UNFCCC). This summary has been released by the Press Information Bureau, Ministry of Information and Broadcasting. Our analysis of and commentary on India’s INDCs will follow in separate articles.

quote-open4The Government of India has said that the country’s Intended Nationally Determined Contributions (INDCs) are balanced and comprehensive.  In official statements, the government said that INDCs include reductions in the emissions intensity of its GDP by 33 to 35 per cent by 2030 from 2005 level and to create an additional carbon sink of 2.5 to 3 billion tonnes of CO2 equivalent through additional forest and tree cover by 2030.  India has also decided to anchor a global solar alliance, INSPA (International Agency for Solar Policy & Application), of all countries located in between Tropic of Cancer and Tropic of Capricorn.

quote-open2The INDCs centre around India’s policies and programmes on promotion of clean energy, especially renewable energy, enhancement of energy efficiency, development of less carbon intensive and resilient urban centres, promotion of waste to wealth, safe, smart and sustainable green transportation network, abatement of pollution and India’s efforts to enhance carbon sink through creation of forest and tree cover.  It also captures citizens and private sector contribution to combating climate change.

quote-open5India_INDCs1The INDCs outline the post-2020 climate actions they intend to take under a new international agreement.  The INDCs document is prepared with a view to taking forward the Prime Minister’s vision of a sustainable lifestyle and climate justice to protect the poor and vulnerable from adverse impacts of climate change. Ministry of Environment, Forest and Climate Change adopted an inclusive process for preparation of India’s INDCs. It held stakeholder consultations with the specific involvement of the key Ministries and State Governments.  Interactions were also held with civil society organisations, thinktanks and technical & academic institutions of eminence. The Ministry had commissioned Greenhouse Gas (GHG) modeling studies for projections of GHG emissions till 2050 with a decadal gap. The gist of all these consultations & studies were taken on board before submitting India’s INDCs. The government  zeroed-in on a set of contributions which are comprehensive, balanced, equitable and pragmatic and addresses all the elements including Adaptation, Mitigation, Finance, Technology Transfer, Capacity Building and Transparency in Action and Support.

quote-open1Planned actions and economic reforms have contributed positively to the rapidly declining growth rate of energy intensity in India. The Government of India, through its various institutions and resources, has taken steps to decouple the Indian energy system from carbon in the long run. Despite facing enormous development challenges like poverty eradication, ensuring housing, electricity and food security for all, India declared a voluntary goal of reducing the emissions intensity of its GDP by 20–25%, over 2005 levels by 2020, despite having no binding mitigation obligations as per the Convention.  A slew of policy measures to promote low carbon strategies and Renewable Energy have resulted in the decline of emission intensity of our GDP by 12% between 2005 and 2010. It is a matter of satisfaction that United Nations Environment Programme (UNEP) in its Emission Gap Report 2014 has recognized India as one of the countries on course to achieving its voluntary goal.

quote-open6India has adopted several ambitious measures for clean and renewable energy, energy efficiency in various sectors of industries, achieving lower emission intensity in the automobile and transport sector, non-fossil based electricity generation and building sector based on energy conservation. Thrust on renewable energy, promotion of clean energy, enhancing energy efficiency, developing climate resilient urban centres and sustainable green transportation network are some of the measures for achieving this goal.

quote-open3Solar power in India is poised to grow significantly with Solar Mission as a major initiative of the Government of India. A scheme for development of 25 Solar Parks, Ultra Mega Solar Power Projects, canal top solar projects and one hundred thousand solar pumps for farmers is at different stages of implementation.  The Government’s goal of ‘Electricity for All’ is sought to be achieved by the above programs that would require huge investments, infusion of new technology, availability of nuclear fuel and international support.

quote-open4India_INDCs2The energy efficiency of thermal power plants will be systematically and statutorily improved. Over one million medium and small enterprises will be involved in the Zero Defect Zero Effect Scheme to improve their quality, energy efficiency, enhance resource efficiency, pollution control, waste management and use of renewable energy.
quote-open2Urban transport policy will encourage moving people rather than vehicles with a major focus on Mass Rapid Transit Systems. In addition to 236 km of metro rail in place, about 1150 km metro projects for cities including Pune, Ahmedabad and Lucknow are being planned. Delhi Metro, which has become India’s first MRTS project to earn carbon credits, has the potential to reduce about 0.57 million tonnes of CO2 e annually. The switch from Bharat Stage IV (BS IV) to Bharat Stage V (BS V) and Bharat Stage VI (BS VI) to improve fuel standards across the country is also planned for the near future.

quote-open5Renewable energy sources are a strategic national resource. Harnessing these sources will put India on the path to a cleaner environment, energy independence and, a stronger economy. The renewable energy technologies contribute to better air quality, reduce reliance on fossil fuels, curb global warming, add jobs to the economy and, protect environmental values such as habitat and water quality.  Over the years India has successfully created a positive outlook necessary to promote investment in, demand for, and supply of, renewable energy. India’s strategy on renewable energy is driven by the objectives of energy security, energy access and also reducing the carbon footprints of the national energy systems. It has evolved over the years through increasingly stronger commitment at federal level.

quote-open1The institutional arrangement for offtake of renewable energy power will be further strengthened by Renewable Purchase Obligations and Renewable Generation Obligations. India’s share of non-fossil fuel in the total installed capacity is projected to change from 30% in 2015 to about 40 % by 2030.  India is running one of the largest renewable capacity expansion programmes in the world. Between 2002 and 2015, the share of renewable grid capacity has increased over 6 times, from 2% (3.9 GW) to around 13% (36 GW) from a mix of sources including Wind Power, Small Hydro Power, Biomass Power / Cogeneration, Waste to Power and Solar Power. On normative terms the CO2 emission abatement achieved from the renewable power installed capacity was 84.92 million tons CO2 eq. /year as of 30 June 2015.

quote-open6To accelerate development and deployment of renewable energy in the country, the Government is taking a number of initiatives like up-scaling of targets for renewable energy capacity addition from 30GW by 2016-17 to 175 GW by 2021-22.The renewable power target of 175 GW by 2022 will result in abatement of 326.22 million tons of CO2 eq. /year.  The ambitious solar expansion programme seeks to enhance the capacity to 100 GW by 2022, which is expected to be scaled up further thereafter. Efforts will include scaling up efforts to increase the share of non-fossil fuel based energy resources in total electricity mix including wind power, solar, hydropower, biomass, waste to energy and nuclear power.

quote-open3India_INDCs3The range of ecosystem goods and services provided by forests include carbon sequestration and storage. Despite the significant opportunity costs, India is one of the few countries where forest and tree cover has increased in recent years and the total forest and tree cover amounts to 24% percent of the geographical area of the country. Over the past two decades progressive national forestry legislations and policies of India have transformed India’s forests into a net sink of CO2. With its focus on sustainable forest management, afforestation and regulating diversion of forest land for non-forest purpose, India plans to increase its carbon stock. Government of India’s long term goal is to increase its forest cover through a planned afforestation drive which includes number of programmes and initiatives like Green India Mission, green highways policy, financial incentive for forests, plantation along rivers, REDD-Plus & Other Policies and Compensatory Afforestation Fund Management and Planning Authority
quote-open4For the first time devolution of funds to states from the federal pool will be based on a formula that attaches 7.5 % weight to the area under forest. It takes into account the changing realities in order to rebalance the fiscal system of the country in a way that will incentivize greener distribution of resources. This initiative will give afforestation a massive boost by conditioning about USD 6.9 billion of transfers to the states based on their forest cover, which is projected to increase up to USD 12 billion by 2019-20.

quote-open2For India, adaptation is inevitable and an imperative for the development process. India is facing climate change as a real issue, which is impacting some of its key sectors like agriculture and water. The adverse impacts of climate change on the developmental prospects of the country are further amplified enormously by the existence of widespread poverty and dependence of a large proportion of the population on climate sensitive sectors for livelihood. It is of immediate importance and requires action now.

quote-open5In the INDCs,  the country has focused on adaptation efforts, including: a) developing sustainable habitats; b) optimizing water use efficiency; c) creating ecologically sustainable climate resilient agricultural production systems; d) safeguarding the Himalayan glaciers and mountain ecosystem; and, e) enhancing carbon sinks in sustainably managed forests and implementing adaptation measures for vulnerable species, forest-dependent communities and ecosystems. India has also set up a National Adaptation Fund with an initial allocation of INR 3,500 million (USD 55.6 million) to combat the adaptation needs in key sectors.  This fund will assist national and state level activities to meet the cost of adaptation measures in areas that are particularly vulnerable to the adverse effects of climate change.

quote-open1India’s climate actions have so far been largely financed from domestic resources. India already has ambitious climate action plans in place.  Preliminary domestic requirements to implement national climate plans add upto more than USD 2.5 trillion between 2015 and 2030.Substantial scaling up these plans would require greater resources. Developing countries like India are resource constrained and are already spending enormous amounts on climate change, . Implementing climate change mitigation and adaptation actions would require domestic and new & additional funds from developed countries in view of the resource required and the resource gap.

quote-open6Urgent efforts to reduce GHG emissions need to take place against the backdrop of a growing energy demand and urbanisation in India. With the responsibility of lifting around 360 million people out of poverty and raising the standard of living of an even greater number of people, technology is the only powerful solution for countries like India that can simultaneously address climate change and development needs. Technology development and transfer and capacity-building are key to ensuring adequate development and deployment of clean-technologies. The technology gap between rich and poor countries remains enormous and the capacity of developing economies to adopt new technology needs to be enhanced.  Enhanced action on technology development and transfer will be central in enabling the full and effective implementation of India’s INDCs. Developed countries should be supportive and help in transfer of technology, remove barriers, create facilitative IPR regime, provide finance, capacity building support and create a global framework for Research & Development on clean coal and other technologies.”

Filed Under: Latest Tagged With: climate, Climate Change, COP, development, emission, GDP, GHG, INDC, India, low carbon, UNFCCC

Where they waited for rain in 2015

September 18, 2015 by Climate portal editor 1 Comment

RG_ICP_20150918

With two weeks of the June to September monsoon remaining in 2015, one of the end-of-season conclusions that the India Meteorological Department (IMD) has spoken of is that four out of ten districts in the country has had less rainfall than normal.

This overview is by itself alarming, but does not aid state governments and especially line ministries plan for coming months, particularly for agriculture and cultivation needs, water use, the mobilisation of resources for contingency measures, and to review the short- and medium-term objectives of development programmes.

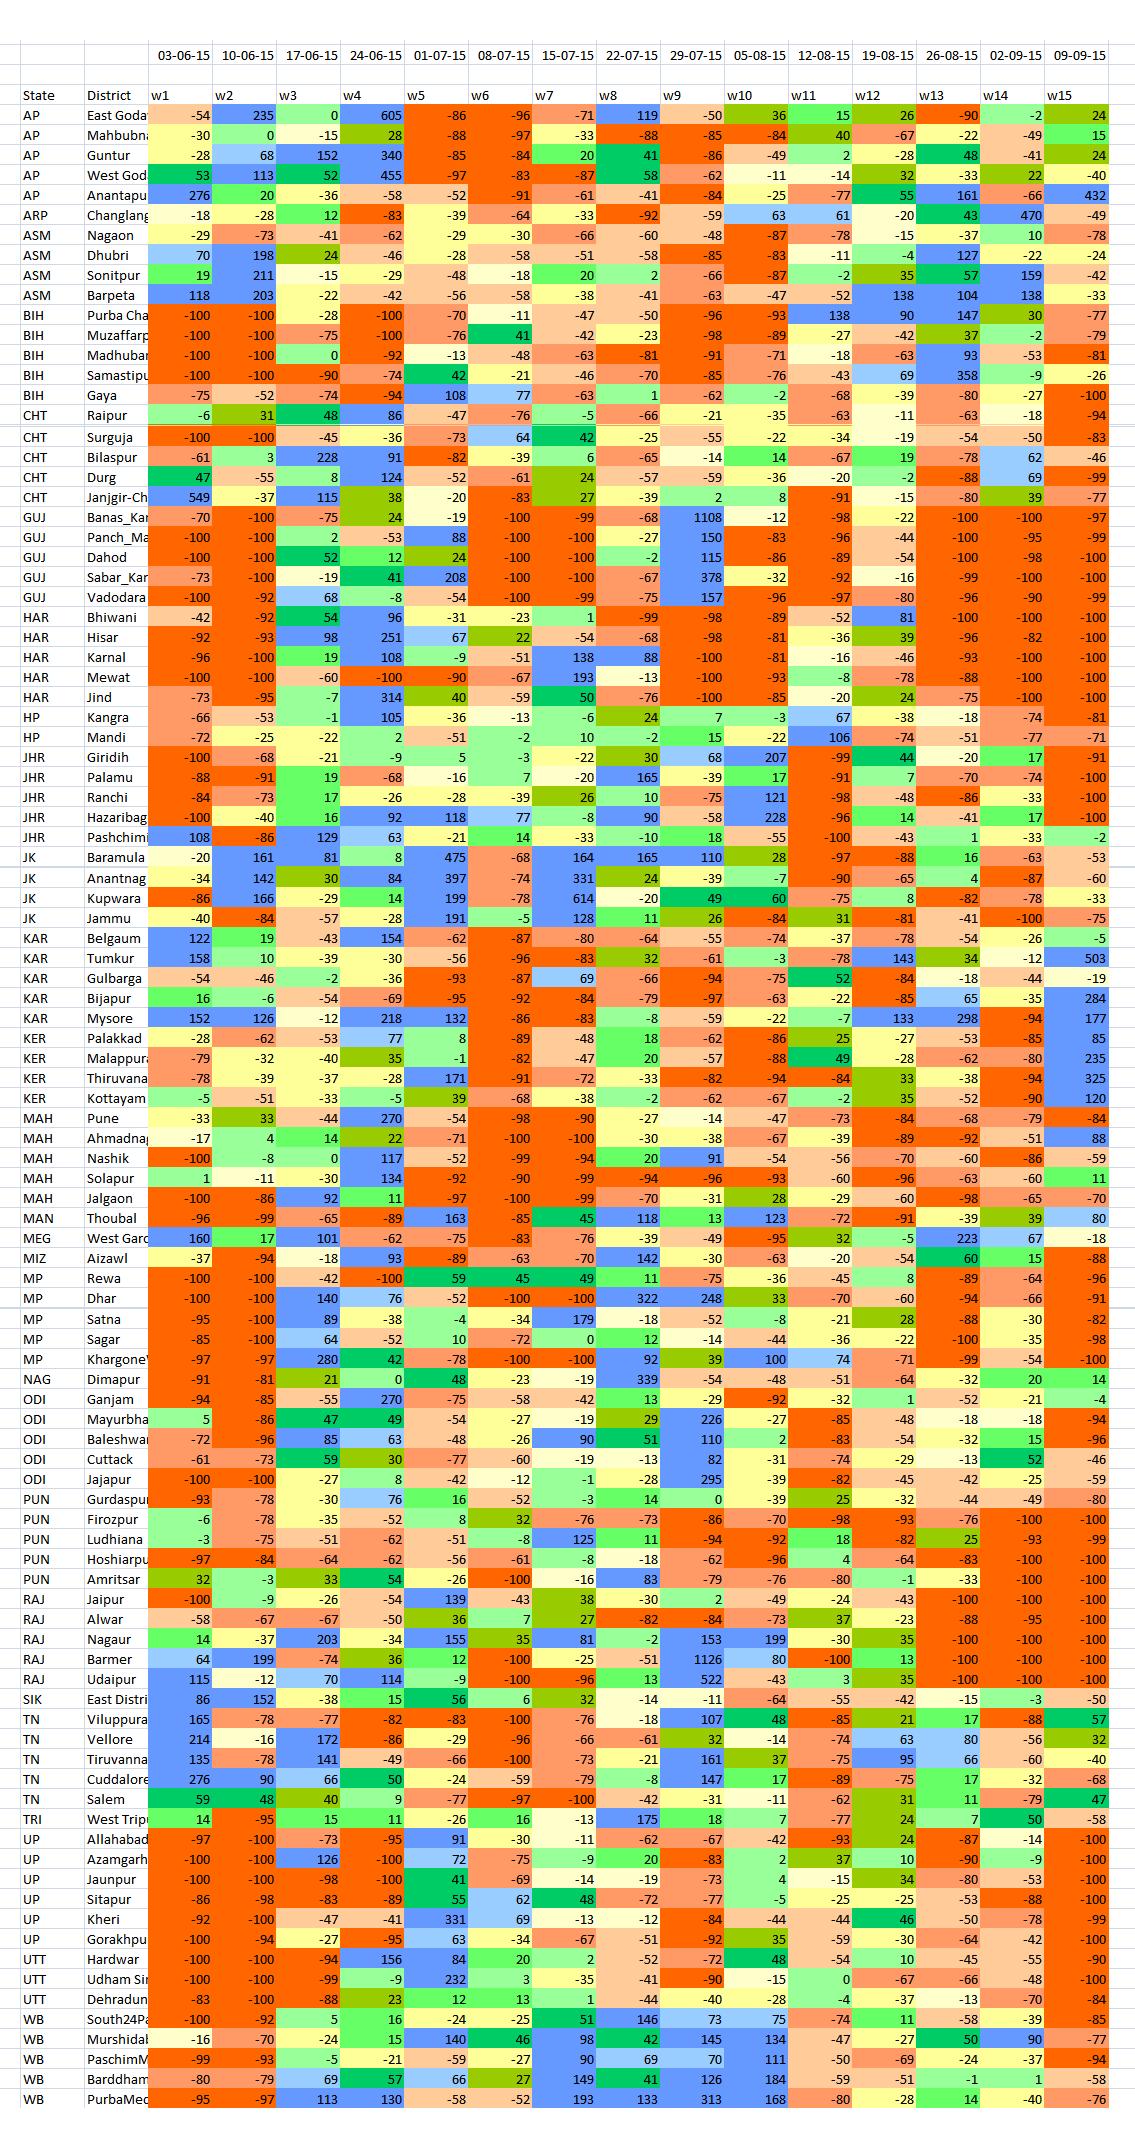
RG_ICP_100districts_table_20150918The detailed tabulation provided here is meant to provide guidance of where this may be done immediately – in the next two to four weeks – and how this can be done in future.

The table lists 100 districts each of which have readings 15 weeks of rainfall variation – the numbers are not rainfall in millimetres (mm) but the variation in per cent from the long-term normal for that district for that week. The colour codes for each district’s week cell are the same as those used for the new 11-grade rainfall categorisation.

The districts are chosen on the basis of the size of their rural populations (calculated for 2015). Thus Purba Champaran in Bihar, Bhiwani in Haryana, Rewa in Madhya Pradesh and Viluppuram in Tamil Nadu are the districts in those states with the largest rural populations.

In this way, the effect of rainfall variability, from Week 1 (which ended on 3 June) to Week 15 (which ended on 9 September), in the districts with the largest rural populations can be analysed. Because a large rural population is also a large agricultural population, the overall seasonal impact on that district’s agricultural output can also be inferred.

The distribution of the districts is: six from Uttar Pradesh; five each from Andhra Pradesh, Bihar, Chhattisgarh, Gujarat, Haryana, Jharkhand, Karnataka, Maharashtra, Madhya Pradesh, Odisha, Punjab, Rajasthan, Tamil Nadu and West Bengal; four each from Assam, Jammu and Kashmir, and Kerala; three from Uttarakhand; two from Himachal Pradesh; one each from Arunachal Pradesh, Manipur, Meghalaya, Mizoram, Nagaland, Sikkim and Tripura.

Using the new 11-grade rainfall categorisation, a normal rainweek is one in which the rainfall is between +10% more and -10% less for that week. The overview for this group of 100 districts, only 11 have had five or more normal weeks of rain out of 15 weeks. In alarming contrast, there are 77 districts which have had three or fewer normal weeks of rain – that is, more than three-fourths of these most populous districts. Half the number (51 districts) have had two, one or no normal weeks of rain. And 22 of these districts have had only one or no normal weeks of rain.

From this group of 100 most populous (rural population) districts Gorakhpur in Uttar Pradesh and Nagaon in Assam have had the most deficit rainweeks, tallying 13, out of the 15 tabulated so far. There are ten districts which have had 12 deficit rainweeks out of 15 and they are (in decreasing order of rural population): Muzaffarpur (Bihar), Pune and Jalgaon (Maharashtra), Surguja (Chhattisgarh), Panch Mahals and Vadodara (Gujarat), Firozpur (Punjab), Thiruvananthapuram (Kerala), Hoshiarpur (Punjab) and Mewat (Haryana).

– Rahul Goswami

Filed Under: Monsoon 2015, Reports & Comment Tagged With: agriculture, district, IMD, India, monsoon, population, rain, rural, urban, water

Lessons of monsoon 2015 for district India

September 16, 2015 by Climate portal editor 2 Comments

ICP_rainweek_commentary_20150916

By our conventional method of reckoning the adequacy of the 2015 monsoon, this is a year that is amongst the most deficient in rain over a period of 20 years. The monsoon season began late, compared with its usual onset, and apart from a few sustained heavy spells in a few locations, has been less than adequate and also less than normal in every one of our 36 meteorological sub-divisions.

When after eight weeks of the conventional monsoon season it became evident that a combination of factors was causing weak and erratic rainfall, that is when the central and state governments needed to place on alert the regions that were already facing rainfall deficits. At this point, when we have the evidence provided by data for 15 weeks of the monsoon season (until 9 September), every week from early August onwards that passed without such a declaration is a week of preparation and coping lost.

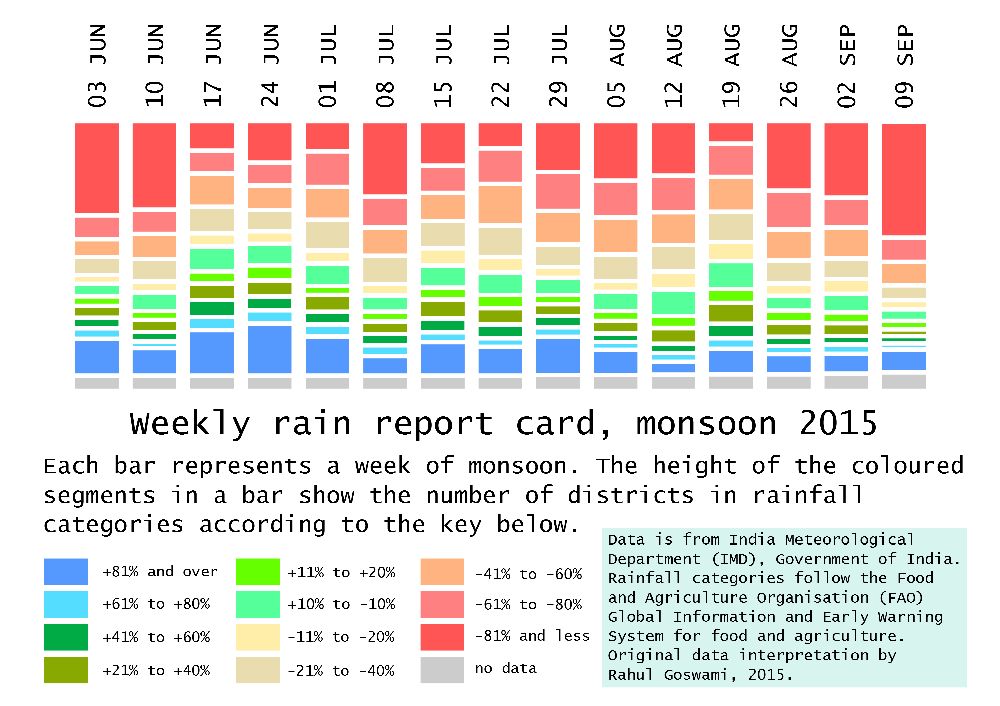
In this commentary, I have described the advantages of using a new methodology that grades rainfall adequacy at the level of the district, to a degree that is very much finer than the five categories of the India Meteorological Department (IMD), which are: normal, excess, deficient, scanty and no rain. The outputs from this methodology (illustrated and described here) are designed to: (1) alert national food and agriculture administrators to impending food insecurity conditions; (2) alert national water resources administrators to impending water scarcities; (3) alert line departments of state ministries and district collectorates to the build up of climatological distress at the district level so that contingency measures can be taken.

RG_2015_rainweek_graphic3Over the conventional season (1 June to 30 September) the inadequacy of rainfall in 2015 is revealed at a glance by the weekly rain report. It makes for a very alarming picture and shows that state administrations and especially district authorities should, by the sixth week which ended on 8 July, have made arrangements to prepare for below-normal rains. In the weekly rain report, each vertical bar corresponds to a week of districts categorised into eleven grades. This provides a weekly national barometer of the number of districts that are in the lower and upper (severely below and above normal rainfall) categories during a given week.

Such a weekly rainfall adequacy report is able to quickly put a stop to the recent tendency of administrations, the media and all those who must manage natural resources (particularly our farmers), to think in terms of an overall seasonal ‘deficit’ or an overall seasonal ‘surplus’. This ‘seasonal’ view must be abandoned because demands for water are not cumulative – they are made several times a day, and become more or less intense according to a cropping calendar, which in turn is influenced by the characteristics of a river basin and of a corresponding agro-ecological zone, and the rural and urban populations in a district.

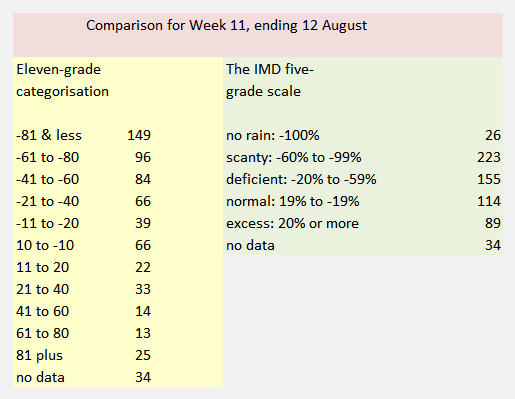
The difference between the IMD five-grade assessment and the eleven-grade categorisation of rainfall becomes immediately apparent when a comparison is made for any given week. The data source is the same – the weekly tabulation compiled by the IMD’s Hydromet Division (which from this monsoon season provides the data sheets and detailed maps on its ‘customised rainfall information system’, or CRIS, website).

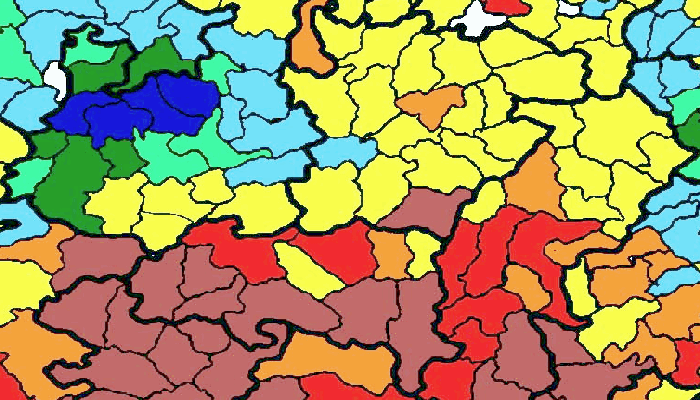
RG_ICP_grade_systems_comparedWeek 11 of the monsoon season, which is the week until 12 August, provides such an example. Under the five-grade IMD scale, there were 114 districts with normal rain (from -19% to +19%). Under the 11-grade new categorisation, the middle grade is -10% to +10%, and included 66 districts. Under the five-grade IMD scale districts with below normal rainfall fall under deficient (-20% to -59%) or under scanty (-60% to -99%) and for this week the number of districts respectively were 155 and 223. Under the 11-grade new categorisation, there are four grades for below-normal rainfall that is -20%.

Thus while the ‘deficient’ grade includes 155 districts, under the 11-grade system there are 150 districts distributed between two grades – 84 and 66, but we see that a larger number of districts fall in the more severe of the two grades. The signal to be derived from this, at the state and districts administration level, is that if a district remains for two to three weeks at a grade, then contingency measures must be reviewed, readied or rolled out. This is a decision that becomes considerably easier with the 11-grade system when compared with the existing five-grade system.

In the same way, the week by week tabulation of districts under the 11-grade system reveals trends and patterns that are not visible under the existing IMD five-grade assessment. The table shows the distribution of districts by grade across weeks. In each week, the two grades that account for the largest number of districts are highlighted red. We see that for the the first five rain weeks – week ending 3 June to week ending 1 July – the +81% and above grade was one of the top two populated grades. This occurred once more for Week 7, ending 15 July. For the next eight rain weeks – ending 22 July to ending 9 September – the top two populated grades have been in the rainfall grades of -41% to -60%, -61% to -80% and -81% and less. At the country level, this starkly underlines the seriousness of the rainfall deficit.

RG_ICP_weekly_tableThe uses to which we have put available climatic observations no longer suit an India which is learning to identify the impacts of climate change. Until 2002, the monsoon season was June to September, there was an assessment in May of how well (or not) the monsoon could turn out.

The India Meteorology Department has added computational and analytical resources furiously over the last decade. The new research and observational depth is complemented by the efforts of a Ministry of Earth Sciences which has channelled the copious output from our weather satellites, under the Indian Space Research Organisation (ISRO), and which is interpreted by the National Remote Sensing Centre (NRSC), to serve meteorological needs.

The IMD, with 559 surface observatories, 100 Insat satellite-based data collection platforms, an ‘integrated agro-advisory service of India’ which has provided district-level forecasts since 2008, a High Performance Computing System commissioned in 2010 (whose servers run at Pune, Kolkata, Chennai, Mumbai, Guwahati, Nagpur, Ahmedabad, Bengaluru, Chandigarh, Bhubaneswar, Hyderabad and New Delhi) intelligently consumes an astonishing amount of numerical data every hour.

Over the last four years, more climate and weather ‘products’ (as the IMD system calls them) based on this data and their interpretations have been released via the internet into the public domain. These are reliable, timely (some observation series have even three-hour intervals), and valuable for citizen and administrator alike.

Even so, the IMD’s framing of how its most popular measures are categorised is no longer capable of describing what rain – or the absence of rain – affects our districts. These popular measures are distributed every day, weekly and monthly in the form of ‘departures from normal’ tables, charts and maps. The rain adequacy categories are meant to guide alerts and advisories.

These number four: ‘normal’ is rainfall up to +19% above a given period’s average and also down to -19% from that same average, ‘excess’ is +20% rain and more, ‘deficient’ is -20% to -59%, ‘scanty’ is -60% to -99%, and ‘no rain’ is -100%. These categories can mislead more than they inform, for the difference between an excess of +21% and an excess of +41% can be the difference between water enough to puddle rice fields and a river breaking its banks to ruin those fields.

In today’s concerns that have to do with the impacts of climate change, with the increasing variability of the monsoon season, and especially with the production of food crops, the IMD’s stock measurement ‘product’ is no longer viable. It ought to have been replaced at least a decade ago, for the IMD’s Hydromet Division maintains weekly data by meteorological sub-division and by district. This series of running records compares any given monsoon week’s rainfall, in a district, with the long period average (a 50-year period). Such fineness of detail must be matched by a measuring range-finder with appropriate  interpretive indicators. That is why the ‘no rain’, ‘scanty’, ‘deficient’, ‘normal’ or ‘excess’ group of legacy measures must now be replaced. In its place an indicator of eleven grades translates the trends, patterns and messages in IMD’s district-level rainfall data into meaningful and actionable signals.

– Rahul Goswami

Notes

The new 11-grade indicator for assessing weekly rainfall departures in districts uses the same data IMD releases into the public domain, but provides dramatically more useful guidance. This yields the detailed reading required to alert state administrations to drought, drought-like and potential flood conditions. The modified methodology adapts the UN Food and Agriculture Organisation’s ‘Global Information and Early Warning System’ employment of 11 grades.

The weekly tallies of rainfall distribution for meteorological sub-divisions and for states are no longer able to signal administrative action and must be replaced with district-scale and (by 2016 monsoon) urban-scale assessments. The ability of the new 11-grade methodology to provide early warnings of climatic trauma in districts is now clear, and state administrations can respond to growing climatological distress in a targeted manner. Districts and blocks need to be supplied rainfall trends – and not only distribution data – that help farmers and administrators alike better plan for rainfall variability.

Filed Under: Current, Monsoon 2015 Tagged With: 2015, agriculture, district, India, monsoon, rain, water

  • « Previous Page
  • 1
  • 2
  • 3
  • 4
  • 5
  • 6
  • …
  • 110
  • Next Page »

Indiaclimate twitter

Tweets by @Indiaclimate

Notable

Between contemplation and climate

Whether or not the USA, Europe, the Western world, the industrialised Eastern world (China, Japan, South Korea, Taiwan), adhere to or not their paltry promises about being more responsible concerning the factors that lead to climate change, is of very little concern to us. We have never set any store by international agreements on climate […]

The ‘Hindu’, ignorant about weather and climate, but runs down IMD

We find objectionable the report by ‘The Hindu’ daily newspaper accusing the India Meteorological Department of scientific shortcoming (‘IMD gets its August forecast wrong’, 1 September 2016). The report claims that the IMD in June 2016 had forecast that rains for August would be more than usual but that the recorded rain was less than […]

dialogue

  • Misreading monsoon | Resources Research on Misreading monsoon
  • Satish on A tribute to the weathermen of Bharat
  • Climate portal editor on A tribute to the weathermen of Bharat
  • Climate portal editor on A tribute to the weathermen of Bharat
  • Climate portal editor on A tribute to the weathermen of Bharat

Categories

Copyright © 2025 indiaclimateportal.org.