The India Climate Observatory

Commentary, action and research on climate and development in India

  • Home
  • About
  • Monsoon 2018
  • Current
  • Bulletin
  • Contact
  • Announcements

Gauging four weeks of rain in the districts

July 8, 2014 by Climate portal editor Leave a Comment

ICP_four_weeks_rain_graphic_20140709

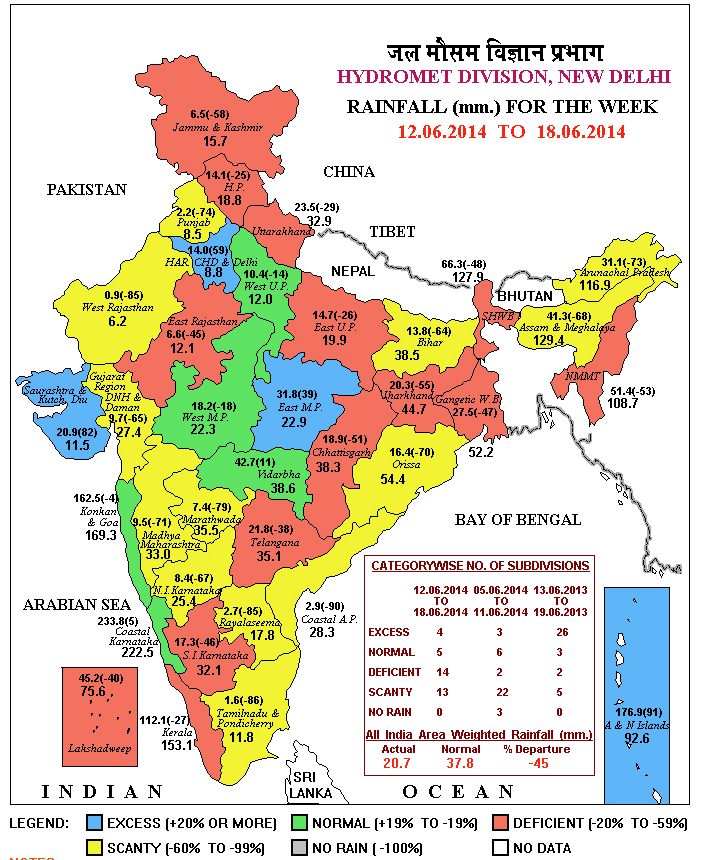
We now have rain data for four complete weeks from the India Meteorological Department (IMD) and for all the districts that have reported the progress of the monsoon. The overall picture is even more serious than reported earlier because of the falling levels of water in the country’s major reservoirs. [05 to 11 June is the first week. 12 to 18 June is the second week. 19 to 25 June is the third week. 26 June to 02 July is the fourth week.]

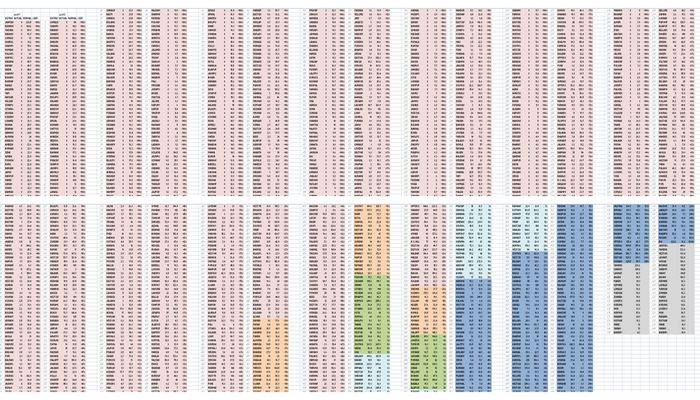
Using the new measure of assessing the adequacy of district rainfall (and not the meteorological gradations that is the IMD standard), in the fourth week of the monsoon the number of districts that reported normal rains in that week (+5% to -5%) is 16; deficient 1 (-6% to -20%) is 31; deficient 2 (-21% and more) is 437; excess 1 (+6% to +20%) is 17; excess 2 (+21% and more) is 113; no data was reported from 25.

Filed Under: Monsoon 2014, Reports & Comment Tagged With: 2014, contingency, district, drought, earth science, forecast, hydrology, IMD, India, monsoon, rainfall

Why there is no ‘normal’ in our monsoon

July 4, 2014 by Climate portal editor Leave a Comment

RG_ICP_monsoon_20140704

The idea of a ‘revival’ of a delayed and weakened monsoon is a misleading one and the country’s earth science agencies must advise against the term being used. In particular, our news media must cease using this term as it implies, incorrectly, that rainfall can be ‘made up’ even though current ‘averages’ are low.

This group of maps of the 2014 monsoon is in three parts. Each part is composed of four separate but linked maps, two each in two rows. This is how you read each of the three sets: the top left map in a group of four shows the anomaly (in millimetres) of rainfall for the days measured. In this map, ochre yellow and dark growns are regions with the least rain compared to what they should have received, while those shaded in blues have received more than they normally do. The second map, top right, shows the percent of normal rain - light and dark browns being percentages very much lower than normal and greens and blues above. The lower left map in each group shows the accumulated rainfall for the measured days in millimetres, with green then blue and then orange showing the increasing levels of accumulated rain. In contrast, the lower right map shows the normal cumulative rainfalls for the same period. As with the group of four maps for the seven day period, the groups for the ten and 30 day rainfall measurement cycles follow the same pattern. In this panel, the seven day period is 26 June to 02 July 2014, the ten day period is 23 June to 02 July 2014 and the 30 day period is 03 June to 02 July 2014. The maps are by the Climate Prediction Center, NOAA Center for Weather and Climate Prediction, USA.

This group of maps of the 2014 monsoon is in three parts. Each part is composed of four separate but linked maps, two each in two rows.
This is how you read each of the three sets: the top left map in a group of four shows the anomaly (in millimetres) of rainfall for the days measured. In this map, ochre yellow and dark browns are regions with the least rain compared to what they should have received, while those shaded in blues have received more than they normally do. The second map, top right, shows the percent of normal rain – light and dark browns being percentages very much lower than normal and greens and blues above.
The lower left map in each group shows the accumulated rainfall for the measured days in millimetres, with green then blue and then orange showing the increasing levels of accumulated rain. In contrast, the lower right map shows the normal cumulative rainfalls for the same period.
As with the group of four maps for the seven day period, the groups for the ten and 30 day rainfall measurement cycles follow the same pattern. In this panel, the seven day period is 26 June to 02 July 2014, the ten day period is 23 June to 02 July 2014 and the 30 day period is 03 June to 02 July 2014.
The maps are by the Climate Prediction Center, NOAA Center for Weather and Climate Prediction, USA.

This is simply not so. A normal monsoon is certainly not one that can statistically be called ‘normal’ on the basis of cumulative rainfall for a region – such as any one of our 36 meteorological sub-divisions – adding up to what is expected over four weeks after a few heavy showers in the last few days have helped tilt the reading from ‘below normal’ to ‘normal’. The three panels of maps alongside convincingly explain why.

Yet senior meteorological department officials, including those at the National Weather Forecasting Centre at the India Meteorological Department, issue statements such as “the monsoon has revived in many parts of central and north India”. This may be meant to assuage the concerns especially of farming and cultivating households, but in fact they only distract from the recognition a continuing climatological crisis urgently needs.

The evidence till now is extremely worrisome. June’s rainfall was 43% below average (a ‘national’ statistic that has no meaning in a district, but which helps in a small way to describe the degree of dryness) and this makes June 2014 the worst first month for recorded rainfall since 2009, a year in which the monsoon was the worst after the dreadful dry of 1972.

Especially given the growing evidence of the effects of climate change in India – from rising sea levels, to increasing meltwater from Himalayan glaciers causing torrents in hilly and mountainous districts, to rising mean temperatures in peninsular and north India – there is reason enough to set aside the usual measures such as the date of what is called ‘the onset of the rains over Kerala’ which is pegged to 01 June, and then a progress of the rain up the peninsula based on patterns of 40, 50 and more years ago. These time-tables no longer stand. [A full resolution set of the maps used here is available as a zip archive (2.68 MB).]

What continues to stand in the food staples calendar is the sowing that takes place in July and August but although there is more cooperation between the official earth sciences agencies and the Ministry of Agriculture, the central government has continues to link, in recent statements, the rising prices of food staples to the probability that these will continue should the monsoon be inadequate – which is what all the indicators are pointing to at this time.

This insistence is a contradiction, for a late and weak monsoon (or even an uneven and heavy monsoon that is statistically ‘normal’) will not help the usual sowing time-table and that is why agricultural contingency plans for every district are readied at the first indication of a wayward monsoon. The role of the central and state governments at times like these is not to blame poor rains for volatile and rising food prices but to help determine crop time-tables that match the circumstances.

By Rahul Goswami

Filed Under: Blogs, Monsoon 2014 Tagged With: 2014, agriculture, average, crop staple, drought, hydrology, IMD, India, inflation, monsoon, rainfall, water resources

India Climate Watch bulletin

July 2, 2014 by Climate portal editor Leave a Comment

ICW1_pic_for_ICP

The new government is speaking on climate change with confidence and purpose, and the administration of the Ministry of Environment, Forests and Climate Change is, like other line departments providing the public with more information and in greater detail. The new Indian Climate Watch bulletin has said, “Such an approach needs to be at least the minimum benchmark that ensures engagement and participation between government and citizens, government and industry, government and stakeholders who have not and continue not to find adequate representation when policy and planning id discussed and decided.” For this new and decisive direction, the bulletin added, the ministry under Prakash Javadekar deserves congratulations.

Download the India Climate Watch bulletin 2014 01 here (pdf, 122kb)

Download the India Climate Watch bulletin 2014 01 here (pdf, 122kb)

The new India Climate Watch bulletin has examined the recent statements made by the Ministry and provides an outline of the socio-economic contexts that must guide them. Several positives and points of concern are found:

  • The MoEF is functioning in a more transparent manner concerning climate change in India, and is discussing inter-governmental and multilateral meetings and conferences well ahead of time.
  • Javadekar is talking about finance, technology and time-tables pertaining to the international climate negotiations. He is also talking about a more active and larger role that India will play.
  • The MoEF is currently speaking on its own and the statements of the Government of India do not appear to reflect a common position held by key sectors such as agriculture and food, water resources, health, renewable energy, and petroleum.
  • The central government is discussing India’s international role in climate negotiations, in particular the Conference of Parties, CoP, that are held annually under the auspices of the United Nations Framework Convention on Climate Change (UNFCCC). There is scarce attention paid to climate change matters and responses in the states.

However, much more clarity is needed on the following points made by the central government through Javadekar and the MoEF. Read why in the India Climate Watch bulletin 2014 01 (pdf, 122kb).

Filed Under: India Climate Watch, Reports & Comment Tagged With: agriculture, bulletin, Climate Change, COP, food, health, ministry, MoEF, negotiations, sanitation, UNFCCC, water

What the middle class must unlearn

July 1, 2014 by Climate portal editor Leave a Comment

RG_ICP_middle_class_201406The UN Sustainable Development Goals (SDGs) are currently dominating debates on development policy worldwide. The German Advisory Council on Global Change (WBGU) has published a policy paper that recommends the inclusion of a comprehensive environmental goal entitled “safeguarding Earth system services” in the catalogue of new sustainable development goals (SDGs).

The aim of this goal is to bring development paths in line with ecological boundaries, so that human progress can be ensured. In order to operationalise this goal, the WBGU has recommended integrating six targets to protect the climate, the soils and biological diversity. The WGBU points out that compliance with ecological boundaries in the form of “planetary guard rails” is a prerequisite for poverty eradication and development. Taking them into account does not imply restrictions on the future development of the poorest 2 billion people. Rather, in the long term development will only be possible within these planetary guard rails.

“Consumption decisions and lifestyles of the middle and upper classes are causing the greatest threat to the natural life-support systems,” the policy paper has said, because of their high level of resource consumption or high per-capita CO2 emissions. Policy-makers therefore have a responsibility to create the necessary requirements for sustainable production and consumption patterns.

Filed Under: Key Reports Tagged With: biological diversity, climate, consumption, development, emissions, poverty, SDG, soil, sustainable development, UN

New El Niño outlook

July 1, 2014 by Climate portal editor Leave a Comment

Sea surface temperature in the Indian Ocean. Image from the earth|nullschool real time visualisation of wind and ocean conditions

Sea surface temperature in the Indian Ocean. Image from the earth|nullschool real time visualisation of wind and ocean conditions

There is a 60% likelihood of an El Niño being fully established between June and August, increasing to 75-80% for the October to December period, according to an El Niño Update issued by the World Meteorological Organisation (WMO). Many countries have already started preparing for the arrival of El Niño, which is associated with regional-scale drought and flood situations in different parts of the world and has a warming influence on global average surface temperatures.

El Niño is characterised by unusually warm ocean surface temperatures in the central and eastern tropical Pacific, coupled with typical atmospheric circulation patterns. It is a natural phenomenon with a recurring interval of 2-7 years and has a major impact on the climate around the world. The last El Niño was in 2009-2010.

The latest WMO outlooks suggest that central tropical Pacific Ocean surface temperatures are likely to warm further into the third quarter of 2014, while the atmospheric patterns associated with El Niño are also expected to form and strengthen.

The WMO expects that El Niño will reach peak strength during the fourth quarter and endure into the first few months of 2015 before dissipating. The substantially above-average oceanic heat content beneath the sea surface of the central and eastern tropical Pacific Ocean, triggered by strong westerly wind events earlier this year, suggested an event of significant strength. However, the delayed atmospheric response, and a potential lack of subsequent westerly wind events in the coming months, may limit the peak strength of the El Niño, said the WMO.

Already, the second quarter of 2014 set new global atmospheric heat records. According to NASA, this May was the hottest in the global measure, meanwhile, the Japanese Meteorological Agency marked the March-April period as the hottest spring in all of the past 130 years (NASA showed the same period was second hottest). Rising Pacific Ocean surface temperatures by themselves were enough, when combined with raging human greenhouse gas heat forcing, to nudge atmospheric temperatures into a new record range. But the emergence of full-blown El Niño will likely push current record readings even higher.

Filed Under: Latest Tagged With: Climate Change, drought, El Nino, flood, WMO, World Meteorological Organisation

A third dry week of monsoon 2014

June 28, 2014 by Climate portal editor Leave a Comment

05 to 11 June is the first week. 12 to 18 June is the second week. 19 to 25 June is the third week. The bars represent the weeks and are divided by IMD's rainfall categories, with the length of each category in a bar showing the proportion of that category's number of districts. The colours used here match those used in IMD's weekly rainfall map (below) which displays the category-wise rainfall in the 36 meteorological sub-divisions (but not by district).

05 to 11 June is the first week. 12 to 18 June is the second week. 19 to 25 June is the third week. The bars represent the weeks and are divided by IMD’s rainfall categories, with the length of each category in a bar showing the proportion of that category’s number of districts. The colours used here match those used in IMD’s weekly rainfall map (below) which displays the category-wise rainfall in the 36 meteorological sub-divisions (but not by district).

The IMD weekly rainfall map for 19 to 25 June.

The IMD weekly rainfall map for 19 to 25 June.

We now have rain data for three complete weeks from the India Meteorological Department (IMD) and for all the districts that have reported the progress of the monsoon.

The overall picture remains grim. In the third week of the monsoon the number of districts that reported normal rains in that week (-19% to +19% of the average) is only 74. No rain (-100%) was reported by 71 districts Scanty rain (-99% to -60%) was reported by 221 districts, deficient rain (-59% to -20%) was reported by 125 districts, excess rain (+20% and more) was reported by 129 districts, and there was no data from 21 districts.

IMD_districts_table_3_weeksThe Department of Agriculture and Cooperation, of the Ministry of Agriculture, has already issued its guidance to states on the contingency plans to be followed for a delayed monsoon. That is why it is important to make available the district-level normals and rainfall departures – the meteorological sub-divisions are too broad for such analysis and are irrelevant to any contingency plans and remedial work.

By end-June, when the IMD updates its outlook for the rest of monsoon 2014, we expect more detailed assessments of the districts to be publicly available – the agromet (agricultural meteorology section) already provides this to the states, with state agriculture departments given the responsibility of ensuring that the advice – which is especially important for farmers to plan the sowing of crop staples – reaches every panchayat.

Filed Under: Latest, Monsoon 2014 Tagged With: 2014, agriculture, climatechange, contingency, district, drought, food, forecast, IMD, India, inflation, monsoon, rainfall, weather

Boarding the technology omnibus

June 27, 2014 by Climate portal editor Leave a Comment

RG_ICP_UNEA_blog_201406India’s Environment Minister Prakash Javadekar has attended the first United Nations Environment Assembly, held in Nairobi, Kenya, on 23-27 June 2014. The United Nations Environment Programme (UNEP) has described the UNEA is an “historic event for all of us, set to define not only the future of the United Nations Environment Programme, but to support further the institutional framework and programmatic platform for sustainable development and set the environmental agenda for the world to follow”.

At the first UNEA assembly, Javadekar made two points we find require critical discussion. The first is: “India strongly feels that technology transfer is the most important means of implementation and an effective and functional Technology Facilitation Mechanism (TFM) is a must for a meaningful Post-2015 Development Agenda.”

We think such a blanket statement concerning ‘technology’ cannot be held up at international fora as being the consensus view of India’s citizens. There has for the last decade been scarcely any public consultation held at the local level – keeping in mind the rights of urban local bodies and panchayats in determining their development options and needs – concerning technology, its forms and the ways in which it may be used. Thus Javadekar’s statement is unrepresentative.

The Technology Facilitation Mechanism he referred to is considered – in UN and other inter-governmental fora – as being able to meet the technology transfer needs of developing countries in various sectors such as health, energy, food, water, sanitation. The view in such fora is that ‘developing’ countries need to be ‘assisted’ in technology needs assessment, adaptation, roll-out and human and institutional capacity building.

Javadekar’s second statement is: “I have a suggestion to make in this regard. It has been agreed to establish Green Climate Fund of US$ 100 billion per year by 2020. This amount should be utilised to purchase IPRs of most crucial technologies for public good and these technologies should then be freely available to the developing countries to facilitate sustainable development.”

We think this is an incomplete statement that rests on a few techno-centric views, which references intellectual property in a casual manner (and which also ignores the central aspects of the widespread opposition in India to genetically modified organisms for example), and which has overlooked entirely traditional and indigenous knowledge. The latter part of this second statement, “should then be freely available”, is useful from a South-South perspective and should be treated as such.

Filed Under: Current Tagged With: green climate fund, India, intellectual property, IPR, Javadekar, MoEF, technology transfer, UN Environment Assembly, UNEP

The new measure of monsoon

June 20, 2014 by Climate portal editor 1 Comment

The changes that we find in the patterns, trends, intensity and quantity of India’s monsoon now require an overhaul in the way we assess what is satisfactory or not for environmental and human needs.

By Rahul Goswami

India’s summer monsoon is already late, and where it is late but active it is weak. The indications from the central earth science agencies (including the India Meteorological Department), from the Indian Institute of Tropical Meteorology, from the National Centre for Medium Range Weather Forecasting are that it will be the end of June before the summer monsoon system settles over central India and the western Gangetic plains. Even so, it will be a relief from the searing temperatures but will not assure sowing conditions for farmers and cultivators, nor will it add to the stores of water in major and minor reservoirs.

Districts reporting monsoon data, over two weeks, colour-coded under a revised categorisation (explained in the text) for weekly rainfall. The left bar in each pair is the second week, the right bar is the first. Most districts are coloured light red, signifying rainfall much below the weekly normal. Peach is for the lesser deficient category. Green is normal. The two blue hues - lighter and darker - are for the two excess categories. It is immediately apparent that 485 out of 618 reporting districts (78%) have experienced less rainfall than they should have at this stage of the monsoon.

Districts reporting monsoon data, over two weeks, colour-coded under a revised categorisation (explained in the text) for weekly rainfall. The left bar in each pair is the second week, the right bar is the first. Most districts are coloured light red, signifying rainfall much below the weekly normal. Peach is for the lesser deficient category. Green is normal. The two blue hues – lighter and darker – are for the two excess categories. It is immediately apparent that 485 out of 618 reporting districts (78%) have experienced less rainfall than they should have at this stage of the monsoon.

The situation is very much more worrying than it is presented as by the agencies and departments of the new NDA government, and by industry – which complains about duties and tariffs but pays no collective attention to the daily situation that attends the south-west monsoon. The Ministry of Agriculture has busied itself, since early 2014 May, with mentioning the new high of agricultural exports, with the apparent success of a new SMS service to farmers, with releasing the advance estimates for agricultural and horticultural production, with a review of the implementation of crop insurance schemes and there is one, only one, advisory issued for horticulture crop cultivators concerning what they must do “under the rain deficit conditions”.

Some of the problem – that is, an absence of urgency as the last week of June approaches with little evidence of the customary rains being deposited, and apparently little preparation for a deficit in rains – may be attributable to the manner in which basic rainfall data is assessed and distributed to the public. This is done by the IMD – and more recently by a new private sector that is exploiting the yawning gaps in data presentation and the delivery of timely forecasts.

It is however the IMD, the Ministry of Earth Sciences and the Department of Science and Technology that works with state government agencies and departments in the areas of water resources, agriculture and drinking water supply. With the enormous size of the constituencies that are affected by dwindling water supplies and late sowing, there is a very strong case for revising the terms with which rainfall is measured and the frequency with which forecasts are distributed to districts and settlements.

It is absurd that the primary indicator during the designated ‘monsoon months’, according to the IMD, which are June to September, is a weekly table and weekly map of sub-divisional rainfall. Such an approach is not only out of date in the very hour it is issued – and distributed via the media – it is also grossly negligent of the commendable and ubiquitous advances made by public sector science and private ingenuity alike concerning the handling and treatment of climatic and weather-related data for India.

The typical IMD weekly rain map showing the colour codes and data for India's 36 meteorological subdivisions. This presentation urgently needs to be retired in favour of a more granular (district) map that is updated as soon as new data is received.

The typical IMD weekly rain map showing the colour codes and data for India’s 36 meteorological subdivisions. This presentation urgently needs to be retired in favour of a more granular (district) map that is updated as soon as new data is received.

A dense network of weather stations complemented by dedicated satellites provides continuous coverage of the sub-continent, the northern Asian land mass, the surrounding oceans southwards until beyond the Tropic of Capricorn. Methods to simply and accurately funnel this stream of real-time data and imagery are available, mostly at no cost, in order to aid local administrations, farmers and cultivators, and all citizens. It is this availability and relative simplicity of use (block-level weather forecasts for 72 hours are now available as local language apps on smartphones) that needs to be encouraged by the official agencies. More so in a year like 2014 with a late and weak monsoon and an El Nino threatening.

That is why IMD’s hoary top level categorisation of rainfall weekly quantities in the subdivisions must be replaced, both for what they describe and for how frequently they are described. These currently are: ‘normal’ in a subdivision is rainfall that is up to +19% above a given period’s average and down to -19% from that same average; likewise excess is +20% and more, deficient is -20% to -59% and scanty is -60% to -99%. The ‘normals’ are calculated based on the mean weekly rainfall for the period 1951-2000 with monitoring done in 641 districts distributed amongst the 36 meteorological subdivisions.

However, as all those who are engaged in studying and planning for the effects and impacts of climate change recognise, the changes observed on the ground over the last 15 years (rainfall, temperature, intensity of rain, duration of dry and wet spells) have made the term ‘normal’ difficult to use so that it continues to have meaning. Worse, a ‘normal’ with a wide range – over 28 percentage points from a given centre for a location – can lull local administrations particularly to misread the signs and ignore, on the basis of administrative expediency, the need to prepare for contingency.

By categorising rainfall ‘normals’ and departures from  ‘normal’ to become more administratively impelling – these proposed corrections also simplify the interpretations possible for rainfall above and below ‘normals’ – greater awareness and preparedness of administrations, key agencies and citizens to the deficiencies of monsoon can be fostered. For the district tables below therefore, I have re-cast the categories as follows (all based on the long-term average provided by IMD): Normal in a district is +5% to -5%; Deficient 1 is -6% to -20%; Deficient 2 is -21% and more; Excess 1 is +6% to +20%; Excess 2 is +21% and more.

Using these revised categories we see that for the second week (2014 June 12 to 18) of rainfall recorded in the districts (618 out of 641 reported) in 20 districts only was the rainfall ‘normal’ for that week. Under the existing IMD category of normal, this number is 81 – thus 61 district collectors will have been informed that in their district there is nothing to worry about, whereas the difference between a below normal reading of -5% and one of -15% can have a lasting impact particularly in rainfed districts where the social and institutional capacities to manage water and to plan credit needs for late sowing may be weak. In the same way, under the existing IMD categories, the difference between the conditions of two adjacent communities, one living in a district with a ‘deficient’ reading of -50% and the other in the neighbouring district (and in the same subdivision) with a ‘scanty’ reading of -70% is no more than technical, for the same degree of contingency planning will be required.

Whereas, for the same second rainfall week the IMD categories were ‘No Rain’ in 80 districts, ‘Scanty’ in 241 districts and ‘Deficient’ in 130 districts, under the proposed revision they will simply be ‘Deficient 2’ with 449 districts – thereby showing dramatically how widespread the conditions of the late and weak monsoon 2014 are – and ‘Deficient 1’ with 36 districts. State departments of agriculture, which have long worked on the frontlines of monsoon emergencies, whether drought or flood, have several generations of institutional experience to call upon in such circumstances. In most states, by 12 June alerts began to be issued to farmers and cultivators on measures to take if the monsoon is 15 days late, 30 days late and if signs of ‘terminal drought’ appear. Such preparedness must quickly extend to other areas – water resources, drinking water, food and civil supplies – for which a new meteorological literacy is urgently needed.

Filed Under: Monsoon 2014, Reports & Comment Tagged With: 2014, agriculture, climate, deficient, district, earth science, IMD, India, meteorology, monsoon, rainfed, satellite, scanty, weather station

Emissions, deserts and economics

June 17, 2014 by Climate portal editor Leave a Comment

Desertification in Namibia. Photo: UNEP/A.Gloor/Namibia

Desertification in Namibia. Photo: UNEP/A.Gloor/Namibia

Marking the World Day to Combat Desertification and referring directly to climate change, India today said developing countries like it have “a right to grow” and in the process “our net emission may increase”. Environment Minister Prakash Javadekar made the point that the problem of carbon emission “has not been created by the developing nations and hence responsibility for addressing it should not be solely put on them”.

Javadekar said India does have to reduce carbon emissions but also said that the country has “a right to grow”. He said that poverty is an “environmental disaster” and “unless we tackle poverty, unless we eradicate poverty, we cannot really address the climate change”. The eradication of poverty in India, said the minister, will require India to grow economically and in so doing “our net emission may increase”.

Meanwhile, United Nations officials today emphasised the importance of restoring degrading lands to avoid or soften the potentially disastrous impacts of climate change. The UN mentioned studies which show that 24 billion tons of fertile soil are being eroded each year, and 2 billion hectares of degraded land have potential for recovery and restoration. Furthermore, land degradation is not only a problem in the world’s drylands. Most of the deterioration is happening in humid areas.

With the ongoing impact of global climate change, we will continue to witness extreme weather events, which will in turn lead to even more land degradation. The UN statement on the World Day to Combat Desertification said a commitment to achieving a land-degradation neutral world must be realised through common targets and clear indicators of success.

Javadekar has said that India will become “desertification neutral” by 2030, and added that 32% of India’s total land is facing the threat of desertification. “In India, 69% of the land is dryland, and 32% of the land is undergoing desertification,” he said. According to the Ministry of Environment, Forests and Climate Change, the land area facing desertification is 81 million hectares, while 105 million hectares are dryland. “It is a serious threat and has to be stopped and reversed,” he said. Javadekar said an integrated plan will be launched with the agriculture, land resources and water ministries to address the problem.

The World Day to Combat Desertification (WDCD) is 17 June4. As a signatory to United Nations Convention to Combat Desertification (UNCCD), which focuses on desertification, land degradation and drought, India promotes public awareness of the issue, and mobilises international cooperation for the implementation of the UNCCD. The theme of this year’s WDCD is ecosystem-based adaptation with the slogan ‘Land Belongs to the Future, Let’s Climate Proof It’. The 2014 WDCD highlights the benefits of mainstreaming sustainable land management policies and practices into our collective response to climate change.

Filed Under: Latest Tagged With: carbon, Climate Change, desertification, drought, dryland, emissions, environment, forest, Javadekar, land degradation, ministry, poverty, UNCCD

MNRE boosts solar thermal use with subsidy

June 10, 2014 by Climate portal editor Leave a Comment

MNRE_Solar_website_201405The Jawaharlal Nehru National Solar Mission is a major initiative of the Government of India and the state governments to promote ecologically sustainable growth while addressing India’s energy security challenge. The Mission, according to the Ministry of New and Renewable Energy, will contribute to the global effort to meet the challenges of climate change.

The first phase (till March 2013) is considered to have achieved the target. The Solar Thermal component of the JNNSM will now, until 2022, focus on promoting off-grid systems including hybrid systems to meet and/or supplement heating and cooling energy requirements and power. These systems still require interventions to bring down costs. The key challenge is to provide an enabling framework and support for entrepreneurs to develop markets. This programme will address off-grid and decentralised solar thermal application area/systems.

Fossil fuels are used for process heating, drying, distillation, water heating, space heating and refrigeration and generation of electricity. The Ministry has estimated that about 25 million households use electric geysers, consuming approximately 7,500 GWh of electricity (assuming minimum annual consumption of around 600 kWh/year/geyser) and 15 million tons a year of petroleum fuels are used in industries in thermal form at temperatures below 300°C. As about 30% of the energy consumed by industry is used for heating water, there is huge potential.

Filed Under: Latest Tagged With: cooling, electric geyser, energy, fossil fuel, heating, JNNSM, MNRE, off-grid, renewable, solar thermal, subsidy

  • « Previous Page
  • 1
  • …
  • 8
  • 9
  • 10
  • 11
  • 12
  • …
  • 110
  • Next Page »

Indiaclimate twitter

Tweets by @Indiaclimate

Notable

Between contemplation and climate

Whether or not the USA, Europe, the Western world, the industrialised Eastern world (China, Japan, South Korea, Taiwan), adhere to or not their paltry promises about being more responsible concerning the factors that lead to climate change, is of very little concern to us. We have never set any store by international agreements on climate […]

The ‘Hindu’, ignorant about weather and climate, but runs down IMD

We find objectionable the report by ‘The Hindu’ daily newspaper accusing the India Meteorological Department of scientific shortcoming (‘IMD gets its August forecast wrong’, 1 September 2016). The report claims that the IMD in June 2016 had forecast that rains for August would be more than usual but that the recorded rain was less than […]

dialogue

  • Misreading monsoon | Resources Research on Misreading monsoon
  • Satish on A tribute to the weathermen of Bharat
  • Climate portal editor on A tribute to the weathermen of Bharat
  • Climate portal editor on A tribute to the weathermen of Bharat
  • Climate portal editor on A tribute to the weathermen of Bharat

Categories

Copyright © 2025 indiaclimateportal.org.