The India Climate Observatory

Commentary, action and research on climate and development in India

  • Home
  • About
  • Monsoon 2018
  • Current
  • Bulletin
  • Contact
  • Announcements

‘Fani’ aims for Odisha, AP

April 27, 2019 by Climate portal editor Leave a Comment

Update: Cyclone Fani will make landfall on the coast on 3 May. Depending on whether the Extremely Severe Cyclonic Storm (IMD’s classification) gains more speed over the Bay of Bengal, Fani could cross the coast as early as 1000 hours on 3 May.

Based on the weather charts released by IMD and corroborated by the climatological forecasts produced by the World Meteorological Organisation’s members, Fani will cross the coast between Kakinada, East Godavari district, Andhra Pradesh, and Puri, district Puri, Odisha, which is about 60 km south of Bhubaneshwar.

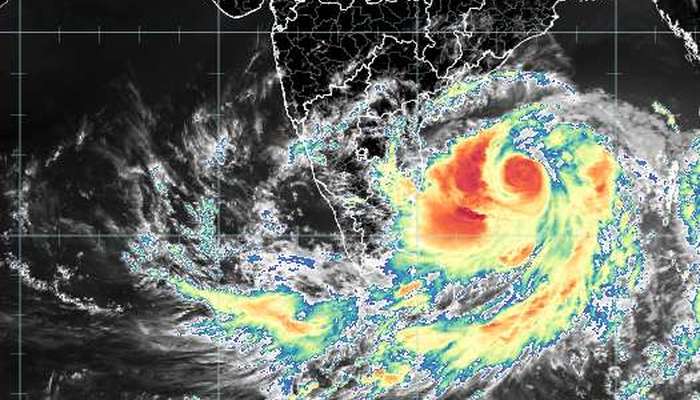
Previously: The India Meteorological Department has issued a forcast for and warning about a cyclonic storm which as of today (27 Apri) is a low pressure area lying over the East Equatorial Indian Ocean and adjoining south-east Bay of Bengal.

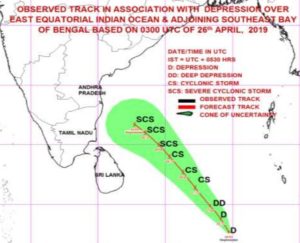
It is already intensifying into a depression over the East Equatorial Indian Ocean and adjoining central parts of the southern Bay of Bengal and will further intensify into a cyclonic storm. Thereafter the storm is forecast to move north-westwards along and off the east coast of Sri Lanka near the north Tamil Nadu coast on 30 April.

The IMD has already issued warning to fishermen about strong winds. Wind speed reaching 45-55 kmph gusting to 65 kmph over East Equatorial Indian Ocean and adjoining central parts of the southern Bay of Bengal are already being recorded. Gale wind speeds will be reached of 65-75 kmph gusting to 85 kmph over the south-west Bay of Bengal and adjoining Equatorial Indian Ocean by 27 April.

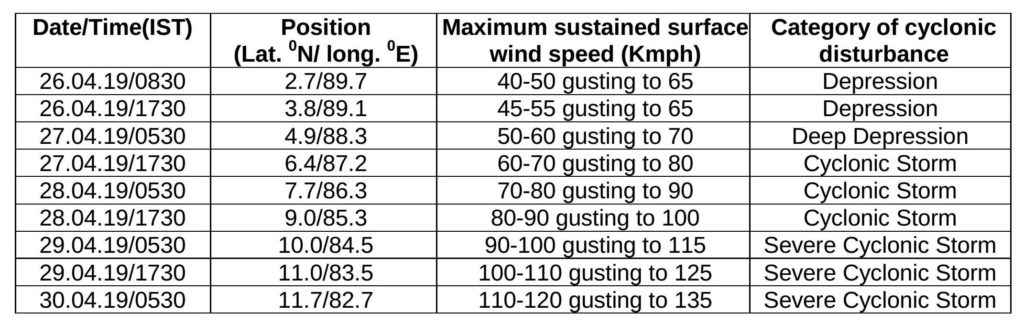
Thereafter 80-90 kmph gusting to 100 kmph over the south-west Bay of Bengal and adjoining Equatorial Indian Ocean and along and off the Sri Lankan coast on 28 April and 90-100 kmph gusting to 115 kmph over the south-west Bay of Bengal, along and off the Sri Lankan coast and off the Tamil Nadu and Puducherry coast on 29 April. The sea condition will be very rough in all these areas.

There will be light to moderate rainfall at many places with heavy rainfalls at isolated places in north coastal Tamil Nadu on 30 April and 1 May and over Kerala on 29 and 30 April. Light to moderate rainfall at many places with heavy rainfall at isolated places is also very likely over south coastal Andhra  Pradesh on these dates.

Forecast updates are available here.

Filed Under: Latest Tagged With: 2019, Andhra Pradesh, Bay of Bengal, cyclone, India, Indian Ocean, monsoon, Sri Lanka, Tamil Nadu

Dry districts alert, May 2017

May 1, 2017 by Climate portal editor Leave a Comment

A large number of districts in south, peninsular, central and eastern India are experiencing dry and semi-arid conditions which will continue, and likely become worse, until the 2017 monsoon becomes active.

This list of districts is based on our re-working of the maps released weekly by the India Meteorological Department (Hydromet section in Pune), which show the district-level standardised precipitation index (or SPI). While this is not a drought or dryness index, the weekly SPI serves as a very reliable indicator of where water stress is occurring, and is therefore an invaluable aid for relief planning.

In this series of four maps, re-coloured by us to better display differences in SPI between regions and over time, the change in south India stands out.

Each map displays the SPI as a cumulative reading of the four weeks until the date given. That is why the change for any district – from ‘moderately dry’ to ‘severely dry’ for example – needs to be seen as having an immediate bearing on the available water, crop health and condition of forest and pasture for that district.

Based on the readings for 26 April 2017 this is the list of districts that need urgent attention.

Maharashtra: Gadchiroli, Chandrapur, Yavatmal, Kolhapur
Chhattisgarh (Raipur division): Gariaband, Raipur, Baloda Bazar
Odisha: Rayagada, Kandhamal, Angul, Cuttack
West Bengal: 24 Parganas North
Manipur: Chandel
Andhra Pradesh: Vizianagaram, Kurnool
Telengana (old district boundaries): Nizamabad, Karimnagar, Medak, Warangal, Khammam, Mahbubnagar
Karnataka: Bidar, Raichur, Bijapur, Bagalkot, Koppal, Gadag, Dharwad, Bellary, Shimoga
Tamil Nadu: Cuddalore, Nagapattinam, Tiruvarur, Thanjavur, Pudukkottai, Ramanathapuram, Toothukudi, Kaniyakumari, Theni, Coimbatore
Kerala: Malappuram, Thrissur, Ernakulam, Kottayam, Alapuzha

Filed Under: Latest Tagged With: 2017, Andhra Pradesh, arid, Bharat, district, drought, India, Karnataka, Kerala, Maharashtra, Odisha, summer, Tamil Nadu, Telengana, water

South India’s water emergency

April 11, 2017 by Climate portal editor Leave a Comment

ICP_res_20170410_topBy the end of the first week of April 2017, the most current and reliable indicator for stored water in south India showed how dire the situation has become. And the South-West monsoon is still about eight weeks away. The weekly data sheet on the stored water quantities in the 91 major reservoirs of India, which is maintained and released by the Central Water Commission, has in the 6 April 2017 release shown the scale of the water emergency.

Of the 31 reservoirs in the southern region (Kerala, Tamil Nadu, Karnataka, Telengana and Andhra Pradesh) that are among the major reservoirs of India, 18 have stored water that is less than 15% of their full capacities.

These 18 are (ranked by least water stored):
Nagarjuna Sagar, APTG, 0.00%
Sholayar, TN, 0.00%
Almatti, KAR, 0.03%
Kabini, KAR, 2.25%
Vanivilas Sagar, KAR, 2.74%
Tungabhadra, KAR, 3.21%
Vaigai, TN, 4.07%
Parambikulam, TN, 5.00%
Malaprabha (Renuka), KAR, 5.56%
Hemavathy, KAR, 5.72%
Mettur (Stanley), TN, 6.72%
Periyar, KER, 6.94%
Bhadra, KAR, 9.02%
Lower Bhawani, TN, 9.09%
Srisailam, APTG, 9.44%
Krishnaraja Sagar, KAR, 11.44%
Malapmuzha, KER, 11.61%
Aliyar, TN, 14.74%
(TN is Tamil Nadu, KER is Kerala, KAR is Karnataka, APTG is Andhra Pradesh and Telengana)

ICP_south_water_20170411

Using a municipal average of about 400 litres per day per household that is a typical designed supply (not delivered, for that’s another tale), how much water does this allow for the 60.51 million households of the southern region until the monsoon begins?

Tamil Nadu has 18.46 million households, Kerala has 7.83 million, Karnataka has 13.3 million, Andhra Pradesh and Telengana have 20.92 million. These together need 24.2 billion litres a day or, in reservoir storage terms, 0.024 billion cubic metres (bcm) a day. The 31 major reservoirs of southern India together have, as of 6 April 2017, 6.583 bcm. From this quantity is taken water for industrial, agricultural and commercial use.

These uses are given priority or water stocks are secured (never mind allocation and metering) especially by industry. Normally, what remains for household use is about a third of the available stock. This leaves, as on 6 April, about 2.19 bcm for household use, which will suffice the 60.51 million households of south India for about 90 days – but only provided, and this is the stringent, non-negotiable condition that must be enforced, all households especially urban keep within the 400 litres per household per day limit.

The situation does not improve even if the monsoon arrives on time and the first weeks deliver normal rainfall. It is only by July 5-15 that reservoir water stocks begin trending upwards. This is where the 90-day restricted supply can take south India to. But only if immediate and strict rationing is imposed, as it should have been, to allow for climatological variance, by 1 March 2017.

Filed Under: Latest Tagged With: Andhra Pradesh, Bharat, drought, India, Karnataka, Kerala, reservoir, Tamil Nadu, Telengana, water, water shortage, water supply

Celsius surprises in 57 cities

May 21, 2015 by Climate portal editor Leave a Comment

ICP_57_cities_temp_top

The middle of February is when the chill begins to abate. The middle of May is when the monsoon is longed for. In our towns, district headquarters and cities, that climatic journey of 90 days is one of a steady rise in the reading of the temperature gauge, from the low 20s to the mid 30s.

This large panel of 90 days of daily average temperatures shows, in 57 ways, the effects of the rains that almost every district has experienced during the last two months. For each city, the curved line is the long period ‘normal’ for these 90 days, based on daily averages. Also for each city, the second line which swings above and below the ‘normal’ is the one that describes the changes in its daily average from February to May 2015.

[You can download (1.52MB) a full resolution image of the panel here.]

Where this second line crosses to rise above the normal, the intervening space is red, where it dips below is coloured blue. The patches of red or blue are what tell us about the effects of a lingering winter, or rains that have been called ‘unseasonal’ but which we think signal a shift in the monsoon patterns.

Amongst the readings there is to be found some general similarities and also some individual peculiarities. Overall, there are more blue patches than there are red ones, and that describes how most of the cities in this panel have escaped (till this point) the typical heat of April and May. The second noteworthy general finding is that these blue patches occur more frequently in the second half of the 90 days, and so are the result of the rainy spells experienced from March to early May.

Hisar (in Haryana) has remained under the normal temperature line for many more days than above or near it. So have Gorakhpur (Uttar Pradesh), Pendra (Chhattisgarh), Ranchi (Jharkhand), Nagpur (Maharashtra) and Jharsuguda (Odisha).

On the other hand in peninsular and south India, the below ‘normal’ daily average temperature readings are to be found in the latter half of the time period, coinciding with the frequent wet spells. This we can see in Kakinada, Kurnool and Anantapur (Andhra Pradesh), Bangalore, Gadag and Mangalore (Karnataka), Chennai, Cuddalore and Tiruchirapalli (Tamil Nadu) and Thiruvananthapuram (Kerala). [A zip file with the charts for all 57 cities is available here (1.2MB).]

What pattern will the next 30 days worth of temperature readings follow? In four weeks we will update this bird’s eye view of city temperatures, by which time monsoon 2015 should continue to give us more blues than reds. [Temperature time series plots are courtesy the NOAA Center for Weather and Climate Prediction.]

Filed Under: Current, Monsoon 2015, Reports & Comment Tagged With: Anantapur, Andhra Pradesh, Bangalore, Chennai, Chhattisgarh, city, climate, Cuddalore, Gadag, Gorakhpur, India, Jharkhand, Jharsuguda, Kakinada, Karnataka, Kerala, Kurnool, Maharashtra, Mangalore, monsoon, Nagpur, Odisha, Ranchi, Tamil Nadu, temperature, Thiruvananthapuram, Tiruchirapalli, town, urban, Uttar Pradesh

Indiaclimate twitter

Tweets by @Indiaclimate

Notable

Between contemplation and climate

Whether or not the USA, Europe, the Western world, the industrialised Eastern world (China, Japan, South Korea, Taiwan), adhere to or not their paltry promises about being more responsible concerning the factors that lead to climate change, is of very little concern to us. We have never set any store by international agreements on climate […]

The ‘Hindu’, ignorant about weather and climate, but runs down IMD

We find objectionable the report by ‘The Hindu’ daily newspaper accusing the India Meteorological Department of scientific shortcoming (‘IMD gets its August forecast wrong’, 1 September 2016). The report claims that the IMD in June 2016 had forecast that rains for August would be more than usual but that the recorded rain was less than […]

dialogue

  • Misreading monsoon | Resources Research on Misreading monsoon
  • Satish on A tribute to the weathermen of Bharat
  • Climate portal editor on A tribute to the weathermen of Bharat
  • Climate portal editor on A tribute to the weathermen of Bharat
  • Climate portal editor on A tribute to the weathermen of Bharat

Categories

Copyright © 2025 indiaclimateportal.org.