The India Climate Observatory

Commentary, action and research on climate and development in India

  • Home
  • About
  • Monsoon 2018
  • Current
  • Bulletin
  • Contact
  • Announcements

‘Fani’ aims for Odisha, AP

April 27, 2019 by Climate portal editor Leave a Comment

Update: Cyclone Fani will make landfall on the coast on 3 May. Depending on whether the Extremely Severe Cyclonic Storm (IMD’s classification) gains more speed over the Bay of Bengal, Fani could cross the coast as early as 1000 hours on 3 May.

Based on the weather charts released by IMD and corroborated by the climatological forecasts produced by the World Meteorological Organisation’s members, Fani will cross the coast between Kakinada, East Godavari district, Andhra Pradesh, and Puri, district Puri, Odisha, which is about 60 km south of Bhubaneshwar.

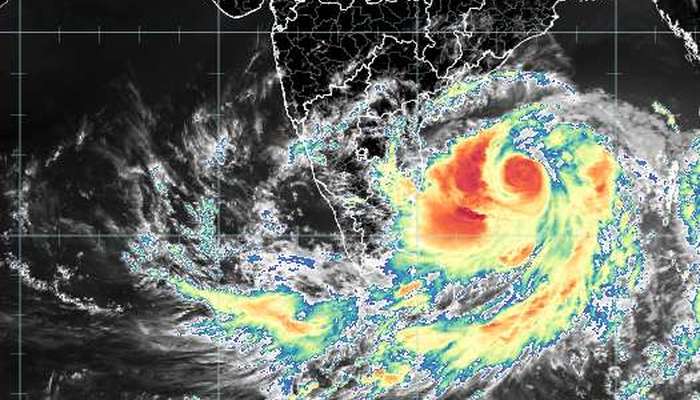
Previously: The India Meteorological Department has issued a forcast for and warning about a cyclonic storm which as of today (27 Apri) is a low pressure area lying over the East Equatorial Indian Ocean and adjoining south-east Bay of Bengal.

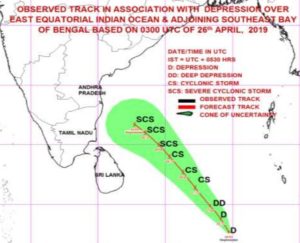
It is already intensifying into a depression over the East Equatorial Indian Ocean and adjoining central parts of the southern Bay of Bengal and will further intensify into a cyclonic storm. Thereafter the storm is forecast to move north-westwards along and off the east coast of Sri Lanka near the north Tamil Nadu coast on 30 April.

The IMD has already issued warning to fishermen about strong winds. Wind speed reaching 45-55 kmph gusting to 65 kmph over East Equatorial Indian Ocean and adjoining central parts of the southern Bay of Bengal are already being recorded. Gale wind speeds will be reached of 65-75 kmph gusting to 85 kmph over the south-west Bay of Bengal and adjoining Equatorial Indian Ocean by 27 April.

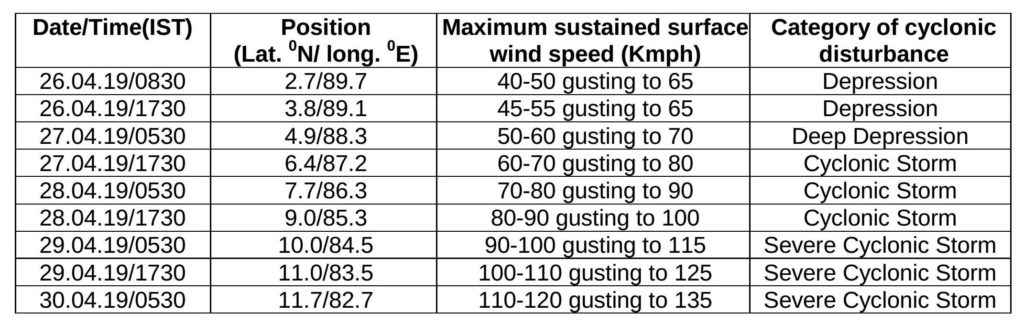
Thereafter 80-90 kmph gusting to 100 kmph over the south-west Bay of Bengal and adjoining Equatorial Indian Ocean and along and off the Sri Lankan coast on 28 April and 90-100 kmph gusting to 115 kmph over the south-west Bay of Bengal, along and off the Sri Lankan coast and off the Tamil Nadu and Puducherry coast on 29 April. The sea condition will be very rough in all these areas.

There will be light to moderate rainfall at many places with heavy rainfalls at isolated places in north coastal Tamil Nadu on 30 April and 1 May and over Kerala on 29 and 30 April. Light to moderate rainfall at many places with heavy rainfall at isolated places is also very likely over south coastal Andhra  Pradesh on these dates.

Forecast updates are available here.

Filed Under: Latest Tagged With: 2019, Andhra Pradesh, Bay of Bengal, cyclone, India, Indian Ocean, monsoon, Sri Lanka, Tamil Nadu

How El Niño plans to hijack monsoon 2015

May 26, 2015 by Climate portal editor Leave a Comment

ICP_El_Nino_monsoon_20150526_smWhether the monsoon starts off on time, whether the June, July, August and September rainfall averages are met, and whether the seasonal pattern of the monsoon is maintained are expectations that must now be set aside.

According to the Climate Prediction Center’s ENSO probability forecast, there is a 90% chance that El Niño conditions will prevail through June to August of the northern hemisphere and a more than 80% percent chance El Niño will last throughout all of 2015.

The Ministry of Earth Sciences El Niño/La Nina, Indian Ocean Dipole Update (10 May 2015)

The Ministry of Earth Sciences El Niño/La Nina, Indian Ocean Dipole Update (10 May 2015)

What this means, especially when record warm global atmospheric temperatures (because we in South Asia and our neighbours in East Asia have continued burned coal as if the resulting CO2 and soot simply doesn’t exist) are being set, is the remaining months of 2015 – the monsoon period included – will bring strange, dangerous and extreme weather. We have already seen that over the last week, with the death toll from the heat wave having crossed 550.

For the first time since 1998 – ­the year of the strongest El Niño on record, which played havoc with the
world’s weather patterns and was blamed for 23,000 deaths worldwide – ­ocean temperatures in all five El Niño zones have risen above 1 degree Celsius warmer than normal at the same time. That is read by climatologists and ocean scientists as presaging an El Niño that is moderately strong to strong. The forecast models updated in May are now unanimous that El Niño is going to keep strengthening through the rest of 2015. (See also the official forecast from the USA’s government climate science agency.)

El Niño’s home is in the tropical eastern Pacific, but we in India need to watch the waters to our south very closely. New research published in the journal Nature Geoscience has examined records going back to 1950 and noticed that Indian Ocean absorbed heat at a low level until 2003. Thereafter, the excess oceanic heat in the Pacific Ocean found its way through the Indonesian archipelago and into the Indian Ocean. This is the gigantic reservoir of watery heat that is going to dictate terms to our summer monsoon, or what our school textbooks call the south-west monsoon.

It is a worry for the entire South Asian region – India, Pakistan, Sri Lanka, Bangladesh, Nepal, the Maldives, Burma, Afghanistan and Bhutan. That is why when the Forum on Regional Climate Monitoring-Assessment-Prediction for Asia (FOCRA) issued its seasonal outlook for June to August 2015 it predicted weaker than normal Indian summer and East Asian monsoons. Precipitation over land is influenced by external factors such as the El Niño Southern Oscillation (the ENSO), the ‘Indian Ocean Dipole’, the ‘Arctic Oscillation’, and so on.

There may be a “timely onset” of the monsoon, as the venerable IMD is used to saying, but that doesn’t mean our troubles are over. Far from it.

Filed Under: Latest, Monsoon 2015 Tagged With: Bangladesh, Bhutan, El Nino, ENSO, India, Indian Ocean, Maldives, monsoon, Nepal, Pacific, Pakistan, Sri Lanka

Climate measures that matter

October 8, 2014 by Climate portal editor Leave a Comment

RG_ICP_countries_emissions_201410

India has been saying during the last several international negotiations about climate change that our country, like other ‘developing’ countries, has a right to development. What this means is India has officially said our country will continue to burn coal and petroleum products in quantities that contribute to India emitting 1.954 million tons of CO2 a year (this figure is for 2012).

The ‘developed’ world (mostly countries in western Europe and North America) point to this large quantity and demand that India (and China, which emits very much more) do something to halt this rise and to decrease it. India’s response has been – recognise what you have done from the time of the Industrial Revolution and then we’ll resume talking.

This is unlikely to result in any constructive recognition of all that is linked. A country’s total emissions is one part of the ‘development’ picture and others are at least as important. There are also tons of CO2 emitted per capita (India has often said that its per capita emissions are far below those of the West). And there is per capita consumption of electricity (which is still mainly generated by burning coal).

That is why, when we look at the relationship between these three measures for a country, and between countries for any one of these three measures, we see connections that are otherwise missed due to a focus on a single measure. Our diagram, ‘Climate Measures that Matter’, helps explain these connections. It can be used as an aide to understanding better India’s position at climate negotiations, and provides much-needed context to the arguments about a country’s total emissions and its per capita emissions. [See the statement by Minster for Environment Prakash Javadekar, at the United Nations Climate Summit 2014.]

This diagram is an aide to understanding better India's position at climate negotiations. It provides much-needed context to the arguments about a country's total emissions and its per capita emissions.

This diagram is an aide to understanding better India’s position at climate negotiations. It provides much-needed context to the arguments about a country’s total emissions and its per capita emissions.

The country and energy data used in this diagram is for the latest year which is 2012. The source for the data is the International Energy Agency’s ‘Key World Energy Statistics 2014’ . This selection of countries compares countries of South Asia, East Asia, the larger economies of the OECD, the BRICS, other European countries, and countries of the Middle East. For each of the three measures, the size of the circles are relative to each other.

[The full size image is available here (png. 266kb). This diagram is distributed under a creative commons licence (2014) by the India Climate Portal. Reproduce only with full attribution.]

One could argue that the relationship between three measures for any country shows its responsibilities towards curbing the use of fossil fuels both nationally and individually, and towards capping electricity use. For example, per capita electricity use in a number of the countries shown in the diagram is seven or eight times more, and even ten times more and above, than India’s use.

Our South Asian neighbours – Bangladesh, Nepal, Pakistan and Sri Lanka – have by all three measures relatively small global impacts. The size of our population and the depth of our industry and economy however has made India the third largest emitter of CO2 (after China and the USA). But if India seeks some sort of ‘parity’ in electricity use – or if India sees the low per capita CO2 emissions as a ‘development’ gap – our total contribution to CO2 emissions will only rise faster, hurting the environment that we share with our neighbours.

The diagram helps display some of the most glaring and conspicuous differences between countries’ impacts on the atmosphere and ecosphere. These differences can be taken to mean fuel use and consumption must be halted and stringently curbed, whether or not the Kyoto Protocol and a successor treaty exist. That would be the way of acting responsibly for a country. [See the text of the Joint Statement issued at the 18th BASIC Ministerial Meeting on Climate Change in August 2014.]

These differences can also mean that the ‘developed’ countries recognise – as we and many ‘developing’ and ‘less developed’ countries have been reminding them repeatedly – that the way their economies and societies have functioned has caused much of the problem in the first place, and they must stop shunting the onus of responsibility onto us.

Finally, these differences should also show why being small is not being ‘poor’ and ‘less developed’. Households and families that use few kilowatts instead of many, burn few litres of fuel instead of many, are very much more responsible and environmentally balanced than others. It is the small circles in this diagram that ought to be the inspiration.

Creative Commons License
Climate Measures that Matter by India Climate Portal / Rahul Goswami is licensed under a Creative Commons Attribution-NonCommercial-NoDerivatives 4.0 International License.

Filed Under: Blogs, Reports & Comment Tagged With: atmosphere, Bangladesh, carbon, China, Climate Change, CO2, electricity, emissions, energy, environment, fossil fuels, India, Kyoto Protocol, Nepal, Pakistan, per capita, South Asia, Sri Lanka, UNFCCC

Indiaclimate twitter

Tweets by @Indiaclimate

Notable

Between contemplation and climate

Whether or not the USA, Europe, the Western world, the industrialised Eastern world (China, Japan, South Korea, Taiwan), adhere to or not their paltry promises about being more responsible concerning the factors that lead to climate change, is of very little concern to us. We have never set any store by international agreements on climate […]

The ‘Hindu’, ignorant about weather and climate, but runs down IMD

We find objectionable the report by ‘The Hindu’ daily newspaper accusing the India Meteorological Department of scientific shortcoming (‘IMD gets its August forecast wrong’, 1 September 2016). The report claims that the IMD in June 2016 had forecast that rains for August would be more than usual but that the recorded rain was less than […]

dialogue

  • Misreading monsoon | Resources Research on Misreading monsoon
  • Satish on A tribute to the weathermen of Bharat
  • Climate portal editor on A tribute to the weathermen of Bharat
  • Climate portal editor on A tribute to the weathermen of Bharat
  • Climate portal editor on A tribute to the weathermen of Bharat

Categories

Copyright © 2025 indiaclimateportal.org.