Between 10 and 15 December 2015, minimum temperatures all over northern India and Pakistan, in particular in the Hindu Kush and western Himalaya (including the state of Jammu and Kashmir) dropped sharply. The cold and strong north-westerly winds blowing in from the distant Central Asian region during this period of December deepened the persistent chill.
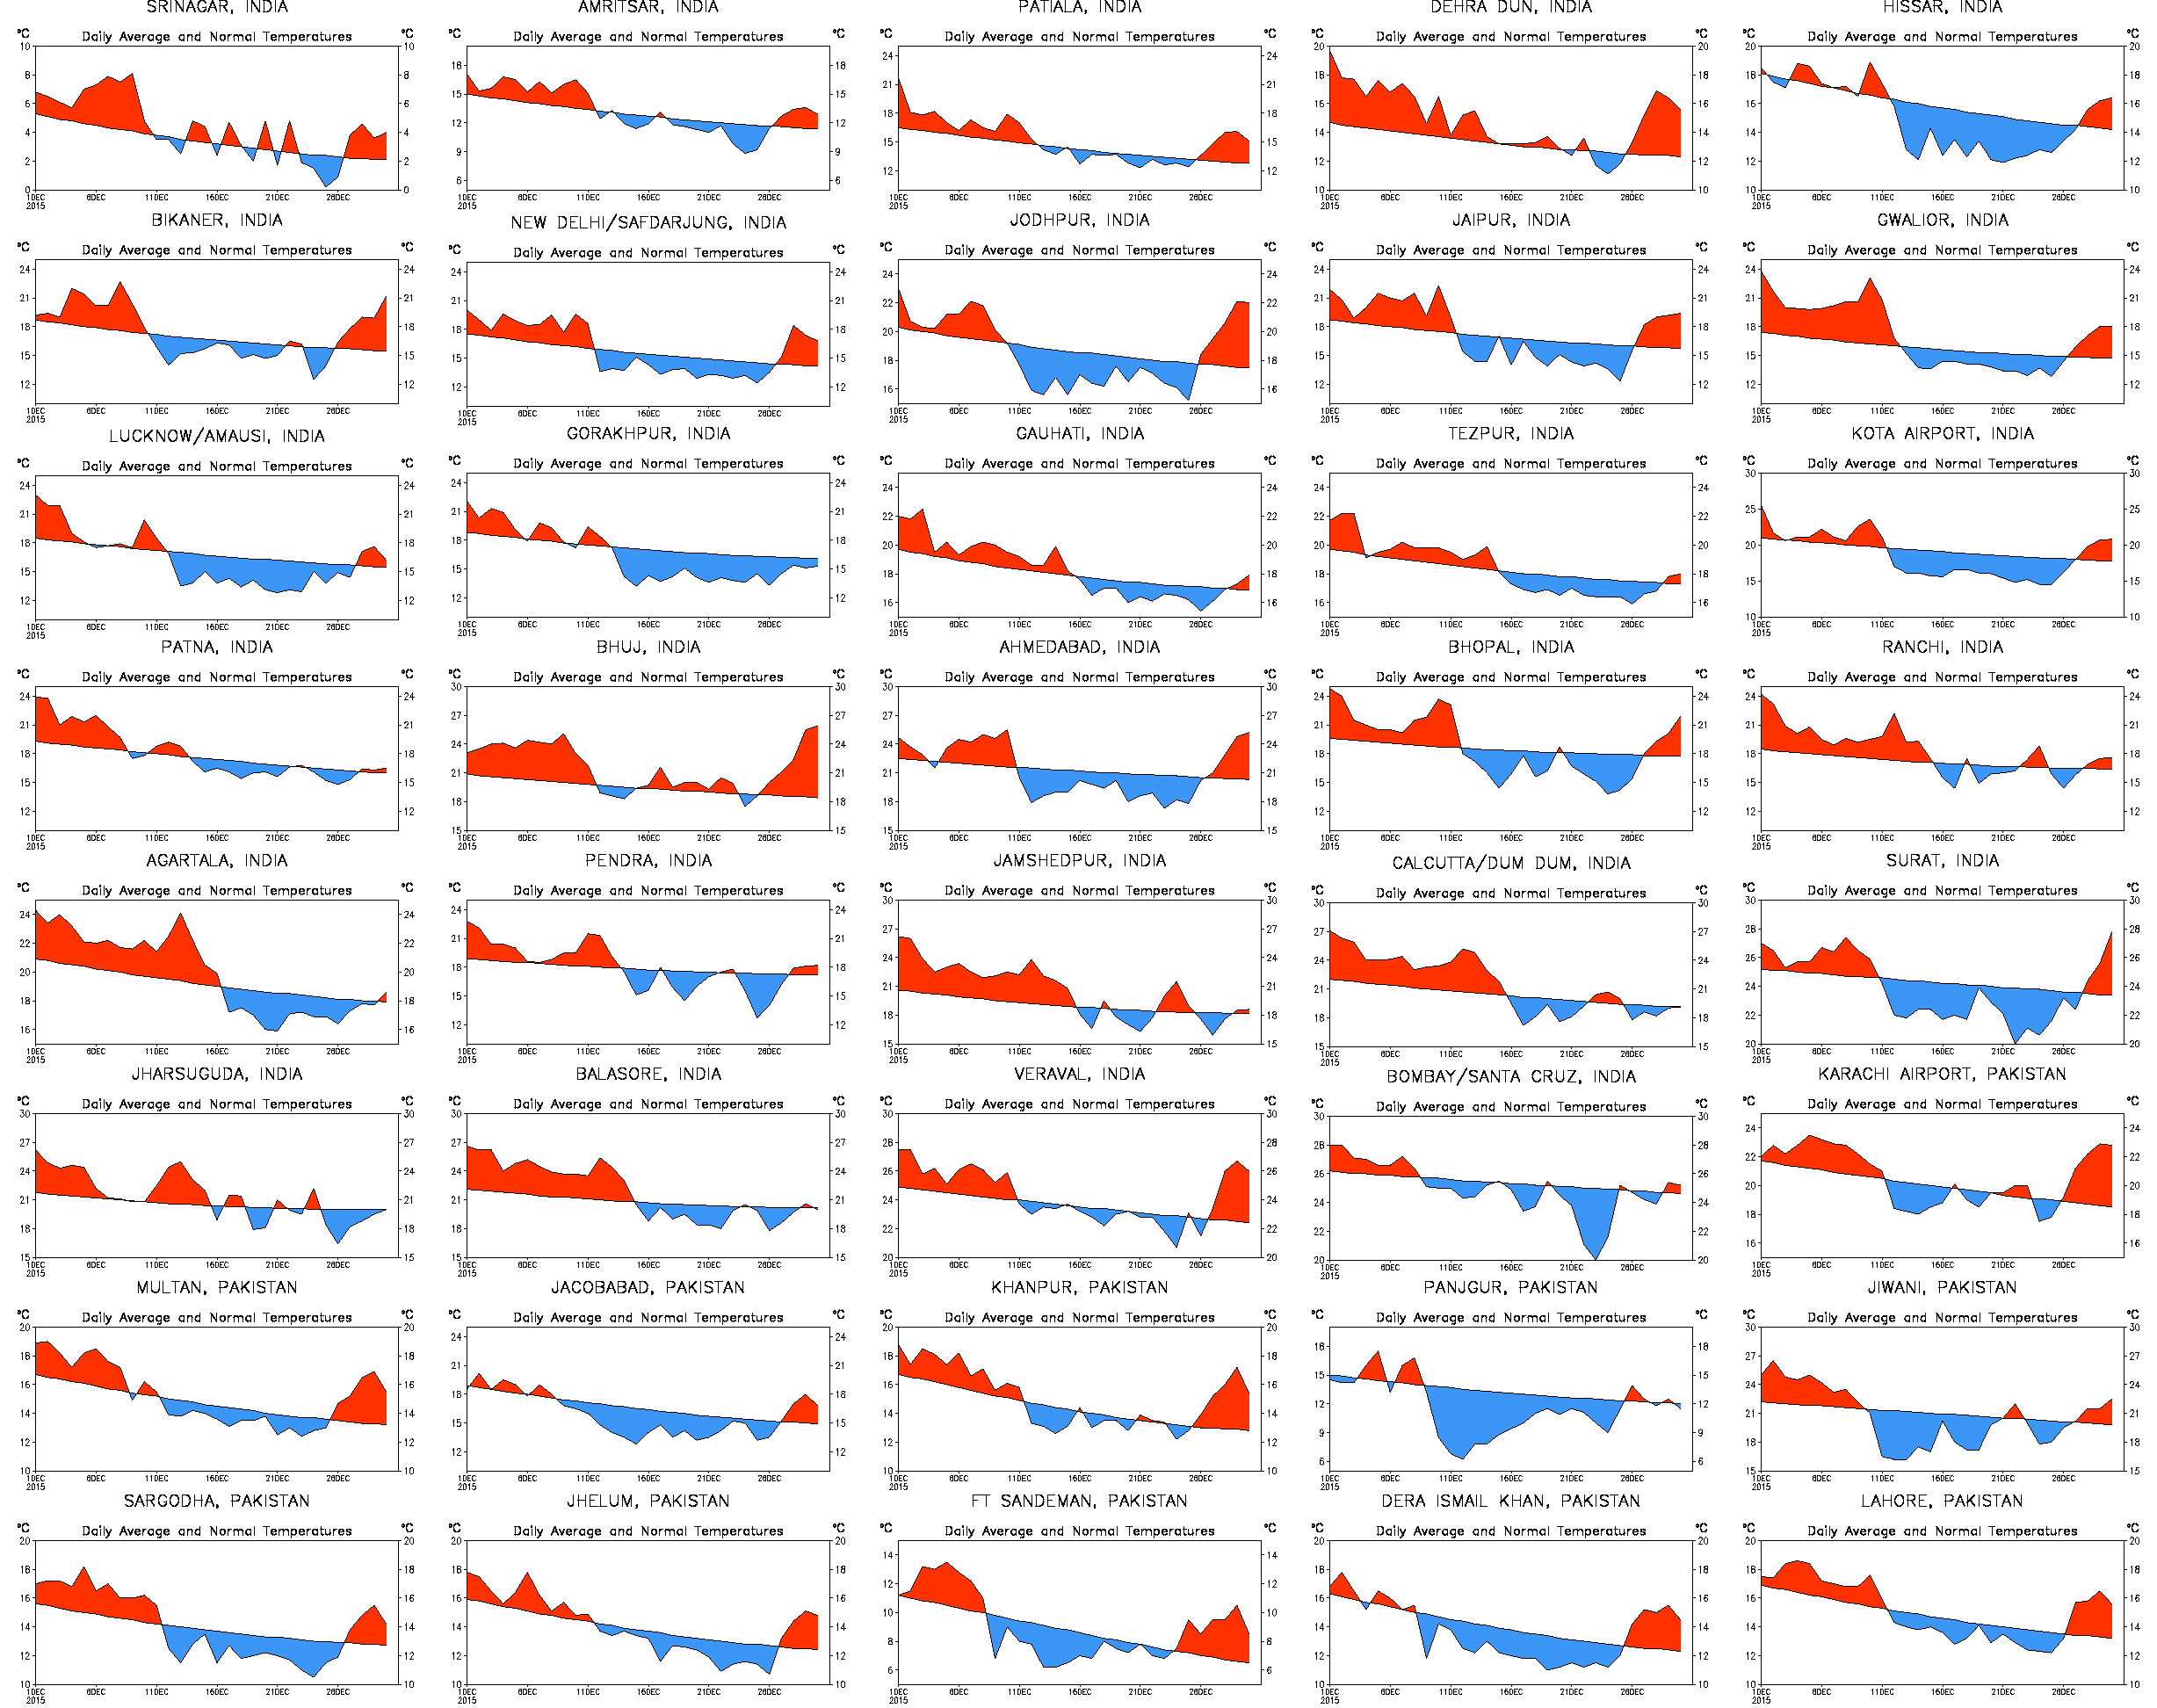
This panel of the 30-day temperature charts for 40 cities shows the sudden dip all experienced from around 10 December. Original charts are from the NOAA Center for Weather and Climate Prediction and reassembled for this panel.
The cold wave was also experienced in the north-western region – including Rajasthan, Gujarat and adjacent north Maharashtra as far south as Mumbai. From 10 December until 27 and 28 December, unusually cold conditions gripped entire agro-ecological regions – the north Gujarat plain together with the Kathiawad peninsula, the Aravalli ranges and the east Rajasthan uplands, the Ganga-Yamuna Doab, Rohilkhand and the Avadah plain, the Madhya Bharat plateau and the Bundelkhand uplands, and the Central (or Malwa) highlands.
These 30-day temperature charts shows the sudden dip in minimum for 40 cities from 9 and 10 December, and the setting in of cold conditions which continued for two weeks thereafter. During this time, the higher reaches of Kashmir Valley received snowfall, New Delhi recorded minimums of around 5 Celsius with the maximums being two to three degrees below normal, Amritsar in Punjab was at 2 Celsius while Ludhiana and Patiala recorded between 4 and 6 Celsius. Churu in Rajasthan recorded a low of 3 Celsius and Mt Abu, at an altitude of 1,200 metres was just below 0 Celsius. State capital Jaipur recorded a minimum 6 Celsius.
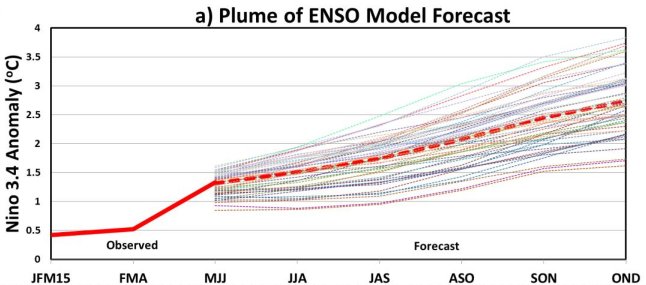
 Whether the monsoon starts off on time, whether the June, July, August and September rainfall averages are met, and whether the seasonal pattern of the monsoon is maintained are expectations that must now be set aside.