The India Climate Observatory

Commentary, action and research on climate and development in India

  • Home
  • About
  • Monsoon 2018
  • Current
  • Bulletin
  • Contact
  • Announcements

The ‘Hindu’, ignorant about weather and climate, but runs down IMD

September 2, 2016 by Climate portal editor Leave a Comment

ICP_IMD_Hindu_comment_20160901

We find objectionable the report by ‘The Hindu’ daily newspaper accusing the India Meteorological Department of scientific shortcoming (‘IMD gets its August forecast wrong’, 1 September 2016). The report claims that the IMD in June 2016 had forecast that rains for August would be more than usual but that the recorded rain was less than usual.

This is nothing but cheap sensationalising by the newspaper of a non-issue. In so doing the ‘Hindu’, which is considered one of Bharat’s national newspapers, has attempted to tarnish the work of not only the India Meteorological Department, but also the work of the earth observation technical community which serve us in the several institutions and agencies of the Ministry of Earth Sciences.

There is no mainstream news media in the country – no daily newspapers, no magazine or periodical, no television channel, no internet website – which possesses the competence to assess the scientific quality and correctness of output of the government earth science agencies, and whose output is delivered to the public every day, several times a day. ‘The Hindu’ certainly does not and with this report exposes its ignorance about meteorology and climate science and observation.

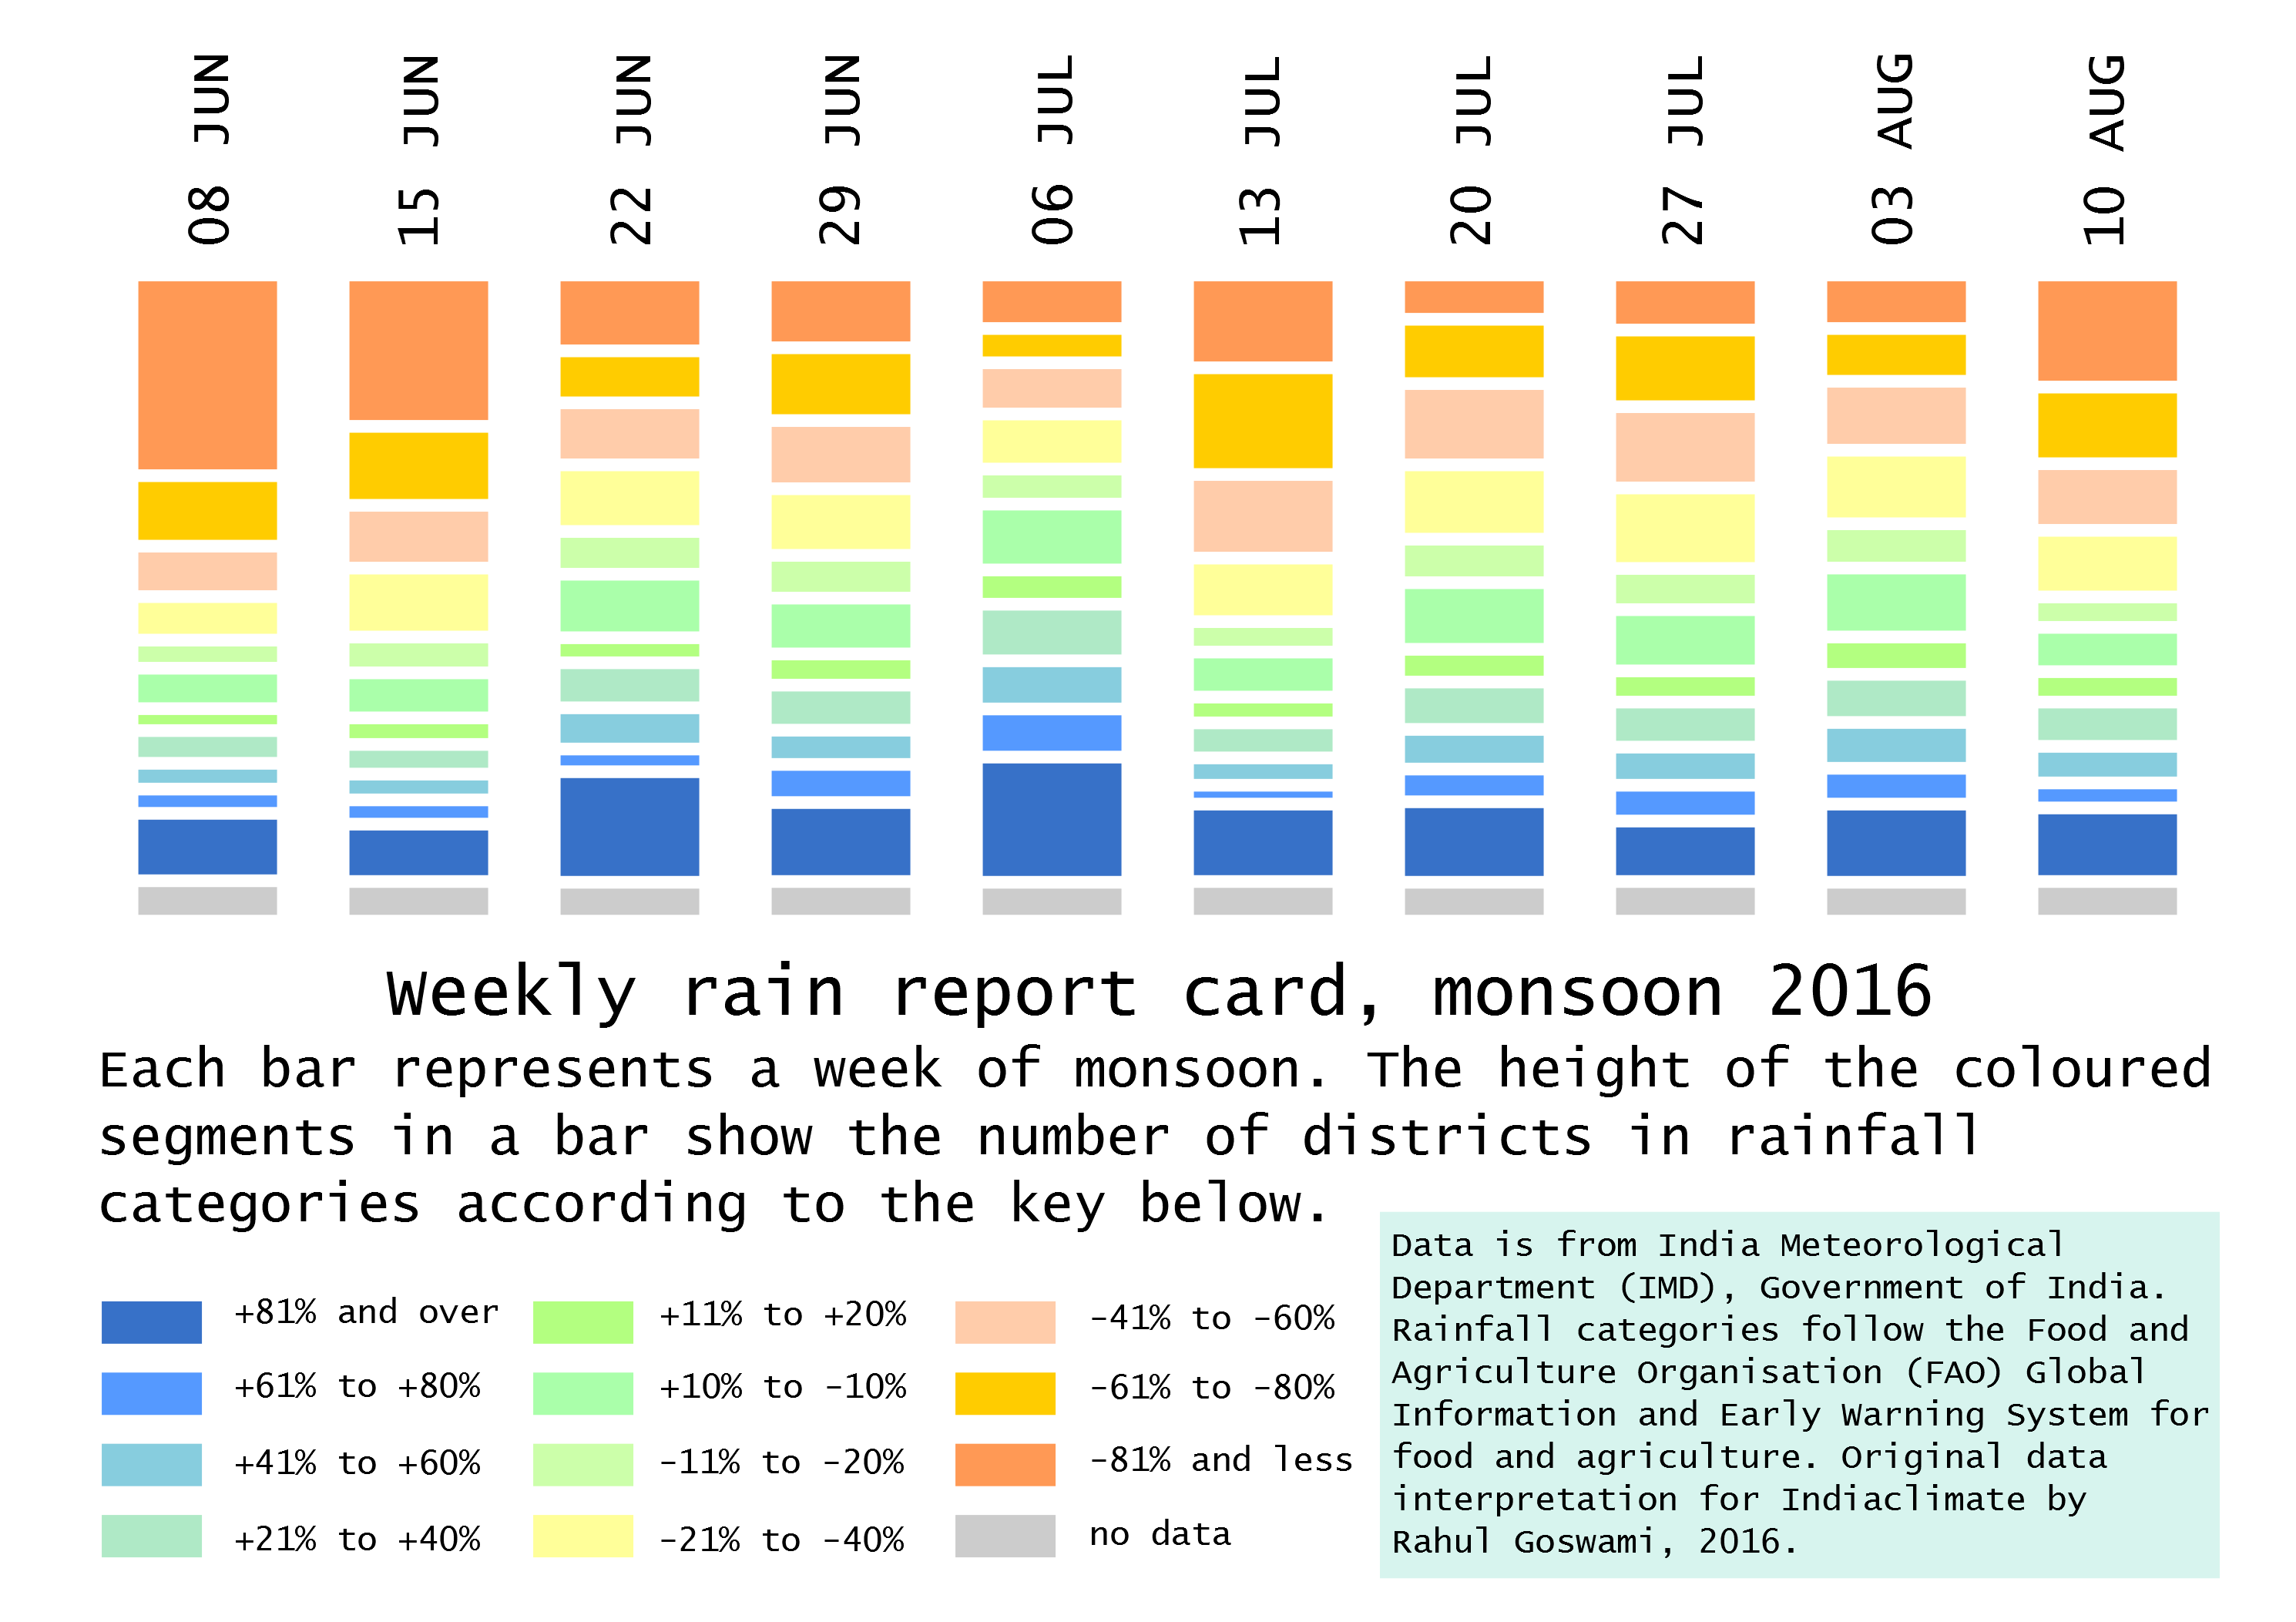
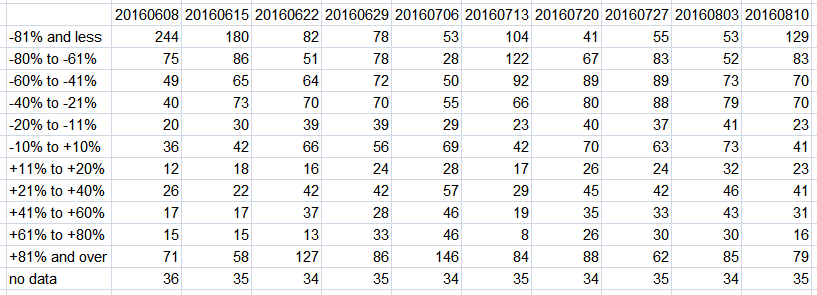
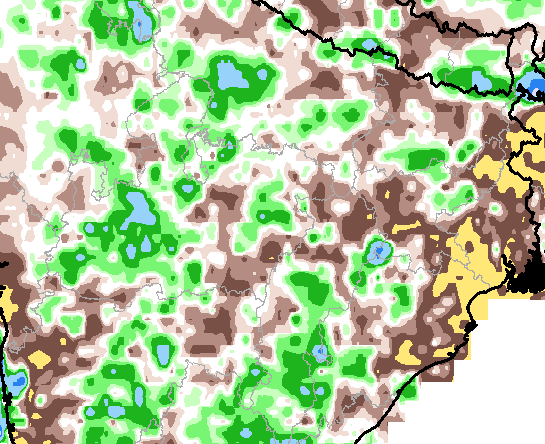
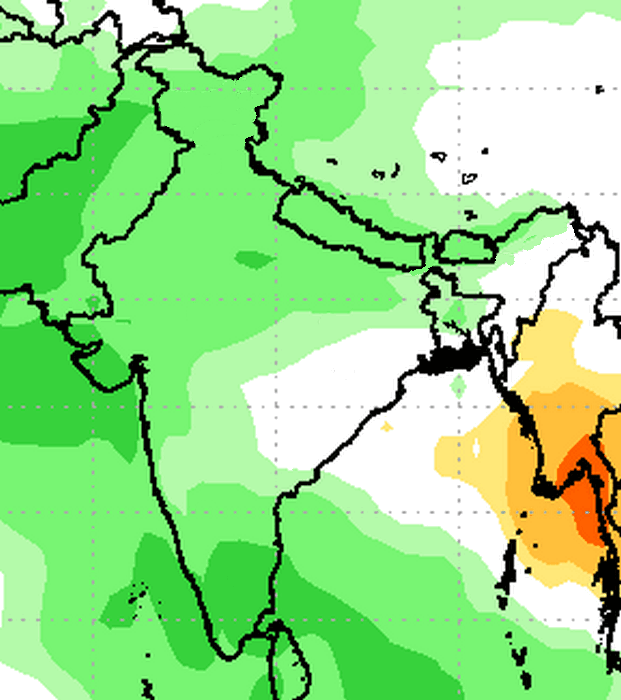
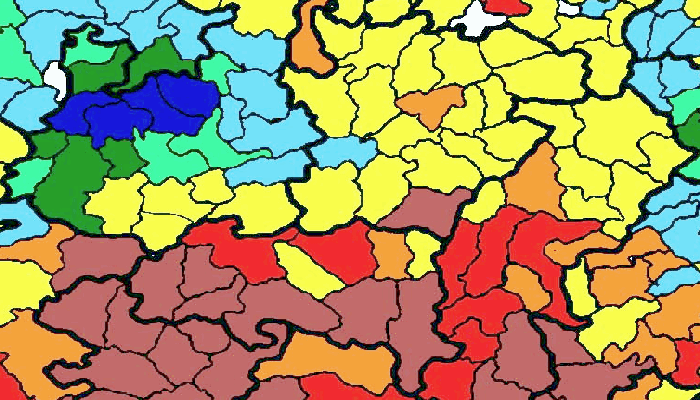
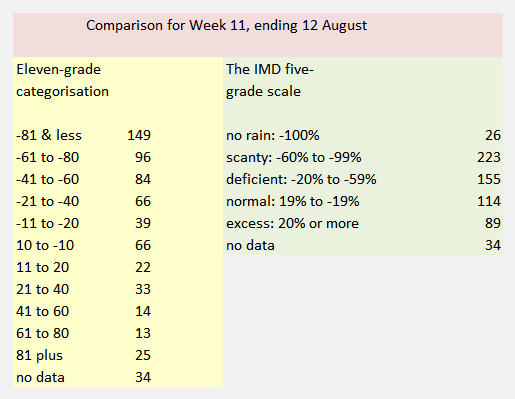
Concerning the newspaper’s claim, rainfall for the period 1 June to 31 August in the 36 meteorological sub-divisions of Bharat, as an area-weighted average, is -3% of the long period average and is therefore well within the boundaries set by both the first stage and second stage forecasts provided by the IMD. Of the 36 sub-divisions, for this period 24 sub-divisions have recorded normal rainfall, four have excess and eight (including the two island sub-divisions) have deficient rainfall. In what way is this an erring forecast?

The news report in the ‘Hindu’ states that the forecasting error it has found “suggests that the agency’s weather models are still not robust enough to capture changes in global climate that could affect” our monsoon. This is nonsense.

The earth observation agencies of the MoES – of which the IMD is a part – for the June to September monsoon forecast employs a group of six parameters that inform the forecast (together called an ensemble forecasting system). These are: north-east Pacific to north-west Atlantic sea surface temperature anomaly gradient, south-east equatorial Indian Ocean sea surface temperature, East Asia mean sea level pressure, central Pacific (El Nino region 3.4), sea surface temperature and tendency, north Atlantic mean sea level pressure and north-central Pacific 850mb wind gradient. In what way does this not look at global climate?

Moreover, the IMD and the agencies of the MoES (notably the Indian Institute of Tropical Meteorology) work closely regionally and internationally on climate science, weather prediction and monitoring. Not only is the IMD implementing for the World Meteorological Organisation (WMO) a Regional Climate Centre for South Asia, the monsoon prediction and monitoring system relies on collaboration with: the National Centers for Environmental Prediction (NCEP) of USA, the European Centre for Medium-Range Weather Forecasts (ECMWF), the Japan Meteorological Agency (JMA), the Met Office Hadley Centre for Climate Science and Services of UK, and with the national meteorological agencies of Bangladesh, Bhutan, the Maldives, Myanmar, Nepal, Pakistan, and Sri Lanka.

And furthermore, it is because the Earth System Science Organisation agencies and institutes revise, review and upgrade forecasting models, computing wherewithal and methods continuously that we have in 2016 an experimental forecast (based on the Monsoon Mission coupled dynamical model).

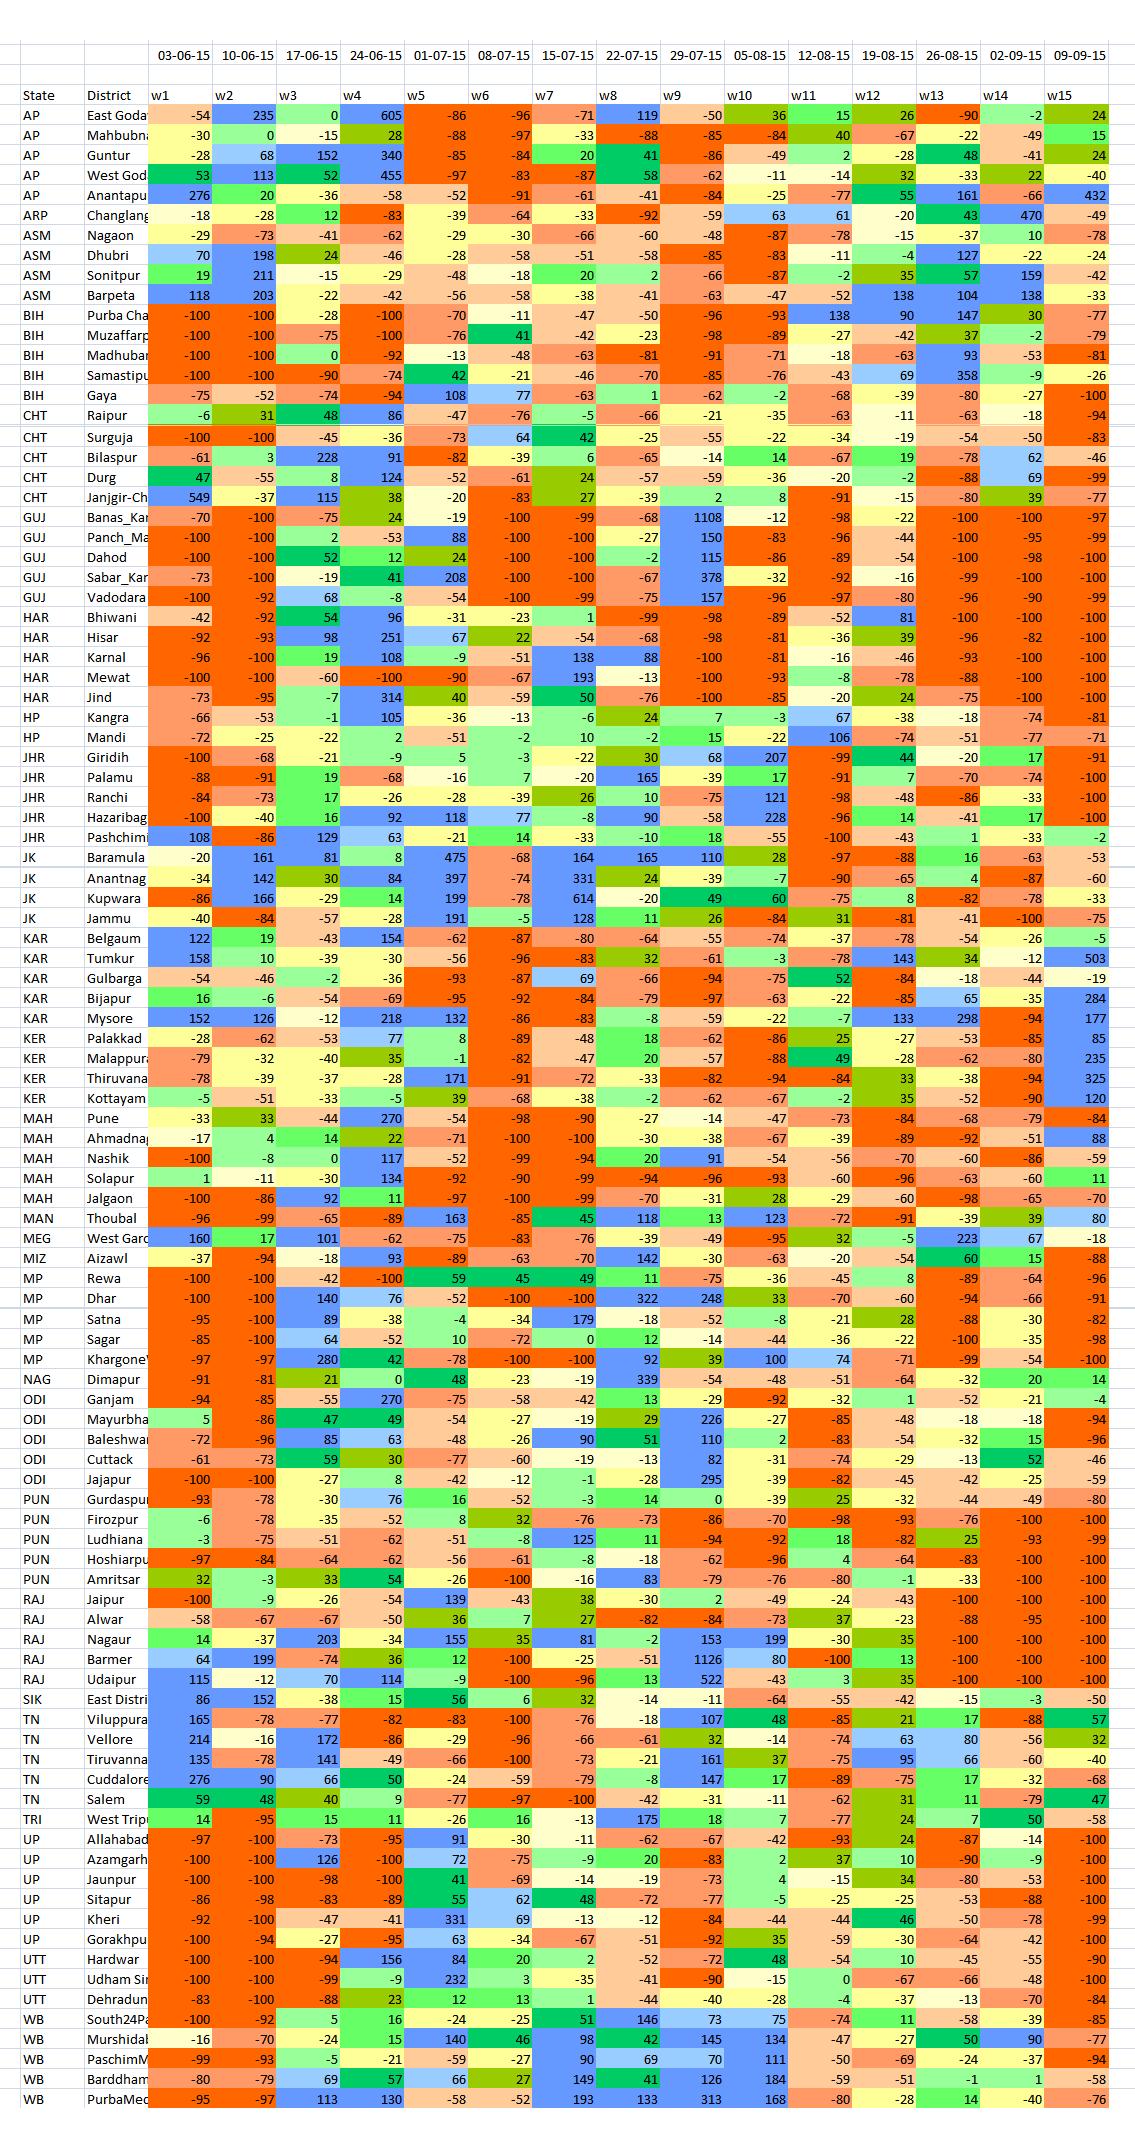
‘The Hindu’ newspaper has presented its own uninformed reading of differences in forecast averages to make an absurd claim against the IMD, neglecting entirely to mention the extremely valuable service provided, at the district and even at the block level, to Bharat’s kisans via daily sms on weather which will affect crops; neglecting the several excellent initiatives launched by the Department since 2015 on localising forecasts for towns and cities (in close coordination with the National Remote Sensing Centre of the Indian Space Research organisation, the Meteorological and Oceanographic Satellite Data Archival Centre of ISRO’s Space Applications Centre, and the Indian National Centre for Ocean Information Services.

Filed Under: Blogs Tagged With: 2016, Bharat, forecast, IMD, India, monsoon, weather

Monsoon weekly report card 2016

August 18, 2016 by Climate portal editor Leave a Comment

ICP_district_rainweeks_20160818

Employing the modified rainfall measurement categories, we have prepared a ‘report card’ for ten weeks of rainfall beginning with the week 02-08 June and continuing until the most recent which is the week of 04-10 August. This ‘report card’ is based on the recorded rainfall for each district and how much it varies from the normal for that particular week. This variation is portrayed by our ‘report card’ through the modified categories, which are designed to show more finely not merely deficient or excess rainfall, as the current categories do, but the degree of deficiencies or excesses for that district, for that week.

ICP_RG_2016_district_10rainweeks_20160818

Our indicator of eleven grades (compared with the four of the India Meteorological Department, IMD) uses the same weekly district data to provide greater detail about rainfall adequacy or lack. Using this method we can immediately see from the chart:

1. From the week ending 22 June there have been a large number of districts – between 20% and 40% of all districts for which data is available – included in the four categories that describe rainfall of +20% above the normal.

2. That notwithstanding the overall seasonal prediction of monsoon 2016 having thus far been proved correct, there are almost every week a sizeable number of districts falling in the three categories for deficient rainfall.

3. That for the ten weeks in our report card the number of districts in the -21% to -40% below normal band is greater than the number of districts in the band for +21% to +40%.

ICP_district_rainweeks_table_20160818

In the chart, each bar corresponds to a week of district rainfall readings, and that week of readings is split into eleven grades (plus one for no data). In this way, the tendency for administrations, citizens, the media and all those who must manage natural resources (particularly our farmers), to think in terms of an overall ‘deficit’ or an overall ‘surplus’ is halted.

We find that our modified rainfall categories are more informative at the district level – and therefore cumulatively at the state and meteorological sub-division levels too  – and can readily be adopted by administrations and planners.

In today’s concerns that have to do with the impacts of climate change, with the increasing variability of the monsoon season, and especially with the production of food crops, the IMD’s stock measurement – ‘normal’ is rainfall up to +19% above a given period’s average and also down to -19% from that same average, ‘excess’ is +20% rain and more, ‘deficient’ is -20% to -59% and ‘scanty’ is -60% to -99% – is no longer viable.

Filed Under: Latest, Monsoon 2016 Tagged With: 2016, district, IMD, India, monsoon

Heavy rain alert for Bihar, Uttar Pradesh

July 19, 2016 by Climate portal editor Leave a Comment

ICP_UP_BIH_20160719

Heavy and very heavy rainfall is expected today 19 July and until 22 July in Bihar, eastern Uttar Pradesh and sub-Himalayan West Bengal. The India Meteorological Department has issued a heavy rainfall alert for these regions.

These are the districts which will be the most affected:
In Bihar – Paschim Champaran, Gopalganj, Purbi Champaran, Siwan, Chhapra, Muzaffarpur, Sitamarhi, Madhubani, Darbhanga, Supaul, Saharsa, Madhepura, Purnia, Katihar, Kishanganj, Araria.
In Uttar Pradesh – Pilibhit, Shahjahanpur, Kheri, Hardoi, Sitapur, Shrawasti, Bahraich, Gonda, Balrampur, Basti, Sidharthnagar, Sant Kabir Nagar, Gorakhpur, Deoria, Maharajganj, Kushinagar.

ICP_ncmrwf_UP_bihar_20160719

These are the five river sub-basins of the Ganga basin which are affected:
Gomti – including the Kathna, Sarayan, Kalyani rivers. Cities in this sub-basin – Sitapur, Hardoi, Lucknow, Rae Bareli, Sultanpur, Jaunpur.
Ghaghara – including the Saryu, Rapti, Chhoti Gandak rivers. Cities in this sub-basin – Lakhimpur, Shrawasti, Gonda, Faizabad, Basti, Gorakhpur, Kushinagar, Deoria, Siwan, Ballia.
Ghaghara confluence to Gomti confluence – including Chhoti Saryu and Mangal rivers. Cities in this sub-basin – Faizabad, Nizamabad, Azamgarh, Mau, Ghazipur, Buxar, Bhojpur, Chandauli.
Kosi – including Kamala, Pipra, Dhemra rivers. Cities in this sub-basin – Sheohar, Sitamarhi, Darbhanga, Supaul, Madhepura, Saharsa, Kishanganj, Khagaria.
Bhagirathi – including Fariyani Nadi and Kamla rivers. Cities in this sub-basin – Araria, Purnia, Sahibganj, Malda (West Bengal).

In the Middle Ganga plains, the water drainage lines govern the human occupancy of land, particularly the agricultural land and settlements. The rivers meet at acute angles and several tributaries form parallel or sub-parallel lines to the main stream. The major rivers that meet the main stream in the middle plain are the Gandak, the Kosi, the Sone and other small tributaries of Ganga like the Tons, the Karmansa, the Chatar, the Jargo, the Karnauti, the Khejuri on the west of the Sone and those on the east of the Sone are the Punpun, the Mohini and the Chandan.

Floods are recurring feature in this region particularly in the North Ganga plains. Almost all rivers in this middle plain develop a capacity to spill over in the monsoon period and are notoriously dynamic in character, particularly the Rapti, the Ghaghara, the Gandak, the Kosi, the Sone and the main Ganga itself.

Filed Under: Latest, Monsoon 2016 Tagged With: 2016, basin, Bihar, flood, Ganga, India, monsoon, rain, Uttar Pradesh

Rivers before states

June 29, 2016 by Climate portal editor Leave a Comment

2016-06-29_192703

Our view of where water falls during the monsoon and where it is used has tended to follow the administrative unit view. That is, which state has experienced normal, above normal or deficient rainfall or which meteorological division has experienced normal, above normal or deficient rainfall.

Such a view has obscured an important ground reality, and this is that when it rains, surface water follows the contours and topography of watersheds and third-level basins, themselves subsets of sub-basins and then river basins. Thus when rain falls, water collects and begins to flow, it is natural to look for where it flows and where it may be collected instead of whether it is measured on one side or another of an imaginary boundary, which is what a district or state boundary is.

Rainfall anomalies in millimetres for 01-26 June. Greens/blues are above, browns/ochres are below. This section which includes Maharashtra, Madhya Pradesh, Chhattisgarh, Jharkhand, Bihar, Uttar Pradesh and part of Rajasthan shows how deficient areas are interspersed with excess areas. Watersheds could be the answer. Image source: NCEP, CPC

Rainfall anomalies in millimetres for 01-26 June. Greens/blues are above, browns/ochres are below. This section which includes Maharashtra, Madhya Pradesh, Chhattisgarh, Jharkhand, Bihar, Uttar Pradesh and part of Rajasthan shows how deficient areas are interspersed with excess areas. Watersheds could be the answer. Image source: NCEP, CPC

For everything that concerns water – which does mean everything that is essential to us: agriculture, forests, grassy regions and orchards, water that can be used for drinking, rural and urban settlements, commerce and industry – it is the group of hydrological structures we call a river basin (or sub-basin if the basin is a large one) that becomes the spatial region to study and plan for.

We have 36 states and union territories and also 36 meteorological divisions. These correspond with each other for most of the country and this correspondence, unnecessary and misleading, has led to our incorrect view of where rain falls and how it behaves where it falls. It has been a persistent error because I think of administrative inertia combined with the quite needless politics that surrounds river (or surface) and ground water.

Rain falls upon and rainwater collects and moves surface water then not in a taluka or district, but in a biophysical region which in one way we can describe as a river sub-basin or a large watershed. There are other pieces that make the whole: type of soil, the underlying geological strata, the mix of vegetation, the density and health of forests, the mix of cultivated crops, and the spread and density of human settlements (which use and alter these pieces).

Rainfall as estimated by Insat-3D and mapped in daily images for 14-28 June 2016. The background is the major river basins, not states (click for 386kb full res). The IMD's RAPID system has this monsoon introduced river basins as a base map. Images source: IMD/ISRO RAPID

Rainfall as estimated by Insat-3D and mapped in daily images for 14-28 June 2016. The background is the major river basins, not states (click for 386kb full res). The IMD’s RAPID system has this monsoon introduced river basins as a base map. Images source: IMD/ISRO RAPID

Table of river basins and sub-basins with sizes. Source: WRIS

Table of river basins and sub-basins with sizes. Source: WRIS

We know which our major rivers are, and those of us who are curious enough about the biophysical pieces that determine the characteristics of the regions in which we live also know the names of lesser rivers. How many river sub-basins are there in Bharat?

There are several answers because there have been (and continue to be) several authorities whose work it is to assess and measure water. Their methodologies differ somewhat each from the other, and that is why they not only give us differing numbers of major river basins but also – for those basins whose names are the same – differing sizes for a single river basin.

The Water Resources Information System (WRIS) which is the newest methodical system and which has come about because of our remote sensing expertise, has the most detailed information about our river basins. There are also the Central Water Commission, the National Commission for Integrated Water Resources Development Plan, the All India Soil and Land Use Survey, and the Central Ground Water Board.

Depending on their thematic orientation, these have (in their early forms which date back to the late 1940s) conducted detailed surveys of river basins and districts, outlined hydrological units, catchment zones, river valley projects, watersheds and have through such mechanisms steered (at times forced) states into recognising that river basins are at least as important as state boundaries.

How many are there? The WRIS informs us that there are 26 river basins and 102 sub-basins. Thus there are about three times as many sub-basins as there are states (and UTs) and there is one sub-basin for about every six districts. The biggest river basins are those of the Ganga (808,334 square kilometres), the Indus (till the border, 453,931 sq km), Godavari (302,063 sq km) and Krishna (254,743 sq km). The 102 sub-basins have a median size (excluding the very smallest) of 29,200 sq km and range from 1,676 sq km to 99,040 sq km for the Brahmaputra Upper and 125,084 sq km for the Yamuna Lower basins. The larger sub-basins (there are 14 whose geographic sizes are more than 50,000 sq km) contain dozens of watersheds each (there are some 3,200 in Bharat).

In the small hydrological units that we call watersheds, and in the larger ones we call sub-basins and river basins, is where the rain falls and where it needs to be measured and counted. This our earth sciences agencies already do. It is up to us and up to administrators of districts, states and particularly of all Class I and larger cities to alter the manner in which we look at the water that falls in this wondrous season upon our earth.

— Rahul Goswami

Filed Under: Latest, Monsoon 2016 Tagged With: India, monsoon, river, State, water

A race between monsoon and water

June 1, 2016 by Climate portal editor Leave a Comment

ICP_reservoirs_20160601

The southern states of Tamil Nadu, Karnataka, Andhra Pradesh and Telengana are in dire need of rainwater to replenish exceedingly low levels in reservoirs and all surface water structures. This water has come in the form of showers over the past five or six days, although the spread of the rainfall has been patchy, and whether rainwater has collected in significant quantities and percolated into sub-soil aquifers will not be known for at least another week.

Until 31 May 2016 the stored water situation as measured by the quantities recorded in the 91 major reservoirs of India was very grave indeed. The most recent weekly bulletin of the Central Water Commission, which monitors what is called the ‘live storage status’ of the 91 major reservoirs, was issued on 26 May. Out of the 91 reservoirs, 37 have hydro-electric power plants which deliver electricity to the states in which these reservoirs are and to the national grid.

The total ‘live storage’ capacity of these 91 reservoirs is 157.799 billion cubic metres (BCM) which is estimated as being about 62% of the total storage capacity of 253.388 BCM that is estimated to have been built or created. But the 26 May bulletin placed the total storage available in these reservoirs at 26.816 BCM, which is 17% of the total of 91 reservoirs. At this time in 2015, the total stored water was 49.119 BCM and the average of the last 10 years of storage at this time was 33.764 BCM. Thus, the stored water for the week ended 26 May is 55% of the quantity stored in 2015 and 79% of the quantity stored at this time averaged for the last ten years.

ICP_reservoir_trends_20160601

The Northern region is Himachal Pradesh, Punjab and Rajasthan. There are six reservoirs with total live storage capacity of 18.01 BCM. By 26 May the total storage in these reservoirs was 3.91 BCM which is 22% of the total live storage capacity. The stored volume at the corresponding period in 2015 was 43% and the stored volume of the average corresponding period of the last ten years was 29%.

The Eastern region is Jharkhand, Odisha, West Bengal and Tripura. There are 15 reservoirs with total live storage capacity of 18.83 BCM. By 26 May the total live storage in these reservoirs was 4.22 BCM which is 22% of total live storage capacity. The stored volume at the corresponding period in 2015 was 34% and the stored volume of the average corresponding period of the last ten years was 20%.

The Western region is Gujarat and Maharashtra. There are 27 reservoirs with total live storage capacity of 27.07 BCM. By 26 May the total live storage in these reservoirs was 3.90 BCM which is 14% of total live storage capacity. The stored volume at the corresponding period in 2015 was 26% and the stored volume of the average corresponding period of the last ten years was also 26%.

The Central region is Uttar Pradesh, Uttarakhand, Madhya Pradesh and Chhattisgarh. There are 12 reservoirs with total live storage capacity of 42.30 BCM. By 26 May the total live storage available in these reservoirs is 9.59 BCM which is 23% of total live storage capacity. The stored volume at the corresponding period in 2015 was 33% and the stored volume of the average corresponding period of the last ten years was 18%.

The Southern region is Andhra Pradesh, Telengana, combined projects in both states, Karnataka, Kerala and Tamil Nadu. There are 31 reservoirs with total live storage capacity of 51.59 BCM. By 26 May the total live storage available in these reservoirs was 5.21 BCM which is 10% of total live storage capacity. The stored volume at the corresponding period in 2015 was 27% and the stored volume of the average corresponding period of the last ten years was 20%.

Filed Under: Latest, Monsoon 2016 Tagged With: 2016, Bharat, dams, India, monsoon, reservoir, water

Monsoon outlook for June and July

May 29, 2016 by Climate portal editor Leave a Comment

ICP_monsoon2016_20160529

At the end of May 2016, based on a reading of the seasonal forecasts of our Earth System Science Organisation group (under the Ministry of Earth Sciences) and complemented by the collaborative seasonal forecasts of the NOAA Center for Weather and Climate Prediction, we have prepared an outlook for the June and July monsoon 2016 months.

The regional rainfall outlook for June and July 2016. Green hues are +0.25 to +1mm/day averaged over the outlook period.

The regional rainfall outlook for June and July 2016. Green hues are +0.25 to +1mm/day averaged over the outlook period.

The outlook shows: (1) that our main concern of whether the first stage monsoon forecast of the IMD remains true is fulfilled, which is, that the 2016 monsoon will be normal (and better than normal in some regions); (2) that our next most important concern of whether any region will have significantly below normal rainfall is also addressed, and under the current forecasts there is no such region; (3) that the June and July rains will be at least normal in most states and meteorological sub-divisions.

Some provisos need to be observed. The seasonal forecasts are released for three month spells (May to July, June to August, and so on). Depending on the kind of modelling that is followed (and there are several) the outlooks are updated or modified every 10 days to fortnightly to monthly. These updates are based on what are called ‘initial conditions’ which for our current outlook is the first half of May.

Here is a more detailed regional outlook for June and July 2016:
• Tamil Nadu and Kerala will have rain that over the season is +1 to +1.25mm/day.
• Karnataka, Andhra Pradesh and Telengana, Madhya Pradesh, most of Maharashtra, all the states of northern and north-west India, Uttar Pradesh and Bihar, Sikkim, Arunachal, lower Assam, western Meghalaya, and Lakshadweep will have rain that that over the season is +0.25 to +1 mm/day.
• Odisha, Chhattisgarh, southern Jharkhand, gangetic West Bengal, eastern Vidarbha (Maharashtra), the north-eastern half of Telengana, north coastal Andhra Pradesh, upper Assam, Nagaland, Manipur, Mizoram and Tripura will have rain that over the season is -0.2 to +0.25mm/day and Andaman and Nicobar islands will have rain that is up to -0.5 mm/day.

This outlook we will amend between June 10 and 15 as the ESSO’s forecasts and international collaborative monsoon forecasts are updated.

Filed Under: Current, Monsoon 2016 Tagged With: 2016, climate, forecast, India, monsoon, season

Normal to good monsoon likely

April 10, 2016 by Climate portal editor 1 Comment

ICP_RG_monsoon_forecast1

The Indian summer monsoon in 2016 for the months of June to September will be normal to above normal in almost all the meteorological sub-divisions.

This is our reading of the seasonal climatic predictions provided by five different sources, amongst them the India Meteorological Department (IMD), which themselves are based on ensembles of forecasts.

Our outlook for the June to September 2016 period is based on an initial study of the three-monthly and seasonal predictions which are in the public domain, from the following agencies:

India monsoon 2016

A mapping of the forecast by one predictive climate model, for the May to July period. Source: NOAA/NCEP

The Climate Prediction and Monitoring Group of the India Meteorological Department (IMD), Ministry of Earth Sciences, Government of India; the  Climate Forecast System Version 2 (CFSv2) by the Climate Prediction Center of the National Centers for Environmental Prediction (NCEP), USA; regionalised Multi-Model Ensemble (NMME) forecasts from the Climate Prediction Center which are based on models of the NOAA and NASA; and the Meteorological ‘Met’ Office of Britain which is a World Meteorological Organisation climate research centre.

Combining the indications from this early set of forecasts we see that when typical monsoon conditions have set in over southern and peninsular India, the June and July rainfall patterns should be normal for June with an increase in average rainfall for July (in the southern peninsula, the west coast, north-eastern states and the north India mountainous states). The models currently also point to the August and September period recording above normal rainfall over most of India, and normal rainfall in central India.

The climatic prediction models whose forecasting products we have examined make their predictions for 90-day periods (such as May, June and July together) based on conditions observed and calculated for a given month (January, February and March so far). We will consolidate and expand the scope of this initial prognosis – which is of a normal to above normal monsoon – as these forecasts are updated.

Filed Under: Latest, Monsoon 2016 Tagged With: 2016, climate, India, meteorology, monsoon, rain, season, summer monsoon

From space, a district and its water

October 9, 2015 by Climate portal editor 3 Comments

RG_ICP_water_district_map_201510

In this panel of maps the relationship between the district of Parbhani (in the Marathwada region of Maharashtra) and water is graphically depicted over time. The blue squares are water bodies, as seen by a satellite equipped to do so. The intensity of the blue colour denotes how much water is standing in that coloured square by volume – the deeper the blue, the more the water.

Water bodies consist of all surface water bodies and these are: reservoirs, irrigation tanks, lakes, ponds, and rivers or streams. There will be variation in the spatial dimensions of these water bodies depending on how much rainfall the district has recorded, and how the collected water has been used during the season and year. In addition to these surface water bodies, there are other areas representing water surface that may appear, such as due to flood inundations, depressions in flood plains, standing water in rice crop areas during transplantation stages. Other than medium and large reservoirs, these water features are treated as seasonal and some may exist for only a few weeks.

RG_ICP_water_district_map_201510_section

Click for a section of the full size image. The detail can be mapped to panchayat level.

The importance of monitoring water collection and use at this scale can be illustrated through a very brief outline of Parbhani. The district has 830 inhabited villages distributed through nine tehsils that together occupy 6,214 square kilometres, eight towns, 359,784 households in which a population of 1.83 million live (1.26 rural and 0.56 million urban). This population includes 317,000 agricultural labourers and 295,000 cultivators – thus water use and rainfall is of very great importance for this district, and indeed for the many like it all over India.

This water bodies map for Parbhani district is composed of 18 panels that are identical spatially – that is, centred on the district – and display the chronological progression of water accumulation or withdrawal. Each panel is a 15-day period, and the series of mapped fortnights begins on 1 January 2015.

The panels tell us that there are periods before the typical monsoon season (1 June to 30 September) when the accumulation of water in surface water bodies has been more than those 15-day periods found during the monsoon season. See in particular the first and second fortnights of March, and the first fortnight of April.

During the monsoon months, it is only the two fortnights of June in which the accumulation of water in the surface water bodies of Parbhani district can be seen. The first half of July and the second half of August in particular have been recorded as relatively dry.

This small demonstration of the value of such information, provided at no cost and placed in the public domain, is based on the programme ‘Satellite derived Information on Water Bodies Area (WBA) and Water Bodies Fraction (WBF)’ which is provided by the National Remote Sensing Centre (NRSC), Indian Space Research Organisation (ISRO), Department of Space, Government of India.

For any of our districts, such continuous monitoring is an invaluable aid to: facilitate the study of water surface dynamics in river basins and watersheds; analyse the relationships between regional rainfall scenarios and the collection and utilisation of water in major, medium reservoirs and irrigation tanks and ponds; inventory, map and administer the use of surface water area at frequent intervals, especially during the crop calendar applicable to district and agro-ecological zones.

Filed Under: Blogs, Monsoon 2015 Tagged With: agriculture, district, ISRO, Maharashtra, monsoon, NRSC, rain, remote sensing, reservoir, river, rural, space, town, urban, village, water

Where they waited for rain in 2015

September 18, 2015 by Climate portal editor 1 Comment

RG_ICP_20150918

With two weeks of the June to September monsoon remaining in 2015, one of the end-of-season conclusions that the India Meteorological Department (IMD) has spoken of is that four out of ten districts in the country has had less rainfall than normal.

This overview is by itself alarming, but does not aid state governments and especially line ministries plan for coming months, particularly for agriculture and cultivation needs, water use, the mobilisation of resources for contingency measures, and to review the short- and medium-term objectives of development programmes.

RG_ICP_100districts_table_20150918The detailed tabulation provided here is meant to provide guidance of where this may be done immediately – in the next two to four weeks – and how this can be done in future.

The table lists 100 districts each of which have readings 15 weeks of rainfall variation – the numbers are not rainfall in millimetres (mm) but the variation in per cent from the long-term normal for that district for that week. The colour codes for each district’s week cell are the same as those used for the new 11-grade rainfall categorisation.

The districts are chosen on the basis of the size of their rural populations (calculated for 2015). Thus Purba Champaran in Bihar, Bhiwani in Haryana, Rewa in Madhya Pradesh and Viluppuram in Tamil Nadu are the districts in those states with the largest rural populations.

In this way, the effect of rainfall variability, from Week 1 (which ended on 3 June) to Week 15 (which ended on 9 September), in the districts with the largest rural populations can be analysed. Because a large rural population is also a large agricultural population, the overall seasonal impact on that district’s agricultural output can also be inferred.

The distribution of the districts is: six from Uttar Pradesh; five each from Andhra Pradesh, Bihar, Chhattisgarh, Gujarat, Haryana, Jharkhand, Karnataka, Maharashtra, Madhya Pradesh, Odisha, Punjab, Rajasthan, Tamil Nadu and West Bengal; four each from Assam, Jammu and Kashmir, and Kerala; three from Uttarakhand; two from Himachal Pradesh; one each from Arunachal Pradesh, Manipur, Meghalaya, Mizoram, Nagaland, Sikkim and Tripura.

Using the new 11-grade rainfall categorisation, a normal rainweek is one in which the rainfall is between +10% more and -10% less for that week. The overview for this group of 100 districts, only 11 have had five or more normal weeks of rain out of 15 weeks. In alarming contrast, there are 77 districts which have had three or fewer normal weeks of rain – that is, more than three-fourths of these most populous districts. Half the number (51 districts) have had two, one or no normal weeks of rain. And 22 of these districts have had only one or no normal weeks of rain.

From this group of 100 most populous (rural population) districts Gorakhpur in Uttar Pradesh and Nagaon in Assam have had the most deficit rainweeks, tallying 13, out of the 15 tabulated so far. There are ten districts which have had 12 deficit rainweeks out of 15 and they are (in decreasing order of rural population): Muzaffarpur (Bihar), Pune and Jalgaon (Maharashtra), Surguja (Chhattisgarh), Panch Mahals and Vadodara (Gujarat), Firozpur (Punjab), Thiruvananthapuram (Kerala), Hoshiarpur (Punjab) and Mewat (Haryana).

– Rahul Goswami

Filed Under: Monsoon 2015, Reports & Comment Tagged With: agriculture, district, IMD, India, monsoon, population, rain, rural, urban, water

Lessons of monsoon 2015 for district India

September 16, 2015 by Climate portal editor 2 Comments

ICP_rainweek_commentary_20150916

By our conventional method of reckoning the adequacy of the 2015 monsoon, this is a year that is amongst the most deficient in rain over a period of 20 years. The monsoon season began late, compared with its usual onset, and apart from a few sustained heavy spells in a few locations, has been less than adequate and also less than normal in every one of our 36 meteorological sub-divisions.

When after eight weeks of the conventional monsoon season it became evident that a combination of factors was causing weak and erratic rainfall, that is when the central and state governments needed to place on alert the regions that were already facing rainfall deficits. At this point, when we have the evidence provided by data for 15 weeks of the monsoon season (until 9 September), every week from early August onwards that passed without such a declaration is a week of preparation and coping lost.

In this commentary, I have described the advantages of using a new methodology that grades rainfall adequacy at the level of the district, to a degree that is very much finer than the five categories of the India Meteorological Department (IMD), which are: normal, excess, deficient, scanty and no rain. The outputs from this methodology (illustrated and described here) are designed to: (1) alert national food and agriculture administrators to impending food insecurity conditions; (2) alert national water resources administrators to impending water scarcities; (3) alert line departments of state ministries and district collectorates to the build up of climatological distress at the district level so that contingency measures can be taken.

RG_2015_rainweek_graphic3Over the conventional season (1 June to 30 September) the inadequacy of rainfall in 2015 is revealed at a glance by the weekly rain report. It makes for a very alarming picture and shows that state administrations and especially district authorities should, by the sixth week which ended on 8 July, have made arrangements to prepare for below-normal rains. In the weekly rain report, each vertical bar corresponds to a week of districts categorised into eleven grades. This provides a weekly national barometer of the number of districts that are in the lower and upper (severely below and above normal rainfall) categories during a given week.

Such a weekly rainfall adequacy report is able to quickly put a stop to the recent tendency of administrations, the media and all those who must manage natural resources (particularly our farmers), to think in terms of an overall seasonal ‘deficit’ or an overall seasonal ‘surplus’. This ‘seasonal’ view must be abandoned because demands for water are not cumulative – they are made several times a day, and become more or less intense according to a cropping calendar, which in turn is influenced by the characteristics of a river basin and of a corresponding agro-ecological zone, and the rural and urban populations in a district.

The difference between the IMD five-grade assessment and the eleven-grade categorisation of rainfall becomes immediately apparent when a comparison is made for any given week. The data source is the same – the weekly tabulation compiled by the IMD’s Hydromet Division (which from this monsoon season provides the data sheets and detailed maps on its ‘customised rainfall information system’, or CRIS, website).

RG_ICP_grade_systems_comparedWeek 11 of the monsoon season, which is the week until 12 August, provides such an example. Under the five-grade IMD scale, there were 114 districts with normal rain (from -19% to +19%). Under the 11-grade new categorisation, the middle grade is -10% to +10%, and included 66 districts. Under the five-grade IMD scale districts with below normal rainfall fall under deficient (-20% to -59%) or under scanty (-60% to -99%) and for this week the number of districts respectively were 155 and 223. Under the 11-grade new categorisation, there are four grades for below-normal rainfall that is -20%.

Thus while the ‘deficient’ grade includes 155 districts, under the 11-grade system there are 150 districts distributed between two grades – 84 and 66, but we see that a larger number of districts fall in the more severe of the two grades. The signal to be derived from this, at the state and districts administration level, is that if a district remains for two to three weeks at a grade, then contingency measures must be reviewed, readied or rolled out. This is a decision that becomes considerably easier with the 11-grade system when compared with the existing five-grade system.

In the same way, the week by week tabulation of districts under the 11-grade system reveals trends and patterns that are not visible under the existing IMD five-grade assessment. The table shows the distribution of districts by grade across weeks. In each week, the two grades that account for the largest number of districts are highlighted red. We see that for the the first five rain weeks – week ending 3 June to week ending 1 July – the +81% and above grade was one of the top two populated grades. This occurred once more for Week 7, ending 15 July. For the next eight rain weeks – ending 22 July to ending 9 September – the top two populated grades have been in the rainfall grades of -41% to -60%, -61% to -80% and -81% and less. At the country level, this starkly underlines the seriousness of the rainfall deficit.

RG_ICP_weekly_tableThe uses to which we have put available climatic observations no longer suit an India which is learning to identify the impacts of climate change. Until 2002, the monsoon season was June to September, there was an assessment in May of how well (or not) the monsoon could turn out.

The India Meteorology Department has added computational and analytical resources furiously over the last decade. The new research and observational depth is complemented by the efforts of a Ministry of Earth Sciences which has channelled the copious output from our weather satellites, under the Indian Space Research Organisation (ISRO), and which is interpreted by the National Remote Sensing Centre (NRSC), to serve meteorological needs.

The IMD, with 559 surface observatories, 100 Insat satellite-based data collection platforms, an ‘integrated agro-advisory service of India’ which has provided district-level forecasts since 2008, a High Performance Computing System commissioned in 2010 (whose servers run at Pune, Kolkata, Chennai, Mumbai, Guwahati, Nagpur, Ahmedabad, Bengaluru, Chandigarh, Bhubaneswar, Hyderabad and New Delhi) intelligently consumes an astonishing amount of numerical data every hour.

Over the last four years, more climate and weather ‘products’ (as the IMD system calls them) based on this data and their interpretations have been released via the internet into the public domain. These are reliable, timely (some observation series have even three-hour intervals), and valuable for citizen and administrator alike.

Even so, the IMD’s framing of how its most popular measures are categorised is no longer capable of describing what rain – or the absence of rain – affects our districts. These popular measures are distributed every day, weekly and monthly in the form of ‘departures from normal’ tables, charts and maps. The rain adequacy categories are meant to guide alerts and advisories.

These number four: ‘normal’ is rainfall up to +19% above a given period’s average and also down to -19% from that same average, ‘excess’ is +20% rain and more, ‘deficient’ is -20% to -59%, ‘scanty’ is -60% to -99%, and ‘no rain’ is -100%. These categories can mislead more than they inform, for the difference between an excess of +21% and an excess of +41% can be the difference between water enough to puddle rice fields and a river breaking its banks to ruin those fields.

In today’s concerns that have to do with the impacts of climate change, with the increasing variability of the monsoon season, and especially with the production of food crops, the IMD’s stock measurement ‘product’ is no longer viable. It ought to have been replaced at least a decade ago, for the IMD’s Hydromet Division maintains weekly data by meteorological sub-division and by district. This series of running records compares any given monsoon week’s rainfall, in a district, with the long period average (a 50-year period). Such fineness of detail must be matched by a measuring range-finder with appropriate  interpretive indicators. That is why the ‘no rain’, ‘scanty’, ‘deficient’, ‘normal’ or ‘excess’ group of legacy measures must now be replaced. In its place an indicator of eleven grades translates the trends, patterns and messages in IMD’s district-level rainfall data into meaningful and actionable signals.

– Rahul Goswami

Notes

The new 11-grade indicator for assessing weekly rainfall departures in districts uses the same data IMD releases into the public domain, but provides dramatically more useful guidance. This yields the detailed reading required to alert state administrations to drought, drought-like and potential flood conditions. The modified methodology adapts the UN Food and Agriculture Organisation’s ‘Global Information and Early Warning System’ employment of 11 grades.

The weekly tallies of rainfall distribution for meteorological sub-divisions and for states are no longer able to signal administrative action and must be replaced with district-scale and (by 2016 monsoon) urban-scale assessments. The ability of the new 11-grade methodology to provide early warnings of climatic trauma in districts is now clear, and state administrations can respond to growing climatological distress in a targeted manner. Districts and blocks need to be supplied rainfall trends – and not only distribution data – that help farmers and administrators alike better plan for rainfall variability.

Filed Under: Current, Monsoon 2015 Tagged With: 2015, agriculture, district, India, monsoon, rain, water

  • « Previous Page
  • 1
  • 2
  • 3
  • 4
  • 5
  • Next Page »

Indiaclimate twitter

Tweets by @Indiaclimate

Notable

Between contemplation and climate

Whether or not the USA, Europe, the Western world, the industrialised Eastern world (China, Japan, South Korea, Taiwan), adhere to or not their paltry promises about being more responsible concerning the factors that lead to climate change, is of very little concern to us. We have never set any store by international agreements on climate […]

The ‘Hindu’, ignorant about weather and climate, but runs down IMD

We find objectionable the report by ‘The Hindu’ daily newspaper accusing the India Meteorological Department of scientific shortcoming (‘IMD gets its August forecast wrong’, 1 September 2016). The report claims that the IMD in June 2016 had forecast that rains for August would be more than usual but that the recorded rain was less than […]

dialogue

  • Misreading monsoon | Resources Research on Misreading monsoon
  • Satish on A tribute to the weathermen of Bharat
  • Climate portal editor on A tribute to the weathermen of Bharat
  • Climate portal editor on A tribute to the weathermen of Bharat
  • Climate portal editor on A tribute to the weathermen of Bharat

Categories

Copyright © 2025 indiaclimateportal.org.