Sea level rise in the Solomon Islands is nearly three times the global average and low lying island communities are facing threats to food security and freshwater resources. Image: Thomson Reuters Foundation / Catherine Wilson
By the time the 20th meeting of any group comes around, one would think, questions such as “where will the money come from” ought to have been sorted out. Not apparently when it comes to international negotiations on climate change. The meeting which has been running since 1 December 2014 (and which is to end on the 12th), has not only failed to find enough sources of money so that countries can deal with the effects of climate change, it has also seen some searching questions being asked about what climate finance and green funds are in the first place.
This should be troubling to the thousands who have gathered in Lime, the capital of Peru, to discuss (for the 20th year running), a coordinated international response to the effects and impacts of climate change. Such questions – which are fundamental in nature and inconveniently reveal the deep disagreements between countries and between finance professionals – should not have been raised at this stage of the UN climate change negotiation process.
But they have been, and the delegates and representatives and, it must be said, opportunists of all shades who gather at such meetings are caught in a cleft stick. On the one hand, there is the ‘progress’ claimed by the UN Framework Convention on Climate Change (the UNFCCC) that substantial and real progress has been made in finding assured sums of money so that ‘developing’ and ‘less developed’ countries particularly can be supported in their efforts to tackle the effects of climate change (more floods, worse droughts, new diseases).
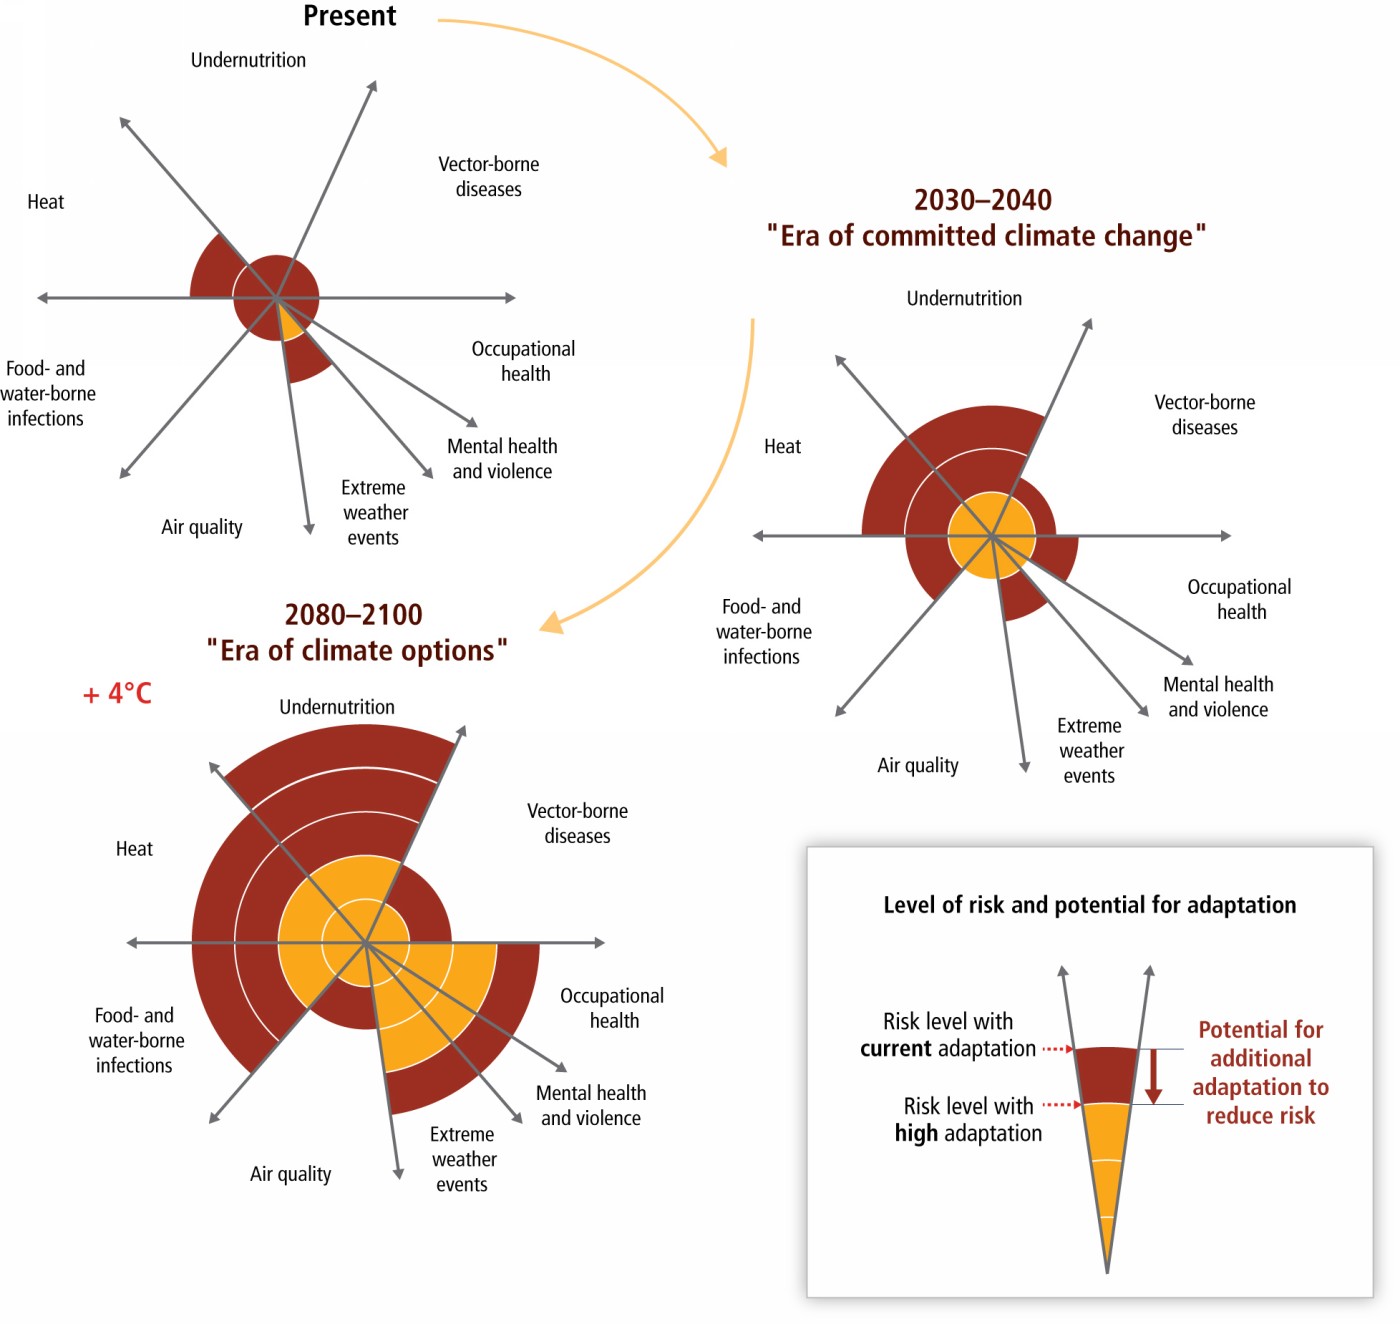
Level of risk and potential for adaptation, from the IPCC Fifth Assessment Report, 2014
Prakash Javadekar, Minister for Environment, said there is a need to ensure “an ambitious, comprehensive, equitable and balanced agreement in 2015 that takes into account the huge development needs, including access to financial resources and low carbon technological options for developing countries”. With such a declaration Javadekar has opened wide the door to interpretations of ‘comprehensive’, ‘equitable’, ‘balanced’ and ‘development needs’ in ways that very likely will add to the problem.
Nor does this help lighten the view, now apparently held by the western and ‘developed’ (that is, the EU, the OECD and in particular western Europe and north America) countries that India is resisting changes to the UNFCCC being attempted by them, such as reviews of what are called intended nationally determined contributions (INDCs) that will be declared by developing countries by June, 2015.
Other than disagreement in various tones and at different pitches, all countries have committed to sign a new climate agreement in Paris at the end of 2015, pledging climate action beyond 2020. So the UN has said, and if this is meant to show progress, in the usual roundabout UN manner, then the months between the Lima meeting and the Paris meeting will be spent by armies of administrators cooking up successfully consensual texts that reek of progress.
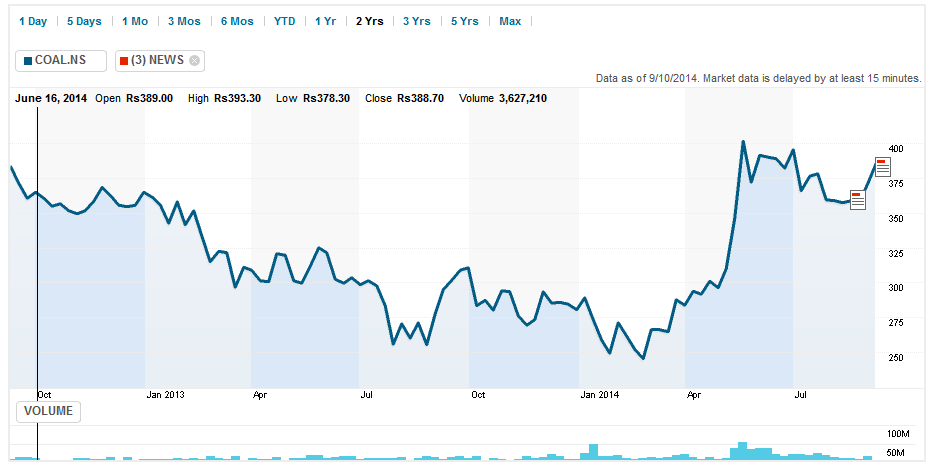
On the other hand, the propensity of governments and their associates to tweak definitions has been on embarrassing display. Consider Japan, and the news that emerged which showed that the country (which continues to be in denial about the effects of the Fukushima nuclear plant disaster) had counted US$ 1 billion for the construction of coal-fuelled power plants in Indonesia as part of its low carbon financing package. Yes, coal still provides some 40% of the world’s electricity supply and yes, coal is by far the largest source of greenhouse gas emissions. To get past the obvious contradiction, Tokyo’s officials at the Lima meeting argued the plants were more efficient and therefore greener than those that would have been built without their help.
Not as red-faced by such duplicity as they should have been, UN officials offered their own framing. “Climate finance aims at reducing emissions, and enhancing sinks of greenhouse gases and aims at reducing vulnerability of, and maintaining and increasing the resilience of, human and ecological systems to negative climate change impacts,” they wrote. Rather than contribute to the confusion, they should have come clean about the dismal performance of the green funding discussed in the three or four meetings before this one, during which a US$ 100 billion corpus was promised. The result so far? Less than US$ 10 billion in the bank. No wonder there’s so little bang for the climate buck.
Perhaps the UN Secretary-General, Ban Ki-moon, noted the anaemia for he asked countries to do more (in what direction was not clear) and at the same time avoided the question of how to resolve deep differences on the format for the pledges, which is a matter that seems to have engaged the attention of many of the negotiators. What ought to have engaged them instead is reducing the use of petroleum products, the use of resources with which far too many unnecessary trinkets are made and sold, and the use of climate negotiation jargon.
But there is too much inertia, and the negotiating circuit seems to serve itself first by quibbling about semantics that matter not one bit on the ground. Thus the European Union has insisted that countries’ pledges should only focus on carbon cuts; richer countries want to focus on new emissions targets, and so place the onus on developing countries whose emissions are growing fastest; ‘developing’ countries want to focus on pledges of aid. Some of this impinges upon what are called intended nationally determined contributions or INDCs.
Pertaining to this new concept, the latest from the climate negotiators’ fecund imagination, is the view held by some Indian groups (non-government and academic both) that India is neither supporting a so-called review of INDCs nor proposing an alternative. Bound with the new concept and the critiques of how it may be applied are other concepts – the principles of equity and common but differentiated responsibility. Such wrangling (to which official India is a party and to which the non-governmental organisations and academic collectives routinely contribute) is useless, for the answers are simplicity embodied: we must use less fossil fuel, less per head and less as a country, progressively every year; we must, as households and villages and city wards, pay much greater attention to the primary materials used to make the things we need and buy, and one surefire way of doing so is by educating adults about being responsible for climate change; we must limit, halt and reverse the trends of family and community consumption, for waste goes unremarked and so does greed.
– Rahul Goswami
![Special bulletin of the India Climate Watch on the China-USA climate 'deal'. [pdf, 91kb]](http://indiaclimateportal.org/wp-content/uploads/2014/11/ICW_special_image_201411.png)
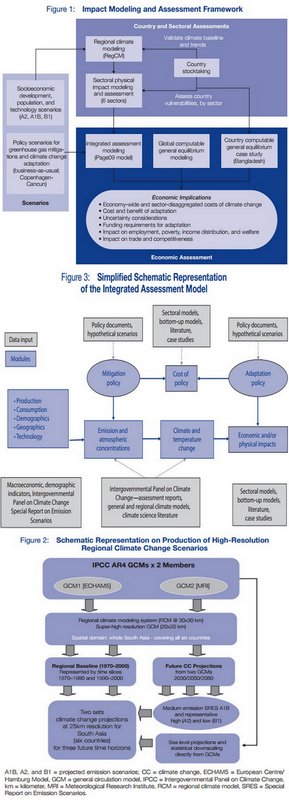
 What is germane to us is: has the IPCC process and method an Indian outlook that will be of as much utility at home as it has been to the inter-governmental effort? A short answer will be ‘no’ to the first query (because it is about science, evidence and international consensus and not about national priorities) and ‘don’t know’ to the second. There is no reason why a ‘don’t know’ should persist, as the Fifth Assessment process comes to a close, for the size of India’s population and economy, and the likely effects climate change has and is forecast to have on our 35 states and union territories ought to have turned climate change into common currency wherever planning is carried out and implemented.


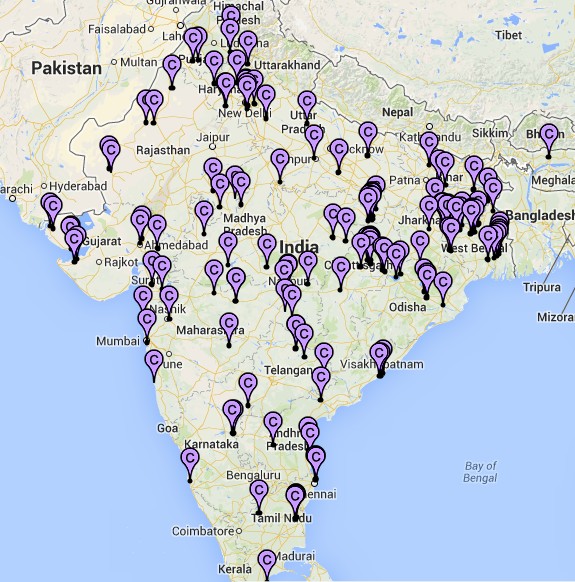
 From the first week of June 2014 until the middle of September 2014, there have been floods and conditions equivalent to drought in many districts, and for India the tale of monsoon 2014 comes from a reading of individual districts, not from a national ‘average’ or a ‘cumulative’. [


 We must question the profligacy that the Goyal team is advancing in the name of round the clock, reliable and affordable electricity to all. To do so is akin to electoral promises that are populist in nature – and which appeal to the desire in rural and urban residents alike for better living conditions – and which are entirely blind to the environmental, health, financial and behavioural aspects attached to going ahead with such actions. In less than a fortnight, prime minister Narendra Modi (accompanied by a few others)