The India Climate Observatory

Commentary, action and research on climate and development in India

  • Home
  • About
  • Monsoon 2018
  • Current
  • Bulletin
  • Contact
  • Announcements

India looks to a normal monsoon 2020

May 19, 2020 by Climate portal editor Leave a Comment

The states with coastlines along the Bay of Bengal have been anxiously watching the unfolding of the giant movements of wind, sea moisture and pressure which is now called Cyclone Amphan.

Once that cyclonic threat has played itself out – and until it does Odisha, West Bengal and Assam will be on high alert – the countdown to normal rains will resume.

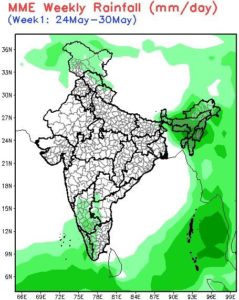
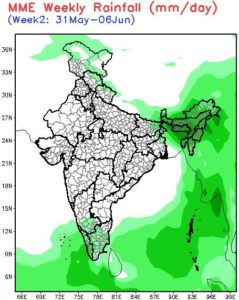
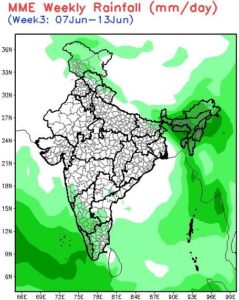
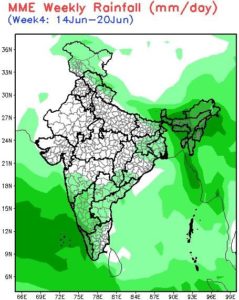
On 15 April, the India Meteorological Department (IMD) issued its customary first phase long range forecast for the south-west monsoon. And the primary take-away was: “South-west monsoon seasonal (June to September) rainfall over the country as a whole is likely to be normal (96-104%).”

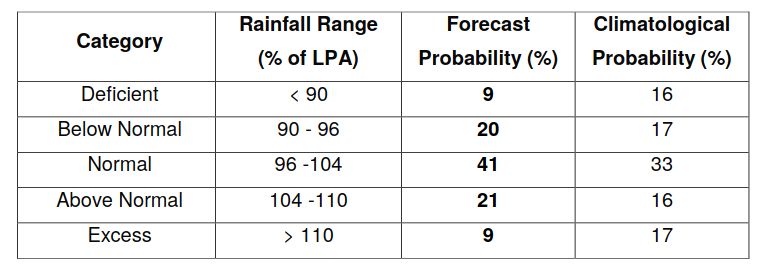
Quantitatively, said the IMD, the monsoon seasonal (June to September) rainfall is likely to be 100% of the Long Period Average (LPA) with a model error of ± 5%. The LPA of the season rainfall over the country as a whole for the period 1961-2010 is 88cm.

IMD’s forecast based on the Monsoon Mission Coupled Forecasting System (MMCFS) uses atmospheric and oceanic initial conditions during March 2020. The forecast was computed as the average of 51 ensemble members. The forecast based on the MMCFS suggests that there is a high probability (70%) for 2020 monsoon rainfall to be above normal to excess (more than 104% of LPA).


Filed Under: Latest, Monsoon 2020 Tagged With: 2020, India, monsoon

PM Modi at the Climate Action Summit

September 24, 2019 by Climate portal editor Leave a Comment

From the Prime Minister’s Office, this is the text of Prime Minister Narendra Modi’s address (the original in Hindi) on 23 September 2019, at the Climate Action Summit 2019 during the 74th session of the United Nations General Assembly in New York, USA:

The Prime Minister, Shri Narendra Modi addressing at the (United Nations) Climate Action Summit- 2019, in New York, USA on September 23, 2019.

I thank UN Secretary General for organising the Global climate summit.
After having received the Champion of the Earth award last year, this is my first opportunity to address the United Nations. I am pleased that my first meeting during my visit to New York is on the subject of Climate.
Excellencies, various efforts are being made by different countries to fight climate change. We must accept that if we have to overcome a serious challenge like climate change, then what we are doing at the moment is just not enough.
What is needed today, is a comprehensive approach which covers everything from education to values, and from lifestyle to developmental philosophy. What we need is a global people’s movement to bring about behavioral change.
The respect for nature, the judicious use of resources, reducing our needs and living within our means have all been important aspects of both our traditions and present day efforts. Need not Greed has been our guiding principle.
And therefore India today has come not just to talk about the seriousness of this issue, but to present a practical approach and a roadmap. We believe that an ounce of practice is worth more than a ton of preaching.
In India, we are going to increase the share of non fossil fuel, and by 2022 we plan to increase our renewable energy capacity to much beyond 175 GW, and later till 450 GW. In India we have made plans to make our transport sector green through e mobility. India is also working to considerably increase the proportion of the biofuel blend in petrol and diesel.
We have provided clean cooking gas to 150 million families. We have launched the Jal Jeevan mission for water conservation, rainwater harvesting and for the development of water resources. India is going to spend approximately 50 billion dollars on this in the next few years.
On the International forum, almost 80 countries have joined our International Solar Alliance campaign. India and Sweden together with other partners are launching the Leadership group within the Industry transition track. This initiative will provide a platform for governments and the private sector with opportunities for cooperation in the area of Technology innovation. This will help to develop low carbon pathways for industry.
In order to make our infrastructure disaster resilient, India is launching a Coalition for Disaster Resilient Infrastructure. I invite Member states to join this coalition.
This year on the occasion of India’s Independence day on 15th August, we called for a peoples movement to end the use of single use plastic. I hope that this will create an awareness at a global level about the harmful effects of single use plastic.
Excellencies, I am happy to announce that tomorrow we are going to inaugurate solar panels on the roof of the UN building, funded by India at a cost of 1 million dollars.
The time for talking is over; the world needs to act now. Thank you. Thank you very much.

Source: Press Information Bureau, Government of India

Filed Under: Reports & Comment Tagged With: 2019, climate, Climate Action Summit, India, UN, UNGA, United Nations

India fires a climate finance broadside

September 21, 2019 by Climate portal editor Leave a Comment

We are pleased to note that the Union Ministry of Finance has issued a discussion paper titled ‘Climate Summit for Enhanced Action: A Financial Perspective from India’, for the 23 September 2019 United Nations Climate Action Summit.

The discussion paper examines various issues on climate finance from India’s point of view. We see that the paper reminds the United Nations that “in order to respond to the worldwide call for stepping up climate actions, it will have to be matched with adequate provision of climate finance from developed countries to developing countries as mandated by the United Nations Framework Convention on Climate Change (UNFCCC) under the principles of common but differentiated responsibilities and equity”.

That means, no dilution of or change in India’s stand on the matter of who is historically responsible for the material in our atmosphere (likewise in our oceans, ice sheets and soils) which has pushed the global parts per million (ppm) of CO2 to 410.45 (the measure for 2019 June, monthly mean, by the National Oceanic and Atmospheric Administration’s Earth System Research Laboratory) and which a year ago was 407.84 ppm.

The paper has said that “climate finance is a key pillar in enabling climate actions” with the most recent estimates for taking climate actions being trillions of US dollars and not billions, but that “the momentum of these flows is insufficient and inadequate”. Referring to India’s Nationally Determined Contribution, the paper said our NDC is on a “best effort” basis, keeping in mind the developmental imperatives of the country. The year 2023 is when UN member countries will undertake a first global stocktake under the Paris Agreement. At that time, said the paper, “India will be better placed to consider a mid-term assessment of its actions and suitably recalibrate through re-examination and improvement” while for now, “India may only be in a position to elaborate or clarify its post 2020 climate actions already pledged in its NDC”.

Global Climate Fund (GCF) finance to India as per the latest available information amounts to only US$ 177 million. This is literally less than peanuts, INR 1,258 crore – the Union Territory of Pondicherry spent INR 2,720 crore just on social sector expenditure in 2017-18. Furthermore, limited as it is, the GCF is now facing withdrawal of some earlier promised sums. That is why the paper says, “the GCF is yet to reach a meaningful stage”. We fully agree.

In 2015, developed countries published a roadmap for global climate finance to US$ 100 billion, which claimed that public climate finance levels had reached US$ 41 billion per year in 2013-14. However, these claims have been contested by many. There have been many critiques on such reporting particularly on credibility, accuracy and fairness. There have also been serious concerns raised about the methodologies of accounting especially the definitional requirements of ‘new and additional’ and ‘grant equivalent’ finance. Suffice to say that the claims of the developed countries do not stand up to scrutiny.

The paper has said that finance needs for India’s are approximately US$ 206 billion (at 2014-15 prices) between 2015 and 2030 for implementing adaptation actions in key areas like agriculture, forestry, fisheries, infrastructure, water resources and ecosystems. Apart from this, there will be additional investments needed for strengthening resilience and disaster management. (RG)

The full discussion paper is available here.

Filed Under: Latest Tagged With: climate, finance, Global Climate Fund, India, Paris agreement, UNFCCC

The Indiaclimate Rainfall Index 2019

July 15, 2019 by Climate portal editor Leave a Comment

We have compiled the Indiaclimate District Rainfall Adequacy Index for the monsoon season of 2019. As with our previous editions of the index series, this one for the 2019 monsoon applies our innovation to the communicating of the weekly changes in rainfall adequacy as recorded by the India Meteorological Department (IMD).

The graph (or visualisation as any such illustration is called nowadays, a word that makes the simple graph or chart sound sophisticated, but which usually complicates matters instead of simplifying them) is easy enough to read and interpret. What you have is several vertical bars, each corresponding to dates a week apart. The bars are made up of coloured segments – there are 11 coloured segments and one grey segment, a total of 12 segments.

Each of the 11 colours represents the number of districts whose rainfall readings for a week (the week till the date given) fall within the parameters given in the accompanying legend. There are three groups of colours: three segments in the ‘normal’ ranges, four segments in the ‘excess’ ranges and four segments in the ‘deficient’ ranges. Grey represents no data for that week.

The gradation of the segments is based on, but is not a copy of, the grades used by the UN Food and Agriculture Organisation’s (FAO) Global Information and Early Warning System (GIEWS) indicators for precipitation. The numbers that we use are from the IMD’s Hydrometeorology Division, which releases its ‘rainfall departures’ table every week. We take these numbers, reprocess them and redistribute them across the 11 grades.

It is a much more readily readable graph and provides for quick interpretation. The grades are finer than the six used by the IMD: normal (+19% to -195), excess (+20% to +59%), large excess (+60% or more), deficient (-20% to -59%), large deficient (-60% to -99%), no rain (-100%).

Our index, in which most segments are of 20 percentage points, is designed for local administrations – in districts but also municipal bodies – to take their cues from weekly signals and prepare if need be for a drought-like situation with water shortages or a flood-like situation with inundation.

How does it work in practice? Let’s look at the district of Guna, in Madhya Pradesh, in the meteorological sub-division of Western MP. The first two monsoon weeks, ending 5 June and 12 June, Guna received no rain (that is, -100% of the rainfall it normally receives in those weeks) and that corresponds to the D4 indicator. The next week, ending 19 June, it received -29% which is D1, the fourth week (26 June) it slipped back to -72% which is D3, the following week (3 July) it improved to -32% which is again D1 and in the sixth week (10 July) Guna received +34% which took it into the E1 grade.

Normally, a district that has received no rainfall or neglible rainfall for six weeks becomes a candidate for a drought-like condition – water sources after the long and hot summer have dried up and crops become parched. If such conditions continue for another two weeks, the state administration must roll out relief measures.

In our example, for the five weeks until the week of 3 July Guna had two D4s, one D3 and two D1s before coming out of the D grades. Our index gives the district (or town) administration the means with which to set their own triggers for action. If the water sources in the district were still at 10%-15% of their water holding capacities by the week of 3 July, then they could consult the medium term forecasts to gauge whether likely rainfall will be enough to hold off relief action. If not, and stored water slipped under 10% with uncertain forecasts, they could ask for relief and issue appropriate crop advisories.

Our index graph – the stacked and segmented bar chart I am sorely tempted to call a ‘signature’ – is a representation of the numbers in the rainweeks table we compile. This table has 684 components which are the districts, each of which has a rainfall reading for the week given (in millimetres) and a rainfall departure (in %). The graph is a set of stacked bars for each week, with each segment sized according to the number of districts in the grade that the segment corresponds to.

What does the index graph for six weeks tell us? The first two monsoon weeks were alarming, with 342 and then 356 districts in the D4 grade. The situation has slowly improved thereafter, with the latest week, that of 10 July, being the best so far – it has 80 districts in the N1 grade. That last week also has for the first time in monsoon 2019 more E grade districts than D grade districts. What needs to be looked out for is districts that have been in the D4 and D3 grades for four and more weeks and whose recovery is patchy. That monitoring becomes much easier with the Indiaclimate District Rainfall Adequacy Index.

Rahul Goswami

Filed Under: Latest, Monsoon 2019 Tagged With: 2019, agriculture, district, drought, flood, India, monsoon, rainfall, water

Late, but on the way

May 28, 2019 by Climate portal editor Leave a Comment

At this point, the monsoon 2019 system is farther away, in terms of its movement, than where it is normally found at this time of the year. The India Meteorological Department maintains its maps showing the movement of the system through late May and early June.

Judged against its averaged movement over the last decade and over a 50-year long-term average, the northern limit of the system is some 450 kilometres away from where it usually is in the south-west Bay of Bengal, and is about 400 kilometres away from the more easterly end of the same perimeter in the east-central Bay of Bengal. Whereas around 27 May the monsoon system would have normally been some 150 kilometres north of the Andaman Islands, now it is at 11N (near Little Andaman).

This delay has no bearing on the forecast for the overall adequacy of rainfall during monsoon 2019 because, as the IMD has said, the large-scale features which influence our monsoon are favourable, these being:
* Weak El Niño conditions that are prevailing over the equatorial Pacific Ocean; the latest Monsoon Mission Climate Forecasting System (MMCFS) forecast indicates that these conditions are likely to continue during the monsoon season but with reduced intensity.
* Neutral Indian Ocean Dipole (IOD) conditions over the Indian Ocean; the latest MMCFS forecast indicates these conditions are likely to continue during the monsoon season.

The weekly outlooks are as follows.
The week 24 May to 30 May: the south-west monsoon cloud cover belt moves into sea regions – the south-east Arabian Sea, the south-west and south-east Bay of Bengal, and the north Andaman Sea. Showers in the entire north-eastern region with heavier daily rain (5-10 mm/day) in Manipur, Nagaland and Assam hills. Light showers in Karnataka, Kerala, adjacent Tamil Nadu and Rayalaseema.

The week 31 May to 06 Jun: the south-west monsoon cloud cover belt does not advance further into the Arabian Sea while it moves further north into the east-central Bay of Bengal. The north-east region continues to have showers as the eastern Himalayan region is fully covered. Lower Assam and Meghalaya to have heavier showers of up to 20 mm/day. The spread of light showers in Tamil Nadu is wider as the north Lankan gap between the cloud fronts over the Arabian Sea and Bay of Bengal closes, light showers (up to 5 mm/day) continue in Kerala and south interior Karnataka.

The week 07 Jun to 13 Jun: the main feature is the advance of the south-west monsoon cloud cover belt into the east-central Arabian Sea (off the central Konkan coast). With the limits of the south-west monsoon cloud cover belt remaining as they were over the Bay of Bengal, light showers extend over Tamil Nadu, south interior and coastal Karnataka, Goa and the Maharashtra Konkan with heavier showers (5-10 mm/day in Kerala). All states of the north-east continues to receive heavier showers (10-20 mm/day) and the western Himalaya – all divisions of Jammu & Kashmir, the northern halves of Himachal Pradesh and Uttarakhand – receive light showers.

The week 14 Jun to 20 Jun: consolidation of the south-west monsoon cloud cover belt over the seas with the east-central and north-east Arabian Sea fully reached, the north-east Bay of Bengal likewise, and its north-west entered. This brings heavier daily rain (up to 20 mm/day to all states of the north-east and light showers to West Bengal, parts of Bihar, Jharkhand, parts of Odisha. The entire west coast has rain with the northern precipitation line from Thane (20N) to Latur (18N), to Warangal (18N) and Kondagaon (in Chhattisgarh, 20N), to Rayagada (in Odisha, 19N). Light showers also in the western Himalayan region (up to 5 mm/day).

Filed Under: Current, Monsoon 2019 Tagged With: 2019, climate, India, monsoon

‘Fani’ aims for Odisha, AP

April 27, 2019 by Climate portal editor Leave a Comment

Update: Cyclone Fani will make landfall on the coast on 3 May. Depending on whether the Extremely Severe Cyclonic Storm (IMD’s classification) gains more speed over the Bay of Bengal, Fani could cross the coast as early as 1000 hours on 3 May.

Based on the weather charts released by IMD and corroborated by the climatological forecasts produced by the World Meteorological Organisation’s members, Fani will cross the coast between Kakinada, East Godavari district, Andhra Pradesh, and Puri, district Puri, Odisha, which is about 60 km south of Bhubaneshwar.

Previously: The India Meteorological Department has issued a forcast for and warning about a cyclonic storm which as of today (27 Apri) is a low pressure area lying over the East Equatorial Indian Ocean and adjoining south-east Bay of Bengal.

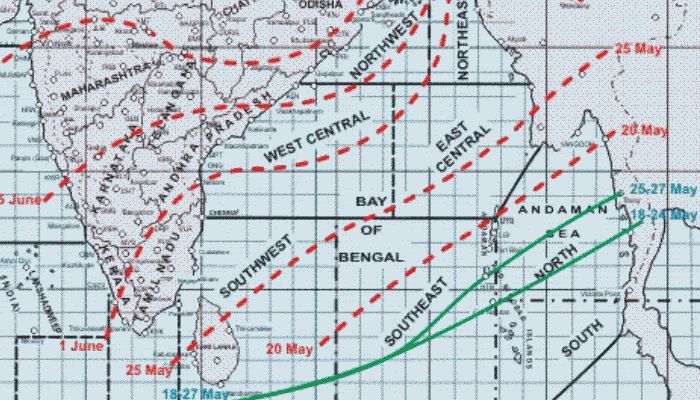
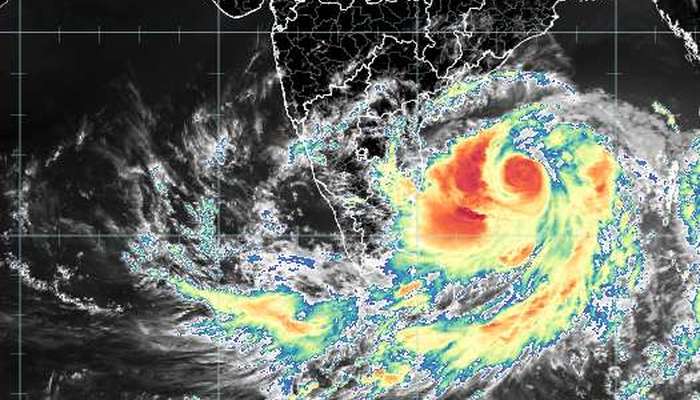
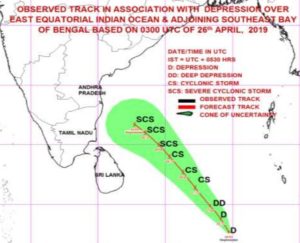
It is already intensifying into a depression over the East Equatorial Indian Ocean and adjoining central parts of the southern Bay of Bengal and will further intensify into a cyclonic storm. Thereafter the storm is forecast to move north-westwards along and off the east coast of Sri Lanka near the north Tamil Nadu coast on 30 April.

The IMD has already issued warning to fishermen about strong winds. Wind speed reaching 45-55 kmph gusting to 65 kmph over East Equatorial Indian Ocean and adjoining central parts of the southern Bay of Bengal are already being recorded. Gale wind speeds will be reached of 65-75 kmph gusting to 85 kmph over the south-west Bay of Bengal and adjoining Equatorial Indian Ocean by 27 April.

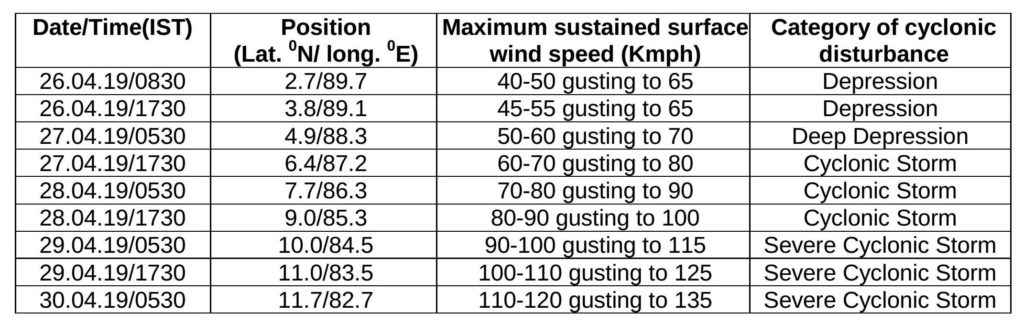
Thereafter 80-90 kmph gusting to 100 kmph over the south-west Bay of Bengal and adjoining Equatorial Indian Ocean and along and off the Sri Lankan coast on 28 April and 90-100 kmph gusting to 115 kmph over the south-west Bay of Bengal, along and off the Sri Lankan coast and off the Tamil Nadu and Puducherry coast on 29 April. The sea condition will be very rough in all these areas.

There will be light to moderate rainfall at many places with heavy rainfalls at isolated places in north coastal Tamil Nadu on 30 April and 1 May and over Kerala on 29 and 30 April. Light to moderate rainfall at many places with heavy rainfall at isolated places is also very likely over south coastal Andhra  Pradesh on these dates.

Forecast updates are available here.

Filed Under: Latest Tagged With: 2019, Andhra Pradesh, Bay of Bengal, cyclone, India, Indian Ocean, monsoon, Sri Lanka, Tamil Nadu

A mixed report for the monsoon so far

August 6, 2018 by Climate portal editor Leave a Comment

The India Meteorological Department in its ‘Long Range Forecast for the Rainfall during Second Half (August –September) of the Southwest Monsoon 2018’ has said:
(a) The rainfall during August 2018 is likely to be 96 ± 9% of LPA and expected to be higher than was predicted in June.
(b) Quantitatively, the rainfall for the country as a whole during the second half of the season (August and September) is likely to be 95% of LPA with a model error of ±8%.
(c) The tercile probability forecasts for the rainfall over the country as a whole during the 2018 second half of the monsoon season are: 47% forecast probability that it will be less than 94% of the LPA (below normal), 41% forecast probability that it will be between 94% and 106% of the LPA (normal), and only 12% forecast probability that it will be over 106% of the LPA (above normal).
The Department said that “distribution of rainfall is very good over all parts of the country except Bihar, Jharkhand and NE States. Such a scenario of favourable distribution of rainfall is expected to continue during rest of monsoon season of 2018 so as to remain favourable for agricultural operations”.

The IMD in its latest weekly ‘performance sheet’ on rainfall has calculated the cumulative rainfall up to 1 August 2018 on an ‘area weighted’ basis as being 431 mm as compared with a normal of 462 mm. But this is a measure that doesn’t tell us anything local and we have advised the IMD to abandon it. What is more useful is the enumerating of subdivisions according to cumulatie rainfall: by 1 August, there were 28 which had normal rainfall, 7 which had deficient, and one which had excess. For this period – monsoon rainfall until 1 August – this year has had the most number of subdivisions with normal rainfall in the last five years.

However it is a concern that five of the seven subdivisions which up to 1 August 2018 have had deficient rainfall are in the East and North-East India region and they are: Arunachal Pradesh (-36%), Assam and Meghalaya (-33%), NMMT which is Nagaland Manipur Mizoram Tripura (-25%), Jharkhand (-24%) and Bihar (-22%). The other two subdivisions with deficits are Rayalaseema (-41%) and Lakshadweep (-43%).

In states, Uttar Pradesh has the largest number of districts (26) registering deficient rainfall up to 1 August 2018, even though 25 of the state’s districts have had normal rainfall for the period and 18 have had excess or large excess. Bihar has 24 districts which have registered deficient rainfall for this period, followed by Jharkhand (15), Assam (14), and Gujarat, Tamil Nadu and Karnataka each with 13.

Filed Under: Latest, Monsoon 2018 Tagged With: 2018, distribution, IMD, India, monsoon, rainfall, subdivision

Three views of monsoon 2018

May 14, 2018 by Climate portal editor Leave a Comment

The India Meteorological Department (IMD) on 16 April had issued its first long range forecast for the 2018 South-West Monsoon season, which the IMD has historically taken to be 1 June to 30 September. The IMD had said that the “monsoon seasonal rainfall is likely to be 97% of the Long Period Average with a model error of ± 5%”. The IMD had also said that its forecast “suggests maximum probability for normal monsoon rainfall (96%-104% of the long period average) and low probability for deficient rainfall during the season”.

In early June, the IMD will issue its second long range forecast for the 2018 monsoon. Until then, we have studied three of the more reliable (in our view) international multi-model ensemble forecasts for the monsoon. What are ensemble forecasts? Each consists of several separate forecasts (some ensembles use 50) forecasts made by the same computer model – these are run on super-computers such as the High Performance Computer System of the Ministry of Earth Sciences (one is at the Indian Institute of Tropical Meteorology in Pune with 4.0 petaflops capacity and the other at the National Centre for Medium Range Weather Forecasting in Noida with 2.8 petaflops capacity).

The MME forecast is based on estimated precipitation anomalies relative to the period 1993-2016, based on initial conditions calculated at the beginning of May 2018. Four blocks of three months each.

The separate forecasts that make up one ensemble are all activated from the same starting time. The starting conditions for each differ from each other to account as far as possible for the staggering number of climatological, atmospheric, terrestrial and oceanographic variables that affect and influence our monsoon. The differences between these ensemble members tend to grow as the forecast travels two, three, four and more months ahead of the present.

We have considered the ensemble forecasts for the 2018 monsoon of the Multi-Model Ensemble (MME) of the USA National Centers for Environmental Prediction, the NOAA Climate Prediction Center and the European Centre for Medium-Range Weather Forecast (ECMWF). In this order, we find that the MME is optimistic, the NOAA CPC is largely neutral and the ECMWF forecast is somewhat pessimistic. The forecasting periods are in blocks of three months.

Here are the details:

(1) The MME forecast, precipitation anomalies relative to the period 1993-2016, based on initial conditions calculated at the beginning of May 2018.
June July August (JJA) – west coast and Konkan, coastal Andhra Pradesh and Odisha, West Bengal, part of the North-East, the entire upper, middle and lower Gangetic region (Uttarakhand, Himachal, Uttar Pradesh, Bihar, Jharkhand), Madhya Pradesh, Chhattisgarh, Maharashtra and Telengana to have up to +1 mm/day. Rest of India other than Gujarat (-0.5 mm/day) normal.
July August September (JAS) – Gujarat to have up to -1 mm/day, Rajasthan up to -0.5 mm/day, Sikkim, Brahmaputra valley and Arunachal Pradesh up to -0.5 mm/day. Himachal Pradesh and Uttarakhand up to +0.5 mm/day, Madhya Pradesh, Odisha, Chhattisgarh, Jharkhand and West Bengal up to +0.5 mm/day. Andhra Pradesh and Tamil Nadu up to -0.5 mm/day.
August September October (ASO) – Gujarat up to -0.5 mm/day. Tamil Nadu up to -1 mm/day. Kerala and adjacent Karnataka up to -0.5 mm/day. Madhya Pradesh, Chhattisgarh, Odisha, West Bengal up to +1 mm/day. Tripura, Mizoram, Manipur, Nagaland, Uttarakhand, Himachal Pradesh up to +0.5 mm/day
September October November (SON) – Tamil Nadu, Kerala and adjacent Karnata up to -1 mm/day. Maharashtra, Madhya Pradesh, Chhattisgarh, Odisha, West Bengal, Himachal Pradesh and Uttarakhand up to +0.5 mm/day.

The NOAA CPC forecast is based on estimated seasonal precipitation anomalies using initial conditions of 30 April 2018 to 9 May 2018. Three blocks of three months each.

(2) The NOAA CPC forecast, seasonal precipitation anomalies using initial conditions of 30 April 2018 to 9 May 2018.
May June July (MJJ) – for most of India a normal reading (+0.5 to -0.5 mm/day fluctuation) and for the west coastal, Konkan, Kerala, south Tamil Nadu and coastal Andhra Pradesh areas variation of up to +1.5 mm/day.
June July August (JJA) – for most of India a normal reading (+0.5 to -0.5 mm/day fluctuation).
July August September (JAS) – normal for most of India. Some areas in the central Deccan plateau, on the west coast and east coast variation of up to -1 mm/day.

The ECMWF forecast is based on estimated mean precipitation anomaly based on climate period data of 1993-2016 and initial conditions as on 1 May 2018. Four blocks of three months each.

(3) The ECMWF forecast, mean precipitation anomaly based on climate period data of 1993-2016 and initial conditions as on 1 May 2018.
June July August (JJA) – all of the southern peninsula and part of the Deccan region (Kerala, Tamil Nadu, Karnataka, Andhra Pradesh, part of Telengana up to -100 mm for the period. West Bengal, Bihar, Jharkhand, Uttar Pradesh up to +100 mm for the period.
July August September (JAS) – all of the southern peninsula and the Deccan region – Kerala, Tamil Nadu, Karnataka, Andhra Pradesh, part of Telengana and Maharashtra up to -100 mm for the period.
August September October (ASO) – Maharashtra, Telegana, Andhra Pradesh and Karnataka up to -100 mm for the period.
September October November (SON) – Central and western India, eastern states and entire Gangetic region up to -50 mm for the period.

Rahul Goswami

Filed Under: Latest, Monsoon 2018 Tagged With: 2018, earth sciences, forecast, IMD, India, meteorology, monsoon

Vidarbha’s monsoon secret comes out in our innovative new rainfall index

August 18, 2017 by Climate portal editor Leave a Comment

Monsoon rains in Vidarbha better than the rains in Konkan Maharashtra? How can this be possible? Especially when the average rainfall for the seven districts of Konkan Maharashtra, over 1 June to 9 August, is 1,812 mm and the average rainfall for the 11 districts of Vidarbha Maharashtra is 427 mm over the same period?

The measure that we are piloting is not based on the cumulative totals, for each district during each week of monsoon 2017, but for how adequate the rainfall has been over each week. What does that mean? Maharashtra’s Konkan region receives over four times the amount of rainfall that Vidarbha does. This does not mean that Vidarbha is more ‘rain poor’ than Konkan Maharashtra. The two meteorological regions are different just as their agro-ecologies, soils, water retention structures and flora are different.

Because of this difference, it is more useful to us to judge how adequate rainfall has been over any given period of measurement. We have taken a week because that is what we have data for, as provided by the Department of Hydrometeorology or the Department of Agricultural Meteorology of the India Meteorological Department, Ministry of Earth Sciences.

If you examine the cumulative totals – this means the running totals which from one week to the next carry over extras or deficits – the picture is as follows. One district only (Mumbai City) of the seven in Konkan Maharashtra is deficit (with -22%), all the rest being ‘normal’ in the range of -19% to +22%. The cumulative measurement picture for Vidarbha is this: only four out of the 11 districts (Buldana, Gadchiroli, Nagpur and Wardha) are ‘normal’ and in the range of -15% to -19%. The remaining seven are ‘deficit’ in the range of -23% to -36% (Amravati and Yavatmal being the lowest).

The weakness of the cumulative measure is that it ‘carries forward’ deficits and surpluses. A deficit in weeks 3 and 4 can be ‘made up’ for by better rains in week 5 and 6. But when rain in weeks 3 and 4 are important for a particular phase of a crop’s growth, the surplus that follows is of little use.

That’s where this pilot measure, what I have called the ‘rainfall adequacy index’, comes in. It indexes normalcy and variation from normalcy, plus or minus, and so records how adequate every week has been for the district. Using this method, we find that among Maharashtra’s meteorological regions, it is Vidarbha that has done best over 1 June to 9 August, followed by Konkan Maharashtra, then by Madhya Maharashtra and with Marathwada last.

The footnote is that the three districts with the best ‘rainfall adequacy index’ over this period are, in order, Sindhudurg, Nagpur and Wardha. The three districts with the worst index are Osmanabad, Nashik and both Thane and Palghar.

– Rahul Goswami

Filed Under: Latest, Monsoon 2017 Tagged With: 2017, agriculture, district, ecology, hydrometeorology, India, Konkan, Madhya Maharashtra, Maharashtra, Marathwada, monsoon, Mumbai, rainfall, Vidarbha, water

India becoming 1.4°C warmer until 2045

August 5, 2017 by Climate portal editor Leave a Comment

Launched in 2009 with the support of the Ministry of Earth Sciences (MoES), Government of India, the Centre of Climate Change Research (CCCR) is part of the Indian Institute of Tropical Meteorology (IITM) in Pune, Maharashtra. The CCCR focuses on development of new climate modelling capabilities in India and South Asia to address issues concerning the science of climate change.

The Centre has now released an ‘Interim Report on Climate Change over India’ which is intended to provide a brief overview of: (a) updated assessment of observed climate change over India, (b) future climate projections over India, (c) development of the IITM Earth System Model to better understand and quantify climate change and its regional impacts. The three topics, which are among the core research activities of the CCCR at IITM, have been presented as three chapters in this Interim Report, and an updated report is planned to be submitted later next year.

Assessments of impacts of climate change and future projections over the Indian region, have so far relied on a single regional climate model (RCM) such as the PRECIS RCM of the Hadley Centre, UK. While these assessments have provided inputs to various reports (INCCA 2010; NATCOMM2 2012), it is important to have an ensemble of climate projections drawn from multiple RCMs due to large uncertainties in regional-scale climate projections. Ensembles of multi-RCM projections driven under different perceivable socio-economic scenarios are required to capture the probable path of growth, and provide the behavior of future climate and impacts on various biophysical systems and economic sectors dependent on such systems. [The full report is available here (pdf).]

The Centre for Climate Change Research, Indian Institute of Tropical Meteorology (CCCR-IITM) has generated an ensemble of high resolution downscaled projections of regional climate and monsoon over South Asia until 2100 for the Intergovernmental Panel for Climate Change (IPCC) using a RCM (ICTP-RegCM4) at 50 km horizontal resolution, by driving the regional model with lateral and lower boundary conditions from multiple global atmosphere-ocean coupled models from the Coupled Model Intercomparison Project Phase 5 (CMIP5). The future projections are based on three Representation Concentration Pathway (RCP) scenarios (viz., RCP2.6, RCP4.5, RCP8.5) of the IPCC.

These high-resolution downscaled projections of regional climate over South Asia are generated as part of the International Programme called Coordinated Regional Downscaling Experiment (CORDEX) sponsored by the World Climate Research Programme. This chapter provides a synthesis of results from the CORDEX South Asia multi-RCM outputs, that allows us to interpret the strengths and limitations of future regional climate projections over India. This information is useful to reduce uncertainty of impact assessment estimates to an extent and provide a pan-Indian regional assessment for informed policy-making.

Key points

⊗ The all India mean surface air temperature change for the near-term period 2016–2045 relative to 1976–2005 is projected to be in the range of 1.08°C to 1.44°C, and is larger than the natural internal variability. This assessment is based on a reliability ensemble average (REA) estimate incorporating each RCM performance and convergence, and is associated with less than 16% uncertainty range.

⊗ The all India mean surface air temperature is projected to increase in the far future (2066–2095) by 1.35 ±   0.23°C under RCP2.6, 2.41 ± 0.40°C under RCP4.5 and 4.19 ± 0.46°C under RCP8.5 scenario respectively. These changes are relative to the period 1976–2005. The semi-arid north-west and north India will likely warm more rapidly than the all India mean.

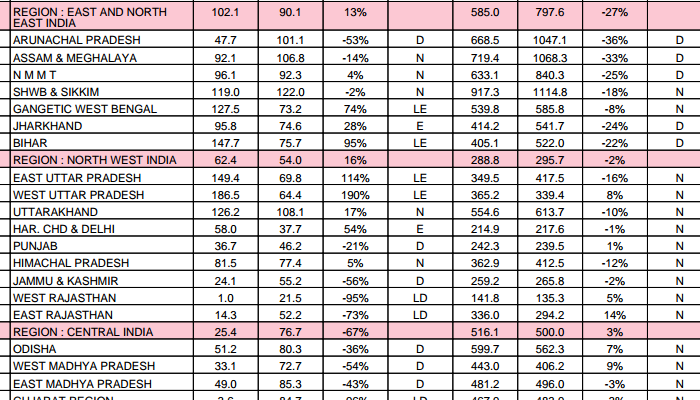
⊗ Monthly increase in all India mean surface air temperature based on REA estimate is relatively higher during winter months than in the summer monsoon months throughout the 21st century under the three RCP scenarios.

⊗ The REA changes for all India annual minimum temperature of 4.43 ± 0.34oC is more pronounced than that of 3.94 ± 0.45oC and 4.19 ± 0.46oC increases estimated for the respective annual maximum and mean temperatures respectively the end of the 21st century under RCP8.5 scenario. The models project substantial changes in temperature extremes over India by the end of the 21st century, with a likely overall decrease in the number of cold days and nights, and increase in the number of warm days and nights.

⊗ Although the all India annual precipitation is found to increase as temperature increases, the REA assessment indicates that precipitation changes throughout the 21st century remain highly uncertain.

⊗ The all India annual precipitation extremes are projected to increase with relatively higher uncertainty under RCP8.5 scenario by the end of the 21st century. The downscaled projections suggest that intensification of both dry and wet seasons is expected along the west coast of India and in the adjoining peninsular region.

The multi-RCM ensemble mean annual precipitation mid-term increase exceeds 10% over the west coast and the adjoining southern parts of the Indian peninsula for RCP4.5 scenario, while in the long-term the change for this mid-scenario exceeds 20% over the south-west coast and the adjoining Kerala state. The precipitation changes are not significant over the remaining parts of India for this mid-scenario up to the mid 21st century, however in long-term increase exceed 10% over north-west and adjoining parts of the country. The long-term projected annual precipitation increase exceeds 10% over most parts of India except in Jammu and Kashmir under RCP8.5 scenario, with relatively higher increase exceeding 30% projected along the west coast of India for this high-emission scenario by the end of 21st century.


Filed Under: Current Tagged With: Climate Change, earth sciences, earth system model, Hadley Centre, IITM, India, IPCC, MoES, precipitation, RCP, regional climate model, temperature, Tropical Meteorology

  • 1
  • 2
  • 3
  • …
  • 8
  • Next Page »

Indiaclimate twitter

Tweets by @Indiaclimate

Notable

Between contemplation and climate

Whether or not the USA, Europe, the Western world, the industrialised Eastern world (China, Japan, South Korea, Taiwan), adhere to or not their paltry promises about being more responsible concerning the factors that lead to climate change, is of very little concern to us. We have never set any store by international agreements on climate […]

The ‘Hindu’, ignorant about weather and climate, but runs down IMD

We find objectionable the report by ‘The Hindu’ daily newspaper accusing the India Meteorological Department of scientific shortcoming (‘IMD gets its August forecast wrong’, 1 September 2016). The report claims that the IMD in June 2016 had forecast that rains for August would be more than usual but that the recorded rain was less than […]

dialogue

  • Misreading monsoon | Resources Research on Misreading monsoon
  • Satish on A tribute to the weathermen of Bharat
  • Climate portal editor on A tribute to the weathermen of Bharat
  • Climate portal editor on A tribute to the weathermen of Bharat
  • Climate portal editor on A tribute to the weathermen of Bharat

Categories

Copyright © 2025 indiaclimateportal.org.