The Earth System Science Organisation (ESSO), Ministry of Earth Sciences (MoES) and the India Meteorological Department (IMD) released their second long range forecast for monsoon 2015 on 2 June. The ‘headline’ message is that rainfall for the June to September monsoon season is very likely to be 88% of what is normal for the season.
The forecast has been seized upon by various quarters as having serious implications for the production of crop staples (and therefore for food security), for farmers’ livelihoods, for consumer prices and for the availability of water. These are all valid and important aspects that depend entirely or substantially upon the summer monsoon.
But, the IMD, the ESSO and the MoES do not make statements and forecasts on these aspects. They are concerned with what the climatological data and signs point to, and that is what they have told us. How the forecast relates to important aspects of food, farm incomes, water resources and food stocks relies on interpretations. Our advice – to the media, to government agencies and to the private sector – is to go slow on drawing conclusions and when conclusions are required, to make them incrementally.

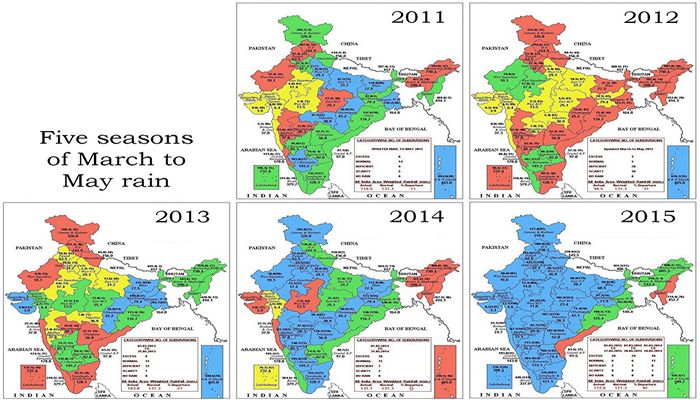
The wettest pre-monsoon season (March to May) for five years.
Using the handy graphic here, (887KB) we also point out that the pre-monsoon season (March to May) for 2015 has been the wettest in five years. In several meteorological sub-divisions, excess rain has been recorded during this pre-monsoon season. In several districts, the annual rainfall total has already been reached, even before the typical monsoon season of June to September.
This ought to be warning enough to us to be sparing with deciding how forecasts will affect us. The ESSO, IMD and MoES have repeated, in their second long range forecast, that 2015 is an El Niño year which only means that as this sea temperature phenomenon waxes and wanes though the remainder of 2015, so too will the monsoon system react.
It is best to judge our Indian summer monsoon a week at a time, keeping in mind crop calendars and how much water our reservoirs hold. It is always prudent to take precautions such as rationing water (even when it is raining), especially in towns and cities. Likewise, district administrations will do well to assess their local supplies of food staples and match these figures with what food staples their districts are likely to produce during a monsoon whose reliability has now been written off.
The second long range forecast for monsoon 2015 is available here, and the Hindi text can be found here.


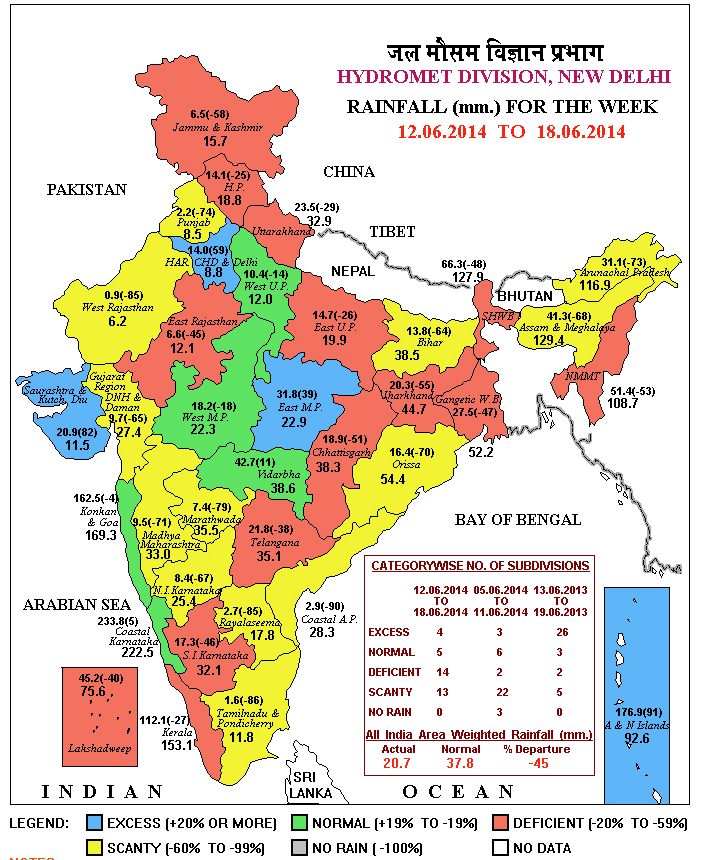
 From the first week of June 2014 until the middle of September 2014, there have been floods and conditions equivalent to drought in many districts, and for India the tale of monsoon 2014 comes from a reading of individual districts, not from a national ‘average’ or a ‘cumulative’. [