Most essential indicators of Earth’s changing climate continued to reflect trends of a warming planet, with several markers such as rising land and ocean temperature, sea levels and greenhouse gases setting new records.
The latest report which explains these indicators, compiled by the NOAA Center for Weather and Climate at the National Centers for Environmental Information is based on contributions from 413 scientists from 58 countries. It provides a detailed update on global climate indicators, notable weather events, and other data collected by environmental monitoring stations and instruments located on land, water, ice, and in space.
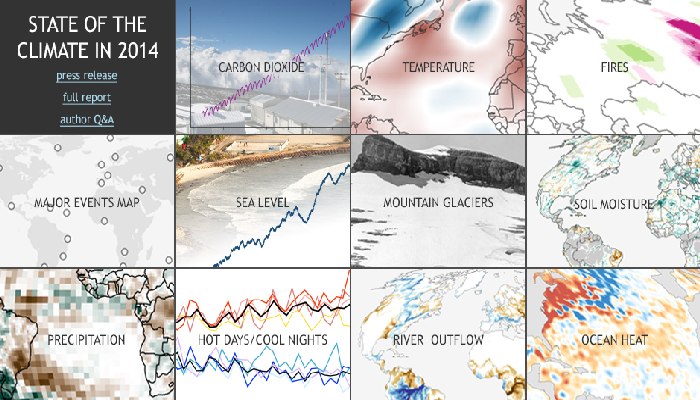
The report represents data from around the globe and gives us a picture of what happened in 2014. The variety of indicators shows us how our climate is changing, not just in temperature but from the depths of the oceans to the outer atmosphere. The report’s climate indicators show patterns, changes and trends of the global climate system. Examples of the indicators include various types of greenhouse gases; temperatures throughout the atmosphere, ocean, and land; cloud cover; sea level; ocean salinity; sea ice extent; and snow cover.
Key highlights from the report include (get the full report here, find a summary here):
* Greenhouse gases continued to climb: Major greenhouse gas concentrations, including carbon dioxide, methane and nitrous oxide, continued to rise during 2014, once again reaching historic high values. Atmospheric CO2 concentrations increased by 1.9 ppm in 2014, reaching a global average of 397.2 ppm for the year. This compares with a global average of 354.0 in 1990 when this report was first published just 25 years ago.
* Record temperatures observed near the Earth’s surface: Four independent global datasets showed that 2014 was the warmest year on record. The warmth was widespread across land areas. Europe experienced its warmest year on record, with more than 20 countries exceeding their previous records. Africa had above-average temperatures across most of the continent throughout 2014, Australia saw its third warmest year on record, Mexico had its warmest year on record, and Argentina and Uruguay each had their second warmest year on record. Eastern North America was the only major region to experience below-average annual temperatures.
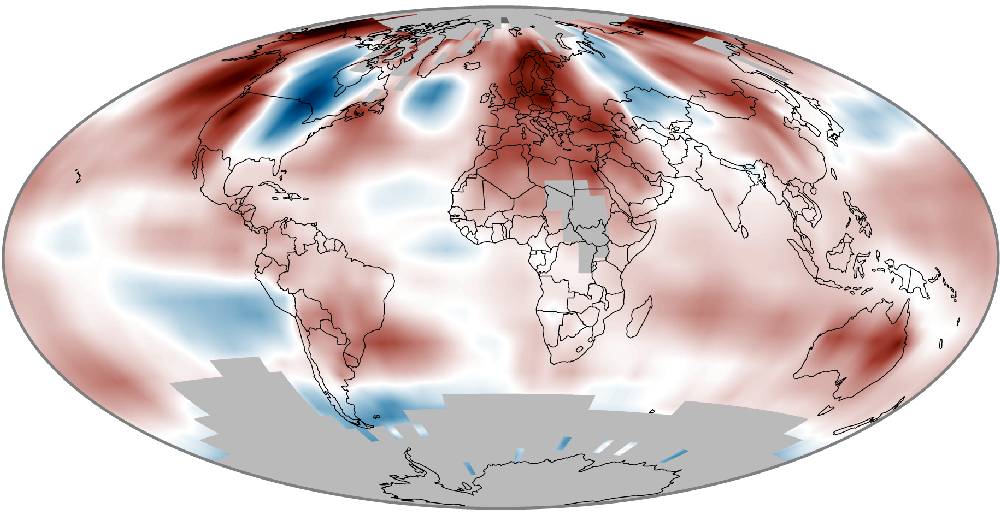
Surface temperature anomalies in 2014. Image: NOAA Center for Weather and Climate
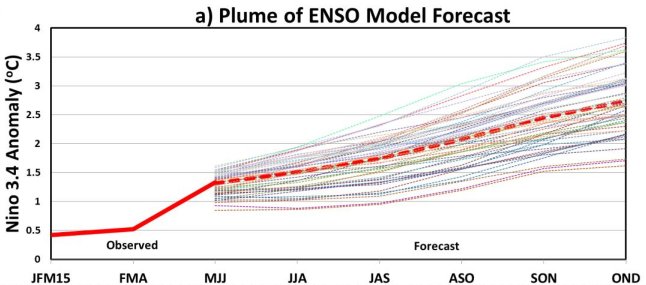
* Tropical Pacific Ocean moves towards El Niño–Southern Oscillation conditions: The El Niño–Southern Oscillation was in a neutral state during 2014, although it was on the cool side of neutral at the beginning of the year and approached warm El Niño conditions by the end of the year. This pattern played a major role in several regional climate outcomes.
* Sea surface temperatures were record high: The globally averaged sea surface temperature was the highest on record. The warmth was particularly notable in the North Pacific Ocean, where temperatures are in part likely driven by a transition of the Pacific decadal oscillation – a recurring pattern of ocean-atmosphere climate variability centered in the region.
* Global upper ocean heat content was record high: Globally, upper ocean heat content reached a record high for the year, reflecting the continuing accumulation of thermal energy in the upper layer of the oceans. Oceans absorb over 90 percent of Earth’s excess heat from greenhouse gas forcing.
* Global sea level was record high: Global average sea level rose to a record high in 2014. This keeps pace with the 3.2 ± 0.4 mm per year trend in sea level growth observed over the past two decades.
* The Arctic continued to warm; sea ice extent remained low: The Arctic experienced its fourth warmest year since records began in the early 20th century. Arctic snow melt occurred 20–30 days earlier than the 1998–2010 average. On the North Slope of Alaska, record high temperatures at 20-meter depth were measured at four of five permafrost observatories. The Arctic minimum sea ice extent reached 1.94 million square miles on September 17, the sixth lowest since satellite observations began in 1979. The eight lowest minimum sea ice extents during this period have occurred in the last eight years.
* The Antarctic showed highly variable temperature patterns; sea ice extent reached record high: Temperature patterns across the Antarctic showed strong seasonal and regional patterns of warmer-than-normal and cooler-than-normal conditions, resulting in near-average conditions for the year for the continent as a whole. The Antarctic maximum sea ice extent reached a record high of 7.78 million square miles on September 20. This is 220,000 square miles more than the previous record of 7.56 million square miles that occurred in 2013. This was the third consecutive year of record maximum sea ice extent.
* Tropical cyclones above average overall: There were 91 tropical cyclones in 2014, well above the 1981–2010 average of 82 storms. The 22 named storms in the Eastern/Central Pacific were the most to occur in the basin since 1992. Similar to 2013, the North Atlantic season was quieter than most years of the last two decades with respect to the number of storms.

 Whether the monsoon starts off on time, whether the June, July, August and September rainfall averages are met, and whether the seasonal pattern of the monsoon is maintained are expectations that must now be set aside.