The India Climate Observatory

Commentary, action and research on climate and development in India

  • Home
  • About
  • Monsoon 2018
  • Current
  • Bulletin
  • Contact
  • Announcements

The 1 degree mark we’ll recall 2015 for

November 27, 2015 by Climate portal editor Leave a Comment

ICP_WMO_20151127

The global average surface temperature in 2015 is likely to be the warmest on record and to reach the symbolic and significant milestone of 1° Celsius above the pre-industrial era. This is due to a combination of a strong El Niño and human-induced global warming, according to the World Meteorological Organization (WMO).

The years 2011-2015 have been the warmest five-year period on record, with many extreme weather events – especially heatwaves – influenced by climate change, according to a WMO five-year analysis. Levels of greenhouse gases in the atmosphere reached new highs and in the Northern hemisphere spring 2015 the three-month global average concentration of CO2 crossed the 400 parts per million barrier for the first time. 2015 is likely to be the hottest year on record, with ocean surface temperatures at the highest level since measurements began.  It is probable that the 1°C Celsius threshold will be crossed, said the WMO.

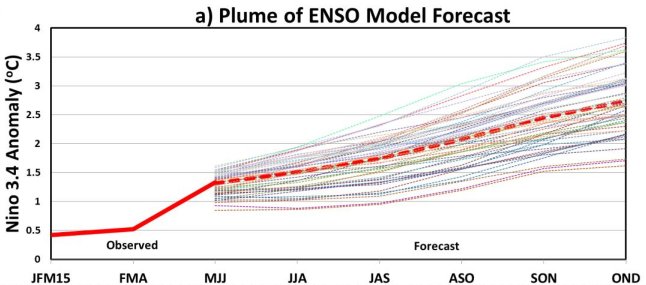
Greenhouse gas emissions, which are causing climate change, can be controlled. We have the knowledge and the tools to act. We have a choice. Future generations will not. Added to that, we are witnessing a powerful El Niño event, which is still gaining in strength. This is influencing weather patterns in many parts of the world and fuelled an exceptionally warm October. The overall warming impact of this El Niño is expected to continue into 2016.

Global annual average temperatures anomalies (relative to 1961-1990) based on an average of three global temperature data sets (HadCRUT.4.4.0.0, GISTEMP and NOAAGlobalTemp) from 1950 to 2014. The 2015 average is based on data from January to October. Bars are coloured according to whether the year was classified as an El Niño year (red), a La Niña year (blue) or an ENSO-neutral year (grey).Note uncertainty ranges are not shown, but are around 0.1°C. Chart: WMO

Global annual average temperatures anomalies (relative to 1961-1990) based on an average of three global temperature data sets (HadCRUT.4.4.0.0, GISTEMP and NOAAGlobalTemp) from 1950 to 2014. The 2015 average is based on data from January to October. Bars are coloured according to whether the year was classified as an El Niño year (red), a La Niña year (blue) or an ENSO-neutral year (grey).Note uncertainty ranges are not shown, but are around 0.1°C. Chart: WMO

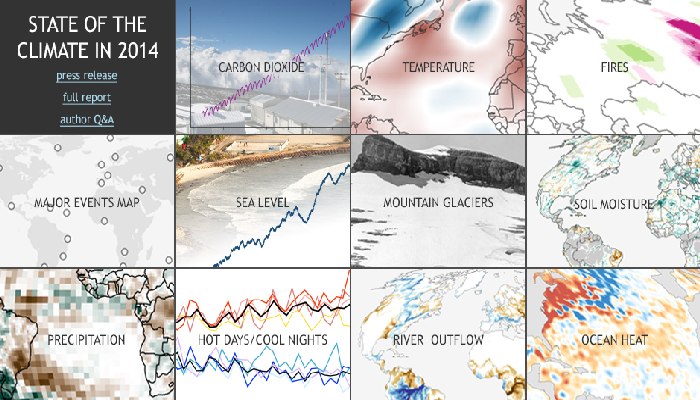
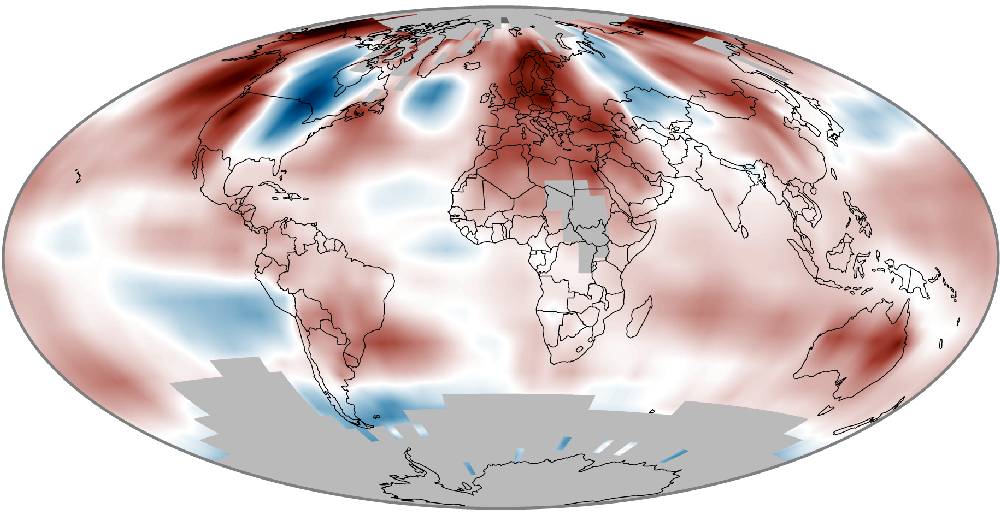
WMO issued its provisional statement on the status of the climate in 2015, and an additional five-year analysis for 2011-2015, to inform negotiations at the U.N. Climate Change Conference in Paris. A preliminary estimate based on data from January to October shows that the global average surface temperature for 2015 so far was around 0.73 °C above the 1961-1990 average of 14.0°C and approximately 1°C above the pre-industrial 1880-1899 period.

This temperature tendency indicates that 2015 will very likely be the warmest year on record. The global average sea-surface temperature, which set a record last year, is likely to equal or surpass that record in 2015. The global average temperatures over land areas only from January to October suggest that 2015 is also set to be one of the warmest years on record over land. South America is having its hottest year on record, as is Asia (similar to 2007), and Africa and Europe their second hottest.

According to preliminary figures as of the end of September 2015, 2011-15 was the world’s warmest five-year period on record, at about 0.57°C (1.01°F) above the average for the standard 1961-90 reference period. It was the warmest five-year period on record for Asia, Europe, South America and Oceania, and for North America. WMO compiled the five-year analysis because it provides a longer-term climate signal than the annual report.

Filed Under: Latest Tagged With: Climate Change, CO2, conference, COP21, El Nino, global warming, greenhouse gas, meteorological, ppm, temperature, WMO

A monsoon in more than two halves

August 4, 2015 by Climate portal editor Leave a Comment

ICP_imd_forecast_20150804

Less rain for the remaining two months of the typical monsoon season of four months, but an overall season average that remains as it was forecast in June. This is the confusing monsoon update issued by the Earth System Science Organization (ESSO), the Ministry of Earth Sciences (MoES) and the India Meteorological Department (IMD).

There are aspects of IMD’s treatment of the monsoon season that need correction in our view. One is the long range forecast and its updates. Specific to this update, we are at the halfway stage of what is typically considered the four month monsoon (this too needs revision, as April and May rains were not the usual ‘unseasonal’ passing showers). However, any downward revision of the rainfall average for August and September ought to be an overall downward revision of the season, particularly as June-July have seen very uneven rain.

Consider the highlights of the updated monsoon forecast:

* Quantitatively, the rainfall over the country as a whole during the second half of the season (August to September) is likely to be 84% of LPA with a model error of ±8%.
* The rainfall during August is likely to be 90 ± 9% of LPA as was forecasted in June.
* The season (June to September) rainfall over the country as a whole is likely to be 88% of LPA with a model error of ±4% as was forecasted in June.

ICP_imd_points_20150804We make our criticism constructively, for a significant amount of the material India Climate Portal puts out through our website and our twitter account is taken from the public products released by IMD, ISRO and the Ministry of Earth Sciences, and we fully appreciate the quality of work and commitment of these agencies.

The national mean rainfall (“country as a whole”, as the IMD forecasts call it) must be abandoned as it does not represent the meteorological diversity of a very large country. Each of the 36 met sub-divisions is affected in different ways by the El Nino Southern Oscillation, the Indian Ocean dipole, the Madden-Julian Oscillation and other hemispheric phenomena.

There is no need for this simplification, which in fact achieves the opposite of timely accuracy.
The media in particular (television and radio, print, online) look for an overall message and, without guidance from authorities, picks up ‘top line’ messages that are of little or no use at the district and taluka level, and also for towns and cities. The question for IMD is rather: how will variability in monsoon together with the strengthening El Nino affect local outlooks for August to October. That is why we advocate monthly outlooks for the 36 met sub-divisions, to begin in May and to run until October (that is, half the year and not a third of the year), primarily to prepare local administrations for all possible scenarios.

There is no reason why this cannot be the approach. The Ministry of Earth Sciences coordinates the observation network (satellites included, and our agencies ISRO and NRSC are heavily involved), the IMD uses these data together with a very extensive network of weather stations all over India. The output is excellent quality and in the public domain. Because the meteorological services in India have historically been designed to aid and guide agriculture and cultivation, the agri-met bulletins, alerts and products are copious. Hence IMD/MoES listens to the needs of the agricultural departments and, more recently, disaster management agencies. Unfortunately, the interface with public is still minimal, which this central government can also easily remedy.

Filed Under: Latest, Monsoon 2015 Tagged With: 2015, climate, earth sciences, El Nino, forecast, IMD, India, ISRO, monsoon

The state of the climate, scarier than ever before

July 20, 2015 by Climate portal editor Leave a Comment

ICP_NOAA_climate_report_201507

Most essential indicators of Earth’s changing climate continued to reflect trends of a warming planet, with several markers such as rising land and ocean temperature, sea levels and greenhouse gases setting new records.

The latest report which explains these indicators, compiled by the NOAA Center for Weather and Climate at the National Centers for Environmental Information is based on contributions from 413 scientists from 58 countries. It provides a detailed update on global climate indicators, notable weather events, and other data collected by environmental monitoring stations and instruments located on land, water, ice, and in space.

The report represents data from around the globe and gives us a picture of what happened in 2014. The variety of indicators shows us how our climate is changing, not just in temperature but from the depths of the oceans to the outer atmosphere. The report’s climate indicators show patterns, changes and trends of the global climate system. Examples of the indicators include various types of greenhouse gases; temperatures throughout the atmosphere, ocean, and land; cloud cover; sea level; ocean salinity; sea ice extent; and snow cover.

Key highlights from the report include (get the full report here, find a summary here):

* Greenhouse gases continued to climb: Major greenhouse gas concentrations, including carbon dioxide, methane and nitrous oxide, continued to rise during 2014, once again reaching historic high values. Atmospheric CO2 concentrations increased by 1.9 ppm in 2014, reaching a global average of 397.2 ppm for the year. This compares with a global average of 354.0 in 1990 when this report was first published just 25 years ago.

* Record temperatures observed near the Earth’s surface: Four independent global datasets showed that 2014 was the warmest year on record. The warmth was widespread across land areas. Europe experienced its warmest year on record, with more than 20 countries exceeding their previous records. Africa had above-average temperatures across most of the continent throughout 2014, Australia saw its third warmest year on record, Mexico had its warmest year on record, and Argentina and Uruguay each had their second warmest year on record. Eastern North America was the only major region to experience below-average annual temperatures.

Surface temperature anomalies in 2014. Image: NOAA Center for Weather and Climate

Surface temperature anomalies in 2014. Image: NOAA Center for Weather and Climate

* Tropical Pacific Ocean moves towards El Niño–Southern Oscillation conditions: The El Niño–Southern Oscillation was in a neutral state during 2014, although it was on the cool side of neutral at the beginning of the year and approached warm El Niño conditions by the end of the year. This pattern played a major role in several regional climate outcomes.

* Sea surface temperatures were record high: The globally averaged sea surface temperature was the highest on record. The warmth was particularly notable in the North Pacific Ocean, where temperatures are in part likely driven by a transition of the Pacific decadal oscillation – a recurring pattern of ocean-atmosphere climate variability centered in the region.

* Global upper ocean heat content was record high: Globally, upper ocean heat content reached a record high for the year, reflecting the continuing accumulation of thermal energy in the upper layer of the oceans. Oceans absorb over 90 percent of Earth’s excess heat from greenhouse gas forcing.

* Global sea level was record high: Global average sea level rose to a record high in 2014. This keeps pace with the 3.2 ± 0.4 mm per year trend in sea level growth observed over the past two decades.

* The Arctic continued to warm; sea ice extent remained low: The Arctic experienced its fourth warmest year since records began in the early 20th century. Arctic snow melt occurred 20–30 days earlier than the 1998–2010 average. On the North Slope of Alaska, record high temperatures at 20-meter depth were measured at four of five permafrost observatories. The Arctic minimum sea ice extent reached 1.94 million square miles on September 17, the sixth lowest since satellite observations began in 1979. The eight lowest minimum sea ice extents during this period have occurred in the last eight years.

* The Antarctic showed highly variable temperature patterns; sea ice extent reached record high: Temperature patterns across the Antarctic showed strong seasonal and regional patterns of warmer-than-normal and cooler-than-normal conditions, resulting in near-average conditions for the year for the continent as a whole. The Antarctic maximum sea ice extent reached a record high of 7.78 million square miles on September 20. This is 220,000 square miles more than the previous record of 7.56 million square miles that occurred in 2013. This was the third consecutive year of record maximum sea ice extent.

* Tropical cyclones above average overall: There were 91 tropical cyclones in 2014, well above the 1981–2010 average of 82 storms. The 22 named storms in the Eastern/Central Pacific were the most to occur in the basin since 1992. Similar to 2013, the North Atlantic season was quieter than most years of the last two decades with respect to the number of storms.

Filed Under: Current Tagged With: Arctic, climate, El Nino, ENSO, greenhouse gas, NOAA, sea ice, Southern Oscillation, thermal energy

Earth, sea, sky, El Niño

June 17, 2015 by Climate portal editor Leave a Comment

ICP_20150617_sm

Eight-and-a-half degrees north of the equator is where the peninsula of India meets the ocean. Our country stretches across 29 degrees of latitude but it is in the vast watery realm south of Kanyakumari that the Indian summer monsoon is brewed, slowly and inevitably. Over twice as many lines of latitude stretches the Indian Ocean, its equatorial belt and then its southern reaches, which continue into the deep and icy girdles of water around Antarctica.

From this vast aqueous quarter-planet the vapours are gathered, and these swirls of airborne water then look for the winds to transport them, first towards the mid-southern latitudes (Madagascar lies astride these, but they are are still a full ten degrees south of the lower coasts of Java) and then in the equatorial trough that spins like a motor. From here these enormous masses of water – half again the size of India at times – are hurled as if in slow motion towards our western coast.

And so to gauge imperfectly whether the wind lords of the farther Indian Ocean have decided to be kind to us we rely nowadays on our eyes in the sky, our weather satellites. What they tell us now is coded in electronic chirps made intelligible by the meteorologists and climatologists of the Indian Meteorological Department, the Ministry of Earth Sciences, the Indian Institute of Tropical Meteorology and the National Centre for Medium Range Weather Forecasting.

Our Indian summer monsoon is amongst the most complex of the planet’s earth-sea-sky interactions. We are told by the scientists, when they disengage from their equations, that the land retains a shorter climate ‘memory’ than the ocean. We are introduced to meridonal termperature gradients and seasonal migration of the inter-tropical convergence zone.

There is an abundance of exotic nomenclature: the Mascarene High, the orographic influence of the East African Highlands, the momentum of the Somali Jet, the ventilation effect of poleward precipitation. And then there is the hot star of the equatorial deeps, El Niño himself, whose domain is the central Pacific and who, when he awakes, demands that the equatorial Indian Ocean obey. He has awoken this year, but the ocean named after us is as unruly as ever.

When will El Niño’s whip really crack? The best models of the climate scientists cannot truly tell us. They and their teraflop calculating machines can only posit what is measured, and what remains unmeasured is still far greater. What we do however know about El Niño is that he does tend to suppress the monsoon. But this year’s El Niño may not resemble one of an earlier year, for where El Niño arises and rules is as important as when. Where the ocean surface warms up (several thousand kilometres parallel to the equator, several hundred kilometres wide) unusually strong rising air flows result.

When these flows descend (as they eventually must) they are generally dry and stable, and so the opposite of conditions needed for or monsoon rains. If they descend far away from India (as happened in 1997-98 when they dropped back into the eastern Pacific) our ocean will deliver and our monsoon will roll in. If they descend in the middle of the Pacific (which happened in 2002) our monsoon will resent the interference and hide. But El Niño is awake and pacing the Pacific. We must hope he does not look too far westwards. (RG)

Filed Under: Blogs, Monsoon 2015 Tagged With: Climate Change, earth science, El Nino, ENSO, India, Indian Ocean, monsoon, planet

Being prudent about forecasts

June 3, 2015 by Climate portal editor Leave a Comment

ICP_pre-monsoon_seasons_2011-15_sm

The Earth System Science Organisation (ESSO), Ministry of Earth Sciences (MoES) and the India Meteorological Department (IMD) released their second long range forecast for monsoon 2015 on 2 June. The ‘headline’ message is that rainfall for the June to September monsoon season is very likely to be 88% of what is normal for the season.

The forecast has been seized upon by various quarters as having serious implications for the production of crop staples (and therefore for food security), for farmers’ livelihoods, for consumer prices and for the availability of water. These are all valid and important aspects that depend entirely or substantially upon the summer monsoon.

But, the IMD, the ESSO and the MoES do not make statements and forecasts on these aspects. They are concerned with what the climatological data and signs point to, and that is what they have told us. How the forecast relates to important aspects of food, farm incomes, water resources and food stocks relies on interpretations. Our advice – to the media, to government agencies and to the private sector – is to go slow on drawing conclusions and when conclusions are required, to make them incrementally.

The wettest pre-monsoon season (March to May) for five years.

The wettest pre-monsoon season (March to May) for five years.

Using the handy graphic here, (887KB) we also point out that the pre-monsoon season (March to May) for 2015 has been the wettest in five years. In several meteorological sub-divisions, excess rain has been recorded during this pre-monsoon season. In several districts, the annual rainfall total has already been reached, even before the typical monsoon season of June to September.

This ought to be warning enough to us to be sparing with deciding how forecasts will affect us. The ESSO, IMD and MoES have repeated, in their second long range forecast, that 2015 is an El Niño year which only means that as this sea temperature phenomenon waxes and wanes though the remainder of 2015, so too will the monsoon system react.

It is best to judge our Indian summer monsoon a week at a time, keeping in mind crop calendars and how much water our reservoirs hold. It is always prudent to take precautions such as rationing water (even when it is raining), especially in towns and cities. Likewise, district administrations will do well to assess their local supplies of food staples and match these figures with what food staples their districts are likely to produce during a monsoon whose reliability has now been written off.

The second long range forecast for monsoon 2015 is available here, and the Hindi text can be found here.

Filed Under: Monsoon 2015, Reports & Comment Tagged With: 2015, climate, consumer price, crop, El Nino, farm, food stock, forecast, IMD, India, meteorology, monsoon, sea surface temperature, water

How El Niño plans to hijack monsoon 2015

May 26, 2015 by Climate portal editor Leave a Comment

ICP_El_Nino_monsoon_20150526_sm
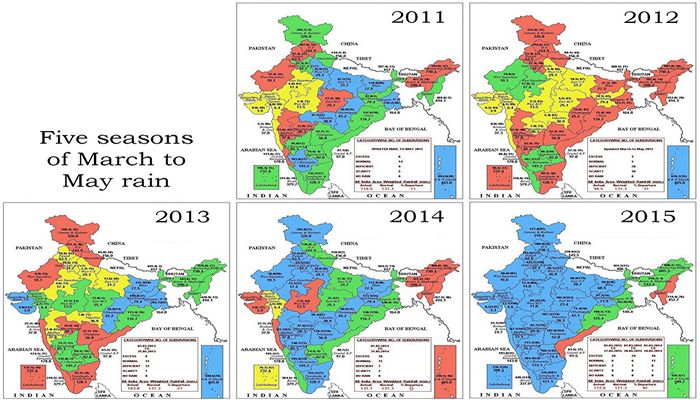
Whether the monsoon starts off on time, whether the June, July, August and September rainfall averages are met, and whether the seasonal pattern of the monsoon is maintained are expectations that must now be set aside.

According to the Climate Prediction Center’s ENSO probability forecast, there is a 90% chance that El Niño conditions will prevail through June to August of the northern hemisphere and a more than 80% percent chance El Niño will last throughout all of 2015.

The Ministry of Earth Sciences El Niño/La Nina, Indian Ocean Dipole Update (10 May 2015)

The Ministry of Earth Sciences El Niño/La Nina, Indian Ocean Dipole Update (10 May 2015)

What this means, especially when record warm global atmospheric temperatures (because we in South Asia and our neighbours in East Asia have continued burned coal as if the resulting CO2 and soot simply doesn’t exist) are being set, is the remaining months of 2015 – the monsoon period included – will bring strange, dangerous and extreme weather. We have already seen that over the last week, with the death toll from the heat wave having crossed 550.

For the first time since 1998 – ­the year of the strongest El Niño on record, which played havoc with the
world’s weather patterns and was blamed for 23,000 deaths worldwide – ­ocean temperatures in all five El Niño zones have risen above 1 degree Celsius warmer than normal at the same time. That is read by climatologists and ocean scientists as presaging an El Niño that is moderately strong to strong. The forecast models updated in May are now unanimous that El Niño is going to keep strengthening through the rest of 2015. (See also the official forecast from the USA’s government climate science agency.)

El Niño’s home is in the tropical eastern Pacific, but we in India need to watch the waters to our south very closely. New research published in the journal Nature Geoscience has examined records going back to 1950 and noticed that Indian Ocean absorbed heat at a low level until 2003. Thereafter, the excess oceanic heat in the Pacific Ocean found its way through the Indonesian archipelago and into the Indian Ocean. This is the gigantic reservoir of watery heat that is going to dictate terms to our summer monsoon, or what our school textbooks call the south-west monsoon.

It is a worry for the entire South Asian region – India, Pakistan, Sri Lanka, Bangladesh, Nepal, the Maldives, Burma, Afghanistan and Bhutan. That is why when the Forum on Regional Climate Monitoring-Assessment-Prediction for Asia (FOCRA) issued its seasonal outlook for June to August 2015 it predicted weaker than normal Indian summer and East Asian monsoons. Precipitation over land is influenced by external factors such as the El Niño Southern Oscillation (the ENSO), the ‘Indian Ocean Dipole’, the ‘Arctic Oscillation’, and so on.

There may be a “timely onset” of the monsoon, as the venerable IMD is used to saying, but that doesn’t mean our troubles are over. Far from it.

Filed Under: Latest, Monsoon 2015 Tagged With: Bangladesh, Bhutan, El Nino, ENSO, India, Indian Ocean, Maldives, monsoon, Nepal, Pacific, Pakistan, Sri Lanka

New El Niño outlook

July 1, 2014 by Climate portal editor Leave a Comment

Sea surface temperature in the Indian Ocean. Image from the earth|nullschool real time visualisation of wind and ocean conditions

Sea surface temperature in the Indian Ocean. Image from the earth|nullschool real time visualisation of wind and ocean conditions

There is a 60% likelihood of an El Niño being fully established between June and August, increasing to 75-80% for the October to December period, according to an El Niño Update issued by the World Meteorological Organisation (WMO). Many countries have already started preparing for the arrival of El Niño, which is associated with regional-scale drought and flood situations in different parts of the world and has a warming influence on global average surface temperatures.

El Niño is characterised by unusually warm ocean surface temperatures in the central and eastern tropical Pacific, coupled with typical atmospheric circulation patterns. It is a natural phenomenon with a recurring interval of 2-7 years and has a major impact on the climate around the world. The last El Niño was in 2009-2010.

The latest WMO outlooks suggest that central tropical Pacific Ocean surface temperatures are likely to warm further into the third quarter of 2014, while the atmospheric patterns associated with El Niño are also expected to form and strengthen.

The WMO expects that El Niño will reach peak strength during the fourth quarter and endure into the first few months of 2015 before dissipating. The substantially above-average oceanic heat content beneath the sea surface of the central and eastern tropical Pacific Ocean, triggered by strong westerly wind events earlier this year, suggested an event of significant strength. However, the delayed atmospheric response, and a potential lack of subsequent westerly wind events in the coming months, may limit the peak strength of the El Niño, said the WMO.

Already, the second quarter of 2014 set new global atmospheric heat records. According to NASA, this May was the hottest in the global measure, meanwhile, the Japanese Meteorological Agency marked the March-April period as the hottest spring in all of the past 130 years (NASA showed the same period was second hottest). Rising Pacific Ocean surface temperatures by themselves were enough, when combined with raging human greenhouse gas heat forcing, to nudge atmospheric temperatures into a new record range. But the emergence of full-blown El Niño will likely push current record readings even higher.

Filed Under: Latest Tagged With: Climate Change, drought, El Nino, flood, WMO, World Meteorological Organisation

ENSO, ISMR, EQUINOO and rain

June 5, 2014 by Climate portal editor Leave a Comment

RG_ICP_20140605An editorial in the journal Current Science (25 May 2014) has helpfully linked three phenomena that will affect the monsoon of 2014. The first is the El Niño (and the El Niño Southern Oscillation or ENSO) over the Pacific Ocean, considered unfavourable for us and the monsoon. The editorial has pointed out that El Niño has featured in the news already, with likely impacts being considered such as “a decrease of about 1.75% of GDP”. The question the editorial asks is: how reliable is the forecast of an impending El Niño? When it does occur, will it bring a deficit monsoon or a drought inevitably?

The second phenomenon is the Indian summer monsoon rainfall (abbreviated to ISMR by those who study climate for the sub-continent). The Current Science editorial makes an important point which is, studying the relationship between the sufficiency of the monsoon, the GDP and food-grain production during 1950–2004 reveals that the magnitude of the adverse impact of deficit rainfall is much larger than the magnitude of the positive impact of above average rainfall. This means that India being able to predict the possibility of drought (and therefore factors that influence it such as the ENSO) is more important than being able to predict a good monsoon.

The editorial has said that the ISMR “is significantly correlated with this ENSO index, with the relationship explaining 29% of the variance of monsoon rainfall”. Thus the warm phase of ENSO, which is characterised by more rainfall over the equatorial central Pacific, is associated with a decrease in rainfall over India. Now that we know this, what are the implications for monsoon 2014? By April, the warm phase of ENSO has already commenced with enhanced convection/rainfall over the central Pacific and all the models predict that it will amplify and persist until the end of the summer monsoon (the models vary in how they look at linked phenomena and the specific conclusions but agree broadly that El Niño conditions are here.

While the editorial has said that by “mid-June we should get a better idea of whether an El Niño is imminent”, the already unfavourable ENSO conditions mean that the probability of drought has gone up to just over 30%. If an El Niño does fully develop by end-June, the chance of a drought increases to 70%.

The explanation becomes more complete with the assessment of the third phenomenon. This is the Equatorial Indian Ocean Oscillation (EQUINOO). In 2003, it was discovered that in addition to ENSO, EQUINOO plays an important role in the variations, from one year to the next, of the ISMR. There is what is called “a see-saw between a state with enhanced rainfall over western equatorial Indian Ocean and suppressed rainfall over eastern equatorial Indian Ocean” (and its opposite). How this becomes manifest from one year to the next is considered by climatologists to account for about 19% of the variance of the monsoon rainfall.

The equation that we will have to finish writing and balance in the next few weeks is this. During the Indian summer monsoon season, ENSO and EQUINOO are poorly correlated – an ENSO unfavourable to us can be counter-balanced to some degree by a favourable EQUINDO. When both are unfavourable to us, drought has occurred. But the records also show that twice recently, in 1963 and in 1997, a favourable EQUINDO has protected us from the harmful impact of an El Niño. We need, in short, to be watching closely multiple large climatic phenomena every day until at least end-June. Is the IMD up to the job?

Filed Under: Blogs, Latest, Monsoon 2014 Tagged With: 2014, drought, El Nino, ENSO, IMD, Indian Ocean, ISMR, monsoon, Pacific

Indiaclimate twitter

Tweets by @Indiaclimate

Notable

Between contemplation and climate

Whether or not the USA, Europe, the Western world, the industrialised Eastern world (China, Japan, South Korea, Taiwan), adhere to or not their paltry promises about being more responsible concerning the factors that lead to climate change, is of very little concern to us. We have never set any store by international agreements on climate […]

The ‘Hindu’, ignorant about weather and climate, but runs down IMD

We find objectionable the report by ‘The Hindu’ daily newspaper accusing the India Meteorological Department of scientific shortcoming (‘IMD gets its August forecast wrong’, 1 September 2016). The report claims that the IMD in June 2016 had forecast that rains for August would be more than usual but that the recorded rain was less than […]

dialogue

  • Misreading monsoon | Resources Research on Misreading monsoon
  • Satish on A tribute to the weathermen of Bharat
  • Climate portal editor on A tribute to the weathermen of Bharat
  • Climate portal editor on A tribute to the weathermen of Bharat
  • Climate portal editor on A tribute to the weathermen of Bharat

Categories

Copyright © 2025 indiaclimateportal.org.