The India Climate Observatory

Commentary, action and research on climate and development in India

  • Home
  • About
  • Monsoon 2018
  • Current
  • Bulletin
  • Contact
  • Announcements

The Indiaclimate Rainfall Index 2019

July 15, 2019 by Climate portal editor Leave a Comment

We have compiled the Indiaclimate District Rainfall Adequacy Index for the monsoon season of 2019. As with our previous editions of the index series, this one for the 2019 monsoon applies our innovation to the communicating of the weekly changes in rainfall adequacy as recorded by the India Meteorological Department (IMD).

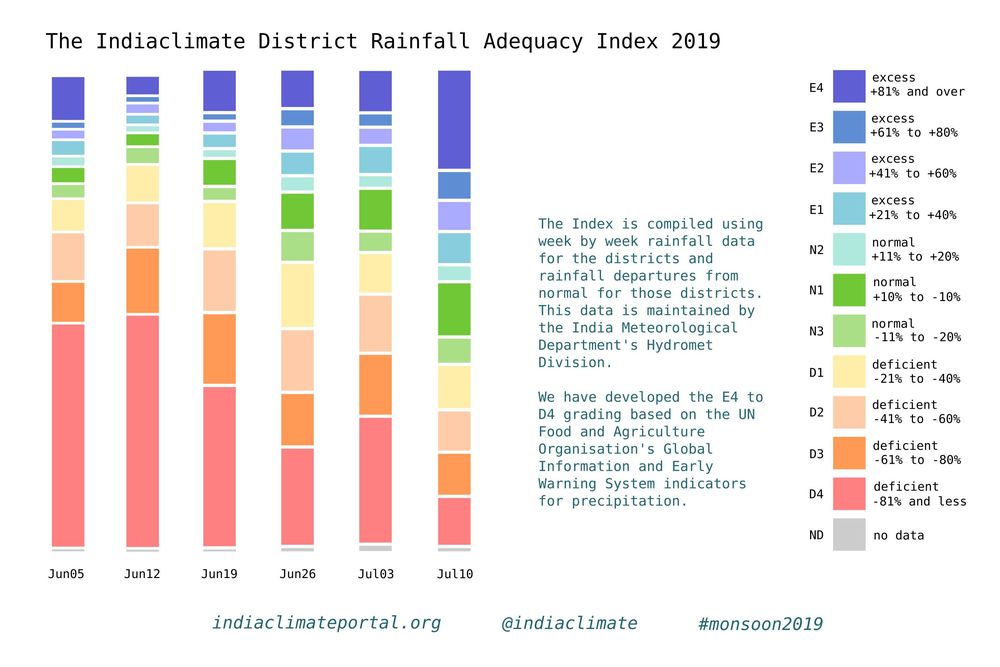
The graph (or visualisation as any such illustration is called nowadays, a word that makes the simple graph or chart sound sophisticated, but which usually complicates matters instead of simplifying them) is easy enough to read and interpret. What you have is several vertical bars, each corresponding to dates a week apart. The bars are made up of coloured segments – there are 11 coloured segments and one grey segment, a total of 12 segments.

Each of the 11 colours represents the number of districts whose rainfall readings for a week (the week till the date given) fall within the parameters given in the accompanying legend. There are three groups of colours: three segments in the ‘normal’ ranges, four segments in the ‘excess’ ranges and four segments in the ‘deficient’ ranges. Grey represents no data for that week.

The gradation of the segments is based on, but is not a copy of, the grades used by the UN Food and Agriculture Organisation’s (FAO) Global Information and Early Warning System (GIEWS) indicators for precipitation. The numbers that we use are from the IMD’s Hydrometeorology Division, which releases its ‘rainfall departures’ table every week. We take these numbers, reprocess them and redistribute them across the 11 grades.
It is a much more readily readable graph and provides for quick interpretation. The grades are finer than the six used by the IMD: normal (+19% to -195), excess (+20% to +59%), large excess (+60% or more), deficient (-20% to -59%), large deficient (-60% to -99%), no rain (-100%).

Our index, in which most segments are of 20 percentage points, is designed for local administrations – in districts but also municipal bodies – to take their cues from weekly signals and prepare if need be for a drought-like situation with water shortages or a flood-like situation with inundation.

How does it work in practice? Let’s look at the district of Guna, in Madhya Pradesh, in the meteorological sub-division of Western MP. The first two monsoon weeks, ending 5 June and 12 June, Guna received no rain (that is, -100% of the rainfall it normally receives in those weeks) and that corresponds to the D4 indicator. The next week, ending 19 June, it received -29% which is D1, the fourth week (26 June) it slipped back to -72% which is D3, the following week (3 July) it improved to -32% which is again D1 and in the sixth week (10 July) Guna received +34% which took it into the E1 grade.

Normally, a district that has received no rainfall or neglible rainfall for six weeks becomes a candidate for a drought-like condition – water sources after the long and hot summer have dried up and crops become parched. If such conditions continue for another two weeks, the state administration must roll out relief measures.

In our example, for the five weeks until the week of 3 July Guna had two D4s, one D3 and two D1s before coming out of the D grades. Our index gives the district (or town) administration the means with which to set their own triggers for action. If the water sources in the district were still at 10%-15% of their water holding capacities by the week of 3 July, then they could consult the medium term forecasts to gauge whether likely rainfall will be enough to hold off relief action. If not, and stored water slipped under 10% with uncertain forecasts, they could ask for relief and issue appropriate crop advisories.
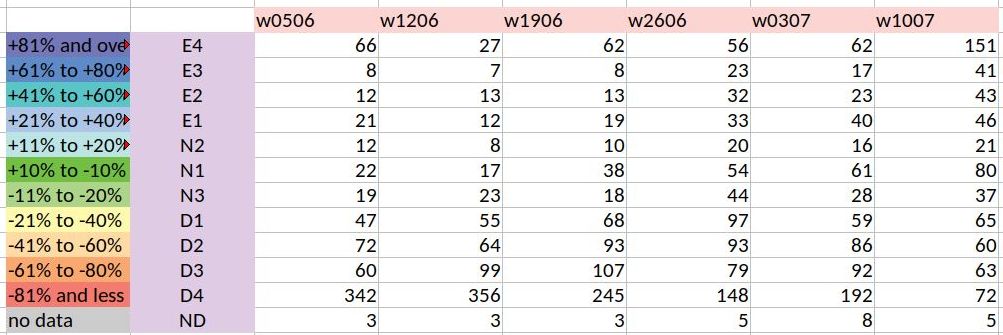
Our index graph – the stacked and segmented bar chart I am sorely tempted to call a ‘signature’ – is a representation of the numbers in the rainweeks table we compile. This table has 684 components which are the districts, each of which has a rainfall reading for the week given (in millimetres) and a rainfall departure (in %). The graph is a set of stacked bars for each week, with each segment sized according to the number of districts in the grade that the segment corresponds to.

What does the index graph for six weeks tell us? The first two monsoon weeks were alarming, with 342 and then 356 districts in the D4 grade. The situation has slowly improved thereafter, with the latest week, that of 10 July, being the best so far – it has 80 districts in the N1 grade. That last week also has for the first time in monsoon 2019 more E grade districts than D grade districts. What needs to be looked out for is districts that have been in the D4 and D3 grades for four and more weeks and whose recovery is patchy. That monitoring becomes much easier with the Indiaclimate District Rainfall Adequacy Index.

Rahul Goswami
Filed Under: Latest, Monsoon 2019 Tagged With: 2019, agriculture, district, drought, flood, India, monsoon, rainfall, water

Dry districts alert, May 2017

May 1, 2017 by Climate portal editor Leave a Comment

A large number of districts in south, peninsular, central and eastern India are experiencing dry and semi-arid conditions which will continue, and likely become worse, until the 2017 monsoon becomes active.

This list of districts is based on our re-working of the maps released weekly by the India Meteorological Department (Hydromet section in Pune), which show the district-level standardised precipitation index (or SPI). While this is not a drought or dryness index, the weekly SPI serves as a very reliable indicator of where water stress is occurring, and is therefore an invaluable aid for relief planning.

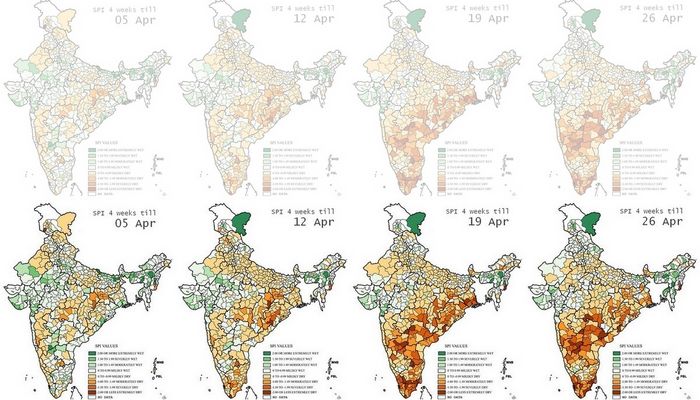
In this series of four maps, re-coloured by us to better display differences in SPI between regions and over time, the change in south India stands out.

Each map displays the SPI as a cumulative reading of the four weeks until the date given. That is why the change for any district – from ‘moderately dry’ to ‘severely dry’ for example – needs to be seen as having an immediate bearing on the available water, crop health and condition of forest and pasture for that district.

Based on the readings for 26 April 2017 this is the list of districts that need urgent attention.

Maharashtra: Gadchiroli, Chandrapur, Yavatmal, Kolhapur
Chhattisgarh (Raipur division): Gariaband, Raipur, Baloda Bazar
Odisha: Rayagada, Kandhamal, Angul, Cuttack
West Bengal: 24 Parganas North
Manipur: Chandel
Andhra Pradesh: Vizianagaram, Kurnool
Telengana (old district boundaries): Nizamabad, Karimnagar, Medak, Warangal, Khammam, Mahbubnagar
Karnataka: Bidar, Raichur, Bijapur, Bagalkot, Koppal, Gadag, Dharwad, Bellary, Shimoga
Tamil Nadu: Cuddalore, Nagapattinam, Tiruvarur, Thanjavur, Pudukkottai, Ramanathapuram, Toothukudi, Kaniyakumari, Theni, Coimbatore
Kerala: Malappuram, Thrissur, Ernakulam, Kottayam, Alapuzha

Filed Under: Latest Tagged With: 2017, Andhra Pradesh, arid, Bharat, district, drought, India, Karnataka, Kerala, Maharashtra, Odisha, summer, Tamil Nadu, Telengana, water

South India’s water emergency

April 11, 2017 by Climate portal editor Leave a Comment

ICP_res_20170410_topBy the end of the first week of April 2017, the most current and reliable indicator for stored water in south India showed how dire the situation has become. And the South-West monsoon is still about eight weeks away. The weekly data sheet on the stored water quantities in the 91 major reservoirs of India, which is maintained and released by the Central Water Commission, has in the 6 April 2017 release shown the scale of the water emergency.
Of the 31 reservoirs in the southern region (Kerala, Tamil Nadu, Karnataka, Telengana and Andhra Pradesh) that are among the major reservoirs of India, 18 have stored water that is less than 15% of their full capacities.

These 18 are (ranked by least water stored):
Nagarjuna Sagar, APTG, 0.00%
Sholayar, TN, 0.00%
Almatti, KAR, 0.03%
Kabini, KAR, 2.25%
Vanivilas Sagar, KAR, 2.74%
Tungabhadra, KAR, 3.21%
Vaigai, TN, 4.07%
Parambikulam, TN, 5.00%
Malaprabha (Renuka), KAR, 5.56%
Hemavathy, KAR, 5.72%
Mettur (Stanley), TN, 6.72%
Periyar, KER, 6.94%
Bhadra, KAR, 9.02%
Lower Bhawani, TN, 9.09%
Srisailam, APTG, 9.44%
Krishnaraja Sagar, KAR, 11.44%
Malapmuzha, KER, 11.61%
Aliyar, TN, 14.74%
(TN is Tamil Nadu, KER is Kerala, KAR is Karnataka, APTG is Andhra Pradesh and Telengana)

ICP_south_water_20170411

Using a municipal average of about 400 litres per day per household that is a typical designed supply (not delivered, for that’s another tale), how much water does this allow for the 60.51 million households of the southern region until the monsoon begins?

Tamil Nadu has 18.46 million households, Kerala has 7.83 million, Karnataka has 13.3 million, Andhra Pradesh and Telengana have 20.92 million. These together need 24.2 billion litres a day or, in reservoir storage terms, 0.024 billion cubic metres (bcm) a day. The 31 major reservoirs of southern India together have, as of 6 April 2017, 6.583 bcm. From this quantity is taken water for industrial, agricultural and commercial use.

These uses are given priority or water stocks are secured (never mind allocation and metering) especially by industry. Normally, what remains for household use is about a third of the available stock. This leaves, as on 6 April, about 2.19 bcm for household use, which will suffice the 60.51 million households of south India for about 90 days – but only provided, and this is the stringent, non-negotiable condition that must be enforced, all households especially urban keep within the 400 litres per household per day limit.

The situation does not improve even if the monsoon arrives on time and the first weeks deliver normal rainfall. It is only by July 5-15 that reservoir water stocks begin trending upwards. This is where the 90-day restricted supply can take south India to. But only if immediate and strict rationing is imposed, as it should have been, to allow for climatological variance, by 1 March 2017.

Filed Under: Latest Tagged With: Andhra Pradesh, Bharat, drought, India, Karnataka, Kerala, reservoir, Tamil Nadu, Telengana, water, water shortage, water supply

Prepare for May heat

May 4, 2016 by Climate portal editor Leave a Comment

ICP_May_heat_20160504The heat outlook for the first half of May, which was released by the India Meteorological Department (IMD) on 02 May, calls for immediate attention and preparation on all fronts.
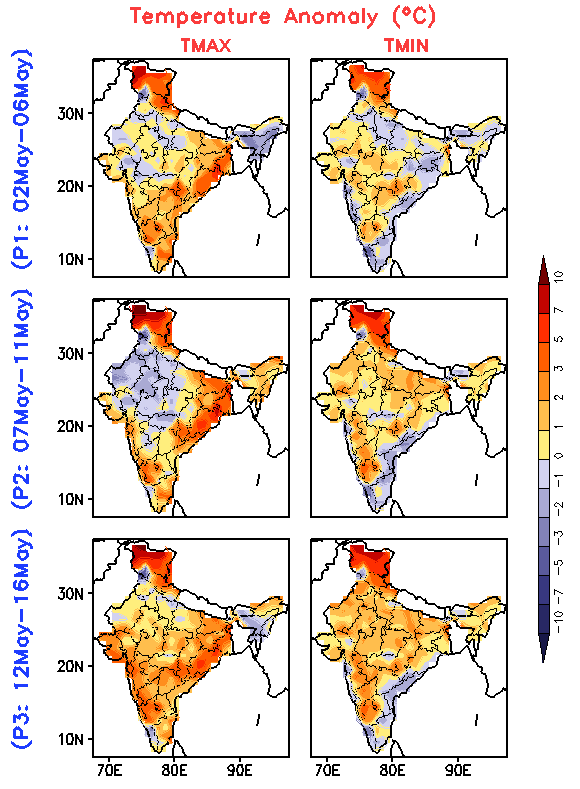
The forecast is for three periods of five days each (called pentads) with expected temperature anomalies given for maximum and minimum temperatures. The big picture is that over some parts of the country maximum temperatures will remain 3-4 C above normal for all the three pentads.

Minimum temperatures that are 1-5 degrees higher than normal will increase in terms of the geographical range as the days progress through the first, second and third pentad: 02 to 06 May, 07 to 11 May and 12 to 16 May.

There are several particular alerts arising from the IMD heat wave outlook:

The heat outlook for the first half of May, released by the India Meteorological Department (IMD), for the three five-day periods of 02 to 06 May, 07 to 11 May and 12 to 16 May.

The heat outlook for the first half of May, released by the India Meteorological Department (IMD), for the three five-day periods of 02 to 06 May, 07 to 11 May and 12 to 16 May.

1. Odisha, Gangetic West Bengal and south Chhattisgarh, which have seen some record-breaking high temperatures in April, will continue to see above normal maximum temperatures.

2. South Interior Karnataka, coastal Maharashtra and Goa (the Konkan), and Saurashtra will experience a gradual rise in maximum temperatures from the first to third pentad.

3. Maximum and minimum temperatures both, in Jammu and Kashmir, Himachal Pradesh and Uttarakhand will remain around 5 C above normal for the duration of the forecast.

4. The 12 to 16 May period (third pentad) will see higher than normal maximum temperatures (2 to 5 C) over almost the entire country, and higher than normal minimum temperatures over most of the country.

Other observations are:

5. The North-East will experience minimum temperatures about a degree higher than normal during 07 to 16 May.

6. For the second pentad, that is 07 to 11 May, maximum temperatures in north-west India (Punjab, Haryana, western Uttar Pradesh, Rajasthan, western Madhya Pradesh, Delhi) will drop by 2 to 3 C.

7. Coastal Andhra Pradesh, Rayalaseem and Tamil Nadu will experience lower minimum temperatures by 1 to 2 C during 07 to 16 May.

Please observe basic precautions during this period in particular: eat smaller meals more often; drink water even when not thirsty; avoid tea, coffee and alcohol; plan your activities to avoid being outdoors during 11am to 4pm; do not leave children in cars by themselves; keep a watch on the elderly especially those who are infirm or invalid; wear non-synthetic non-polyester light-coloured and loose fitting clothes; if working outdoors rest frequently; provide drinking water and shade to animals and pets.

Filed Under: Current Tagged With: Bharat, climate, drought, forecast, heat, heat wave, IMD, India, India Meteorological Department, temperature, water

Dry tale of ten rain weeks

August 23, 2014 by Climate portal editor Leave a Comment


RG_ICP_20140823_pic

What a monsoon season is can no longer be judged by the over-simplified sums that assure the country about departures from an ‘average’ and the potential of ‘catching up’ as a season progresses. Since the 2009 drought, the awareness of farmers’ cooperatives and groups about the meteorological products and data available with the only provider of such measurements has grown. What has not grown is the willingness of government agencies on the one hand, and the consuming public on the other, to make similar investments in pursuing such clarity.

The area chart with its jagged stripes is the simplest indicator of the gap between the central government’s sanguine response to a very serious monsoon deficit, and the conditions that our districts have recorded since the first week of June 2014. The chart, based on the Indian Meteorological Department’s weekly district recordings of rainfall, plots 641 of these readings over ten weeks.

Our modified monsoon measure shows the overall trend, and made the case early for state and district level relief.

Our modified monsoon measure shows the overall trend, and made the case early for state and district level relief.

It is immediately clear that the green stripe (for ‘normal’) has at no point been significantly larger than any one of the other three important stripes, coloured deep red (for ‘scanty’), peach (for ‘deficient’) and blue (for ‘excess’).

In the seventh week of monsoon 2014 (17 to 23 July 2014) the number of districts that recorded normal rainfall for that week was 126, and that is the maximum number that have reported normal rainfall for a week. The next highest number of districts reporting normal for a week is 92, which was for the preceding week (10 to 16 July 2014).

More serious is the district-level reporting for the following three weeks – ending 30 July, 06 August and 13 August – which show the number of districts that reported normal rain for each week was less than 20% of the number of districts that reported deficient, scanty or excess rainfall. It was during this period that central government ministries and agencies did not publicly disclose the widespread monsoon deficiency and which did not act, by alerting the consuming public, to the short and medium term consequences of the monsoon crisis.

The modified monsoon measure (which has been advocated as a method to prime local administrations towards early recognition of the need for relief and remedial action in drought and drought-like conditions) displays to greater effect the glaring imbalance between ‘normals’ and their absence in the districts. In every one of the ten weeks, the light red bar (the ‘deficient 2’ measure, for rainfall of 21% less and lower) dominates.

Otherwise it is the dark blue bar (the ‘excess 2’ measure, for rainfall of 21% more and above) which is next most prominent. This is the clearest signal from a close reading of the district rainfall reportage that volatility in rainfall quantities is the feature most visible throughout monsoon 2014.

The IMD’s running table of the distict rainfall departures confirms this trend for monsoon 2014. In many of the 36 meteorological sub-divisions, weeks of scanty and deficient rainfall are broken by normal or excess rainfall, only to return to scanty and deficient. Taking the districts of Odisha and of western Madhya Pradesh as examples, this volatility can be seen at a glance, and is in concurrence with the overall trends that the modified monsoon measure has been indicating for the last two months.

IMD_weekly_ODI_MP_sm

Filed Under: Current, Monsoon 2014 Tagged With: 2014, agriculture, district, drought, IMD, India, inflation, kharif, monsoon, rabi, rainfall

Seeing the local in six rain weeks

July 23, 2014 by Climate portal editor Leave a Comment

RG_ICP_20140723_picWe urge the Ministry of Earth Sciences, the India Meteorology Department and the Ministry of Information and Broadcasting to cease the use of a ‘national’ rainfall average to describe the progress of monsoon 2014. This is a measure that has no meaning for cultivators in any of our agro-ecological zones, and has no meaning for any individual taluka or tehsil in the 36 meteorological sub-divisions. What we need to see urgently adopted is a realistic overview that numerically and graphically explains the situation, at as granular a level as possible.

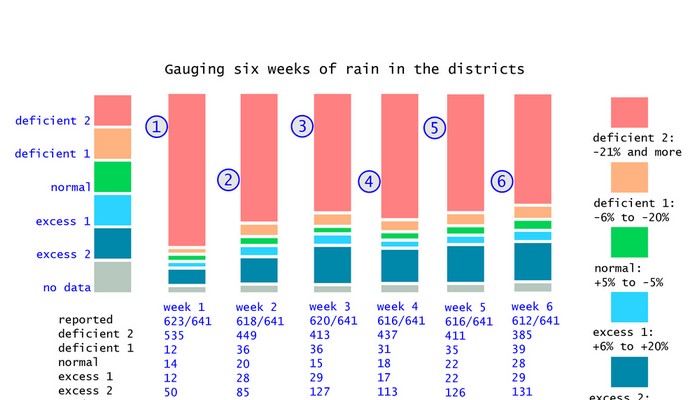
Using a revised categorisation of rainfall sufficiency levels (the method and the reasoning is available here) we find that for the fifth and sixth weeks of monsoon, there has been a small improvement which does not lower the high likelihood of drought conditions becoming prevalent in districts and scarcity of water for our settlements. The full-size chart is available here as an image, and explains in detail the rainfall that districts are reporting.

The fifth monsoon week is 03 to 09 July 2014 and the sixth monsoon week is 10 to 16 July 2014. There has been a small addition to the revised normal rainfall category (-5% to +5%), rising from 18 districts recording normal rainfall in the 4th week to 22 in the 5th and 28 in the 6th. There has also been an improvement in the number of districts recording deficit-2 levels of rainfall (-21% and more) with 437 in the 4th week, 411 in the 5th week and 385 in the 6th week. For the remainder of July the likelihood of more rainfall in the districts that have recorded normal or excess-1 (+6% to +20%) is small, according to the available forecasts, and this means that monsoon 2014 will begin August with far fewer districts registering normal rainfall than they should at this stage.

Filed Under: Current, Monsoon 2014 Tagged With: 2014, agriculture, crop, deficient, district, drought, monsoon, normal, rainfall, scanty, scarce, sowing, water

Government readies drought plan

July 18, 2014 by Climate portal editor Leave a Comment

The drought management information system is in place and working.

The drought management information system is in place and working.

The Ministry of Agriculture through the Department of Agriculture and Cooperation has released its national drought crisis management plan. This is not taken as the indicator that drought conditions are expected to set in, but to prepare for them where they are identified. In the fifth week of the South-West monsoon, the trend continues to be that week by week, the number of districts that have recorded less rainfall than they normally receive outnumber those districts with normal rainfall. When this happens over a prolonged period, such as four to six weeks, drought-like conditions set in and the administration prepares for these conditions. [Links to the documents are at the end of this posting.]

There are a group of ‘early warning indicators’ for the kharif crop (sowing June to August) which are looked for at this time of the year. They are: (1) delay in the onset of South-West monsoon, (2) long ‘break’ activity of the monsoon, (3) insufficient rains during June and July, (4) rise in the price of fodder, (5) absence of rising trend in the water levels of the major reservoirs, (6) drying up of sources of rural drinking water, (7) declining trend in the progress of sowing over successive weeks compared to corresponding figures for ‘normal years’.

On this list, points 1 and 2 are true, 3 is true for June and July until now, 4 and 5 are true, we have insufficient information for 6 and 7 but from mid-May there have been a number of media reports on water scarcity in the districts of peninsular, central and northern India. Thus the state of the ‘early warning’ indicators taken together have triggered the issuing of the government’s drought crisis management plan.

“The identified priorities of CMP are to clarify the goals and define the roles and responsibilities of various responders (ministries / departments, organisations and individuals) involved in crisis management, and putting together a communication process for quickly notifying the public in the event of a crisis,” the ministry has explained. “The plan outlined in this document does not replace the emergency procedures or contingency action plans already drawn by different agencies, but has been developed to address crisis situations that have the potential for a much greater impact on the nation.”

The reason we have plans at the national and state level, and contingency plans for each district in the event of drought, drought-like conditions, and water scarcity is the combination of several factors:

  • Every year more than 50 million people are directly exposed to drought and its effects, with 16% of India’s total area considered prone to drought.
  • In four out of every ten years rainfall in India is erratic.
  • Drought in varying degrees affects 68% of the sown area.
  • Regions with annual rainfall of 750-1,125 millimetres account for 35% of the land area and are drought prone.
  • Most of these zones lie in the arid (19.6%), semi-arid (37%) and sub-humid (21%) regions of India.
  • Up to three-quarters of the annual average rainfall occurs over 120 days of the year. A third of the total land area receives less than 750 mm of rainfall and is chronically drought prone.

In this ‘warning phase’ – which many districts have entered – the crisis management plan calls for short-term water conservation measures by municipal and district agencies, water-budgeting by the Ministry of Water Resources (Irrigation), the Ministry of Urban Development and by the Department of Drinking Water and Sanitation. Municipal and town councils are instructed to identify alternative sources of water when the town is in a ‘warning’ period and the supply of water may be restricted to 70 litres per person per day (about half of the normal 135). Water rationing and restricted use become urgent with municipal and town councils instructed to ensure that drinking water is not used for other purposes (like washing cars, watering gardens, and so on).

State governments have in place standing instructions of designating officers responsible for meeting the needs of rural and urban citizens during drought and drought-like conditions. This document contains the list of nodal officers of the line ministries and departments, and of the Ministry of Agriculture’s drought management division, with their contact details. The full crisis management plan of the Ministry of Agriculture, Department of Agriculture and Cooperation, is here.

Filed Under: Latest, Monsoon 2014 Tagged With: 2014, contingency, district, drought, India, kharif, ministry, monsoon, municipality, reservoir, sarcity, town, urban development, water resources

Gauging four weeks of rain in the districts

July 8, 2014 by Climate portal editor Leave a Comment

ICP_four_weeks_rain_graphic_20140709

We now have rain data for four complete weeks from the India Meteorological Department (IMD) and for all the districts that have reported the progress of the monsoon. The overall picture is even more serious than reported earlier because of the falling levels of water in the country’s major reservoirs. [05 to 11 June is the first week. 12 to 18 June is the second week. 19 to 25 June is the third week. 26 June to 02 July is the fourth week.]

Using the new measure of assessing the adequacy of district rainfall (and not the meteorological gradations that is the IMD standard), in the fourth week of the monsoon the number of districts that reported normal rains in that week (+5% to -5%) is 16; deficient 1 (-6% to -20%) is 31; deficient 2 (-21% and more) is 437; excess 1 (+6% to +20%) is 17; excess 2 (+21% and more) is 113; no data was reported from 25.

Filed Under: Monsoon 2014, Reports & Comment Tagged With: 2014, contingency, district, drought, earth science, forecast, hydrology, IMD, India, monsoon, rainfall

Why there is no ‘normal’ in our monsoon

July 4, 2014 by Climate portal editor Leave a Comment

RG_ICP_monsoon_20140704

The idea of a ‘revival’ of a delayed and weakened monsoon is a misleading one and the country’s earth science agencies must advise against the term being used. In particular, our news media must cease using this term as it implies, incorrectly, that rainfall can be ‘made up’ even though current ‘averages’ are low.

This group of maps of the 2014 monsoon is in three parts. Each part is composed of four separate but linked maps, two each in two rows. This is how you read each of the three sets: the top left map in a group of four shows the anomaly (in millimetres) of rainfall for the days measured. In this map, ochre yellow and dark growns are regions with the least rain compared to what they should have received, while those shaded in blues have received more than they normally do. The second map, top right, shows the percent of normal rain - light and dark browns being percentages very much lower than normal and greens and blues above. The lower left map in each group shows the accumulated rainfall for the measured days in millimetres, with green then blue and then orange showing the increasing levels of accumulated rain. In contrast, the lower right map shows the normal cumulative rainfalls for the same period. As with the group of four maps for the seven day period, the groups for the ten and 30 day rainfall measurement cycles follow the same pattern. In this panel, the seven day period is 26 June to 02 July 2014, the ten day period is 23 June to 02 July 2014 and the 30 day period is 03 June to 02 July 2014. The maps are by the Climate Prediction Center, NOAA Center for Weather and Climate Prediction, USA.

This group of maps of the 2014 monsoon is in three parts. Each part is composed of four separate but linked maps, two each in two rows.
This is how you read each of the three sets: the top left map in a group of four shows the anomaly (in millimetres) of rainfall for the days measured. In this map, ochre yellow and dark browns are regions with the least rain compared to what they should have received, while those shaded in blues have received more than they normally do. The second map, top right, shows the percent of normal rain – light and dark browns being percentages very much lower than normal and greens and blues above.
The lower left map in each group shows the accumulated rainfall for the measured days in millimetres, with green then blue and then orange showing the increasing levels of accumulated rain. In contrast, the lower right map shows the normal cumulative rainfalls for the same period.
As with the group of four maps for the seven day period, the groups for the ten and 30 day rainfall measurement cycles follow the same pattern. In this panel, the seven day period is 26 June to 02 July 2014, the ten day period is 23 June to 02 July 2014 and the 30 day period is 03 June to 02 July 2014.
The maps are by the Climate Prediction Center, NOAA Center for Weather and Climate Prediction, USA.

This is simply not so. A normal monsoon is certainly not one that can statistically be called ‘normal’ on the basis of cumulative rainfall for a region – such as any one of our 36 meteorological sub-divisions – adding up to what is expected over four weeks after a few heavy showers in the last few days have helped tilt the reading from ‘below normal’ to ‘normal’. The three panels of maps alongside convincingly explain why.

Yet senior meteorological department officials, including those at the National Weather Forecasting Centre at the India Meteorological Department, issue statements such as “the monsoon has revived in many parts of central and north India”. This may be meant to assuage the concerns especially of farming and cultivating households, but in fact they only distract from the recognition a continuing climatological crisis urgently needs.

The evidence till now is extremely worrisome. June’s rainfall was 43% below average (a ‘national’ statistic that has no meaning in a district, but which helps in a small way to describe the degree of dryness) and this makes June 2014 the worst first month for recorded rainfall since 2009, a year in which the monsoon was the worst after the dreadful dry of 1972.

Especially given the growing evidence of the effects of climate change in India – from rising sea levels, to increasing meltwater from Himalayan glaciers causing torrents in hilly and mountainous districts, to rising mean temperatures in peninsular and north India – there is reason enough to set aside the usual measures such as the date of what is called ‘the onset of the rains over Kerala’ which is pegged to 01 June, and then a progress of the rain up the peninsula based on patterns of 40, 50 and more years ago. These time-tables no longer stand. [A full resolution set of the maps used here is available as a zip archive (2.68 MB).]

What continues to stand in the food staples calendar is the sowing that takes place in July and August but although there is more cooperation between the official earth sciences agencies and the Ministry of Agriculture, the central government has continues to link, in recent statements, the rising prices of food staples to the probability that these will continue should the monsoon be inadequate – which is what all the indicators are pointing to at this time.

This insistence is a contradiction, for a late and weak monsoon (or even an uneven and heavy monsoon that is statistically ‘normal’) will not help the usual sowing time-table and that is why agricultural contingency plans for every district are readied at the first indication of a wayward monsoon. The role of the central and state governments at times like these is not to blame poor rains for volatile and rising food prices but to help determine crop time-tables that match the circumstances.

By Rahul Goswami

Filed Under: Blogs, Monsoon 2014 Tagged With: 2014, agriculture, average, crop staple, drought, hydrology, IMD, India, inflation, monsoon, rainfall, water resources

New El Niño outlook

July 1, 2014 by Climate portal editor Leave a Comment

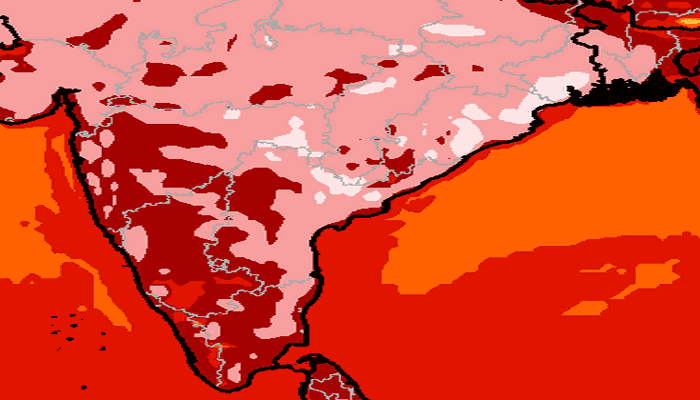
Sea surface temperature in the Indian Ocean. Image from the earth|nullschool real time visualisation of wind and ocean conditions

Sea surface temperature in the Indian Ocean. Image from the earth|nullschool real time visualisation of wind and ocean conditions

There is a 60% likelihood of an El Niño being fully established between June and August, increasing to 75-80% for the October to December period, according to an El Niño Update issued by the World Meteorological Organisation (WMO). Many countries have already started preparing for the arrival of El Niño, which is associated with regional-scale drought and flood situations in different parts of the world and has a warming influence on global average surface temperatures.

El Niño is characterised by unusually warm ocean surface temperatures in the central and eastern tropical Pacific, coupled with typical atmospheric circulation patterns. It is a natural phenomenon with a recurring interval of 2-7 years and has a major impact on the climate around the world. The last El Niño was in 2009-2010.

The latest WMO outlooks suggest that central tropical Pacific Ocean surface temperatures are likely to warm further into the third quarter of 2014, while the atmospheric patterns associated with El Niño are also expected to form and strengthen.

The WMO expects that El Niño will reach peak strength during the fourth quarter and endure into the first few months of 2015 before dissipating. The substantially above-average oceanic heat content beneath the sea surface of the central and eastern tropical Pacific Ocean, triggered by strong westerly wind events earlier this year, suggested an event of significant strength. However, the delayed atmospheric response, and a potential lack of subsequent westerly wind events in the coming months, may limit the peak strength of the El Niño, said the WMO.

Already, the second quarter of 2014 set new global atmospheric heat records. According to NASA, this May was the hottest in the global measure, meanwhile, the Japanese Meteorological Agency marked the March-April period as the hottest spring in all of the past 130 years (NASA showed the same period was second hottest). Rising Pacific Ocean surface temperatures by themselves were enough, when combined with raging human greenhouse gas heat forcing, to nudge atmospheric temperatures into a new record range. But the emergence of full-blown El Niño will likely push current record readings even higher.

Filed Under: Latest Tagged With: Climate Change, drought, El Nino, flood, WMO, World Meteorological Organisation

  • 1
  • 2
  • Next Page »

Indiaclimate twitter

Tweets by @Indiaclimate

Notable

Between contemplation and climate

Whether or not the USA, Europe, the Western world, the industrialised Eastern world (China, Japan, South Korea, Taiwan), adhere to or not their paltry promises about being more responsible concerning the factors that lead to climate change, is of very little concern to us. We have never set any store by international agreements on climate […]

The ‘Hindu’, ignorant about weather and climate, but runs down IMD

We find objectionable the report by ‘The Hindu’ daily newspaper accusing the India Meteorological Department of scientific shortcoming (‘IMD gets its August forecast wrong’, 1 September 2016). The report claims that the IMD in June 2016 had forecast that rains for August would be more than usual but that the recorded rain was less than […]

dialogue

  • Misreading monsoon | Resources Research on Misreading monsoon
  • Satish on A tribute to the weathermen of Bharat
  • Climate portal editor on A tribute to the weathermen of Bharat
  • Climate portal editor on A tribute to the weathermen of Bharat
  • Climate portal editor on A tribute to the weathermen of Bharat

Categories

Copyright © 2025 indiaclimateportal.org.