The India Climate Observatory

Commentary, action and research on climate and development in India

  • Home
  • About
  • Monsoon 2018
  • Current
  • Bulletin
  • Contact
  • Announcements

Seeing the local in six rain weeks

July 23, 2014 by Climate portal editor Leave a Comment

RG_ICP_20140723_picWe urge the Ministry of Earth Sciences, the India Meteorology Department and the Ministry of Information and Broadcasting to cease the use of a ‘national’ rainfall average to describe the progress of monsoon 2014. This is a measure that has no meaning for cultivators in any of our agro-ecological zones, and has no meaning for any individual taluka or tehsil in the 36 meteorological sub-divisions. What we need to see urgently adopted is a realistic overview that numerically and graphically explains the situation, at as granular a level as possible.

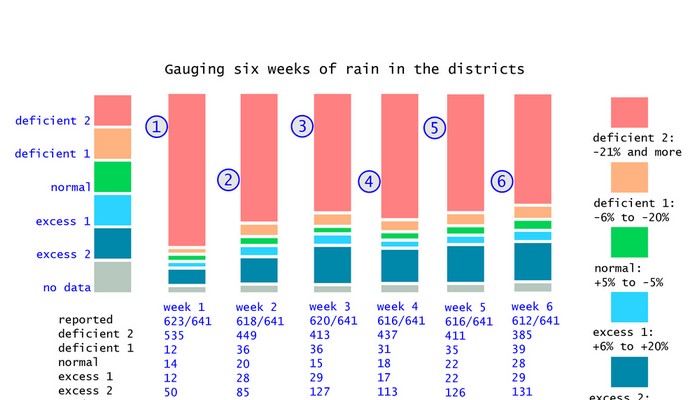
Using a revised categorisation of rainfall sufficiency levels (the method and the reasoning is available here) we find that for the fifth and sixth weeks of monsoon, there has been a small improvement which does not lower the high likelihood of drought conditions becoming prevalent in districts and scarcity of water for our settlements. The full-size chart is available here as an image, and explains in detail the rainfall that districts are reporting.

The fifth monsoon week is 03 to 09 July 2014 and the sixth monsoon week is 10 to 16 July 2014. There has been a small addition to the revised normal rainfall category (-5% to +5%), rising from 18 districts recording normal rainfall in the 4th week to 22 in the 5th and 28 in the 6th. There has also been an improvement in the number of districts recording deficit-2 levels of rainfall (-21% and more) with 437 in the 4th week, 411 in the 5th week and 385 in the 6th week. For the remainder of July the likelihood of more rainfall in the districts that have recorded normal or excess-1 (+6% to +20%) is small, according to the available forecasts, and this means that monsoon 2014 will begin August with far fewer districts registering normal rainfall than they should at this stage.

Filed Under: Current, Monsoon 2014 Tagged With: 2014, agriculture, crop, deficient, district, drought, monsoon, normal, rainfall, scanty, scarce, sowing, water

The new measure of monsoon

June 20, 2014 by Climate portal editor 1 Comment

The changes that we find in the patterns, trends, intensity and quantity of India’s monsoon now require an overhaul in the way we assess what is satisfactory or not for environmental and human needs.

By Rahul Goswami

India’s summer monsoon is already late, and where it is late but active it is weak. The indications from the central earth science agencies (including the India Meteorological Department), from the Indian Institute of Tropical Meteorology, from the National Centre for Medium Range Weather Forecasting are that it will be the end of June before the summer monsoon system settles over central India and the western Gangetic plains. Even so, it will be a relief from the searing temperatures but will not assure sowing conditions for farmers and cultivators, nor will it add to the stores of water in major and minor reservoirs.

Districts reporting monsoon data, over two weeks, colour-coded under a revised categorisation (explained in the text) for weekly rainfall. The left bar in each pair is the second week, the right bar is the first. Most districts are coloured light red, signifying rainfall much below the weekly normal. Peach is for the lesser deficient category. Green is normal. The two blue hues - lighter and darker - are for the two excess categories. It is immediately apparent that 485 out of 618 reporting districts (78%) have experienced less rainfall than they should have at this stage of the monsoon.

Districts reporting monsoon data, over two weeks, colour-coded under a revised categorisation (explained in the text) for weekly rainfall. The left bar in each pair is the second week, the right bar is the first. Most districts are coloured light red, signifying rainfall much below the weekly normal. Peach is for the lesser deficient category. Green is normal. The two blue hues – lighter and darker – are for the two excess categories. It is immediately apparent that 485 out of 618 reporting districts (78%) have experienced less rainfall than they should have at this stage of the monsoon.

The situation is very much more worrying than it is presented as by the agencies and departments of the new NDA government, and by industry – which complains about duties and tariffs but pays no collective attention to the daily situation that attends the south-west monsoon. The Ministry of Agriculture has busied itself, since early 2014 May, with mentioning the new high of agricultural exports, with the apparent success of a new SMS service to farmers, with releasing the advance estimates for agricultural and horticultural production, with a review of the implementation of crop insurance schemes and there is one, only one, advisory issued for horticulture crop cultivators concerning what they must do “under the rain deficit conditions”.

Some of the problem – that is, an absence of urgency as the last week of June approaches with little evidence of the customary rains being deposited, and apparently little preparation for a deficit in rains – may be attributable to the manner in which basic rainfall data is assessed and distributed to the public. This is done by the IMD – and more recently by a new private sector that is exploiting the yawning gaps in data presentation and the delivery of timely forecasts.

It is however the IMD, the Ministry of Earth Sciences and the Department of Science and Technology that works with state government agencies and departments in the areas of water resources, agriculture and drinking water supply. With the enormous size of the constituencies that are affected by dwindling water supplies and late sowing, there is a very strong case for revising the terms with which rainfall is measured and the frequency with which forecasts are distributed to districts and settlements.

It is absurd that the primary indicator during the designated ‘monsoon months’, according to the IMD, which are June to September, is a weekly table and weekly map of sub-divisional rainfall. Such an approach is not only out of date in the very hour it is issued – and distributed via the media – it is also grossly negligent of the commendable and ubiquitous advances made by public sector science and private ingenuity alike concerning the handling and treatment of climatic and weather-related data for India.

The typical IMD weekly rain map showing the colour codes and data for India's 36 meteorological subdivisions. This presentation urgently needs to be retired in favour of a more granular (district) map that is updated as soon as new data is received.

The typical IMD weekly rain map showing the colour codes and data for India’s 36 meteorological subdivisions. This presentation urgently needs to be retired in favour of a more granular (district) map that is updated as soon as new data is received.

A dense network of weather stations complemented by dedicated satellites provides continuous coverage of the sub-continent, the northern Asian land mass, the surrounding oceans southwards until beyond the Tropic of Capricorn. Methods to simply and accurately funnel this stream of real-time data and imagery are available, mostly at no cost, in order to aid local administrations, farmers and cultivators, and all citizens. It is this availability and relative simplicity of use (block-level weather forecasts for 72 hours are now available as local language apps on smartphones) that needs to be encouraged by the official agencies. More so in a year like 2014 with a late and weak monsoon and an El Nino threatening.

That is why IMD’s hoary top level categorisation of rainfall weekly quantities in the subdivisions must be replaced, both for what they describe and for how frequently they are described. These currently are: ‘normal’ in a subdivision is rainfall that is up to +19% above a given period’s average and down to -19% from that same average; likewise excess is +20% and more, deficient is -20% to -59% and scanty is -60% to -99%. The ‘normals’ are calculated based on the mean weekly rainfall for the period 1951-2000 with monitoring done in 641 districts distributed amongst the 36 meteorological subdivisions.

However, as all those who are engaged in studying and planning for the effects and impacts of climate change recognise, the changes observed on the ground over the last 15 years (rainfall, temperature, intensity of rain, duration of dry and wet spells) have made the term ‘normal’ difficult to use so that it continues to have meaning. Worse, a ‘normal’ with a wide range – over 28 percentage points from a given centre for a location – can lull local administrations particularly to misread the signs and ignore, on the basis of administrative expediency, the need to prepare for contingency.

By categorising rainfall ‘normals’ and departures from  ‘normal’ to become more administratively impelling – these proposed corrections also simplify the interpretations possible for rainfall above and below ‘normals’ – greater awareness and preparedness of administrations, key agencies and citizens to the deficiencies of monsoon can be fostered. For the district tables below therefore, I have re-cast the categories as follows (all based on the long-term average provided by IMD): Normal in a district is +5% to -5%; Deficient 1 is -6% to -20%; Deficient 2 is -21% and more; Excess 1 is +6% to +20%; Excess 2 is +21% and more.

Using these revised categories we see that for the second week (2014 June 12 to 18) of rainfall recorded in the districts (618 out of 641 reported) in 20 districts only was the rainfall ‘normal’ for that week. Under the existing IMD category of normal, this number is 81 – thus 61 district collectors will have been informed that in their district there is nothing to worry about, whereas the difference between a below normal reading of -5% and one of -15% can have a lasting impact particularly in rainfed districts where the social and institutional capacities to manage water and to plan credit needs for late sowing may be weak. In the same way, under the existing IMD categories, the difference between the conditions of two adjacent communities, one living in a district with a ‘deficient’ reading of -50% and the other in the neighbouring district (and in the same subdivision) with a ‘scanty’ reading of -70% is no more than technical, for the same degree of contingency planning will be required.

Whereas, for the same second rainfall week the IMD categories were ‘No Rain’ in 80 districts, ‘Scanty’ in 241 districts and ‘Deficient’ in 130 districts, under the proposed revision they will simply be ‘Deficient 2’ with 449 districts – thereby showing dramatically how widespread the conditions of the late and weak monsoon 2014 are – and ‘Deficient 1’ with 36 districts. State departments of agriculture, which have long worked on the frontlines of monsoon emergencies, whether drought or flood, have several generations of institutional experience to call upon in such circumstances. In most states, by 12 June alerts began to be issued to farmers and cultivators on measures to take if the monsoon is 15 days late, 30 days late and if signs of ‘terminal drought’ appear. Such preparedness must quickly extend to other areas – water resources, drinking water, food and civil supplies – for which a new meteorological literacy is urgently needed.

Filed Under: Monsoon 2014, Reports & Comment Tagged With: 2014, agriculture, climate, deficient, district, earth science, IMD, India, meteorology, monsoon, rainfed, satellite, scanty, weather station

Indiaclimate twitter

Tweets by @Indiaclimate

Notable

Between contemplation and climate

Whether or not the USA, Europe, the Western world, the industrialised Eastern world (China, Japan, South Korea, Taiwan), adhere to or not their paltry promises about being more responsible concerning the factors that lead to climate change, is of very little concern to us. We have never set any store by international agreements on climate […]

The ‘Hindu’, ignorant about weather and climate, but runs down IMD

We find objectionable the report by ‘The Hindu’ daily newspaper accusing the India Meteorological Department of scientific shortcoming (‘IMD gets its August forecast wrong’, 1 September 2016). The report claims that the IMD in June 2016 had forecast that rains for August would be more than usual but that the recorded rain was less than […]

dialogue

  • Misreading monsoon | Resources Research on Misreading monsoon
  • Satish on A tribute to the weathermen of Bharat
  • Climate portal editor on A tribute to the weathermen of Bharat
  • Climate portal editor on A tribute to the weathermen of Bharat
  • Climate portal editor on A tribute to the weathermen of Bharat

Categories

Copyright © 2025 indiaclimateportal.org.