The India Climate Observatory

Commentary, action and research on climate and development in India

  • Home
  • About
  • Monsoon 2018
  • Current
  • Bulletin
  • Contact
  • Announcements

A monsoon in more than two halves

August 4, 2015 by Climate portal editor Leave a Comment

ICP_imd_forecast_20150804

Less rain for the remaining two months of the typical monsoon season of four months, but an overall season average that remains as it was forecast in June. This is the confusing monsoon update issued by the Earth System Science Organization (ESSO), the Ministry of Earth Sciences (MoES) and the India Meteorological Department (IMD).

There are aspects of IMD’s treatment of the monsoon season that need correction in our view. One is the long range forecast and its updates. Specific to this update, we are at the halfway stage of what is typically considered the four month monsoon (this too needs revision, as April and May rains were not the usual ‘unseasonal’ passing showers). However, any downward revision of the rainfall average for August and September ought to be an overall downward revision of the season, particularly as June-July have seen very uneven rain.

Consider the highlights of the updated monsoon forecast:

* Quantitatively, the rainfall over the country as a whole during the second half of the season (August to September) is likely to be 84% of LPA with a model error of ±8%.
* The rainfall during August is likely to be 90 ± 9% of LPA as was forecasted in June.
* The season (June to September) rainfall over the country as a whole is likely to be 88% of LPA with a model error of ±4% as was forecasted in June.

ICP_imd_points_20150804We make our criticism constructively, for a significant amount of the material India Climate Portal puts out through our website and our twitter account is taken from the public products released by IMD, ISRO and the Ministry of Earth Sciences, and we fully appreciate the quality of work and commitment of these agencies.

The national mean rainfall (“country as a whole”, as the IMD forecasts call it) must be abandoned as it does not represent the meteorological diversity of a very large country. Each of the 36 met sub-divisions is affected in different ways by the El Nino Southern Oscillation, the Indian Ocean dipole, the Madden-Julian Oscillation and other hemispheric phenomena.

There is no need for this simplification, which in fact achieves the opposite of timely accuracy.
The media in particular (television and radio, print, online) look for an overall message and, without guidance from authorities, picks up ‘top line’ messages that are of little or no use at the district and taluka level, and also for towns and cities. The question for IMD is rather: how will variability in monsoon together with the strengthening El Nino affect local outlooks for August to October. That is why we advocate monthly outlooks for the 36 met sub-divisions, to begin in May and to run until October (that is, half the year and not a third of the year), primarily to prepare local administrations for all possible scenarios.

There is no reason why this cannot be the approach. The Ministry of Earth Sciences coordinates the observation network (satellites included, and our agencies ISRO and NRSC are heavily involved), the IMD uses these data together with a very extensive network of weather stations all over India. The output is excellent quality and in the public domain. Because the meteorological services in India have historically been designed to aid and guide agriculture and cultivation, the agri-met bulletins, alerts and products are copious. Hence IMD/MoES listens to the needs of the agricultural departments and, more recently, disaster management agencies. Unfortunately, the interface with public is still minimal, which this central government can also easily remedy.

Filed Under: Latest, Monsoon 2015 Tagged With: 2015, climate, earth sciences, El Nino, forecast, IMD, India, ISRO, monsoon

The state of the climate, scarier than ever before

July 20, 2015 by Climate portal editor Leave a Comment

ICP_NOAA_climate_report_201507

Most essential indicators of Earth’s changing climate continued to reflect trends of a warming planet, with several markers such as rising land and ocean temperature, sea levels and greenhouse gases setting new records.

The latest report which explains these indicators, compiled by the NOAA Center for Weather and Climate at the National Centers for Environmental Information is based on contributions from 413 scientists from 58 countries. It provides a detailed update on global climate indicators, notable weather events, and other data collected by environmental monitoring stations and instruments located on land, water, ice, and in space.

The report represents data from around the globe and gives us a picture of what happened in 2014. The variety of indicators shows us how our climate is changing, not just in temperature but from the depths of the oceans to the outer atmosphere. The report’s climate indicators show patterns, changes and trends of the global climate system. Examples of the indicators include various types of greenhouse gases; temperatures throughout the atmosphere, ocean, and land; cloud cover; sea level; ocean salinity; sea ice extent; and snow cover.

Key highlights from the report include (get the full report here, find a summary here):

* Greenhouse gases continued to climb: Major greenhouse gas concentrations, including carbon dioxide, methane and nitrous oxide, continued to rise during 2014, once again reaching historic high values. Atmospheric CO2 concentrations increased by 1.9 ppm in 2014, reaching a global average of 397.2 ppm for the year. This compares with a global average of 354.0 in 1990 when this report was first published just 25 years ago.

* Record temperatures observed near the Earth’s surface: Four independent global datasets showed that 2014 was the warmest year on record. The warmth was widespread across land areas. Europe experienced its warmest year on record, with more than 20 countries exceeding their previous records. Africa had above-average temperatures across most of the continent throughout 2014, Australia saw its third warmest year on record, Mexico had its warmest year on record, and Argentina and Uruguay each had their second warmest year on record. Eastern North America was the only major region to experience below-average annual temperatures.

Surface temperature anomalies in 2014. Image: NOAA Center for Weather and Climate

Surface temperature anomalies in 2014. Image: NOAA Center for Weather and Climate

* Tropical Pacific Ocean moves towards El Niño–Southern Oscillation conditions: The El Niño–Southern Oscillation was in a neutral state during 2014, although it was on the cool side of neutral at the beginning of the year and approached warm El Niño conditions by the end of the year. This pattern played a major role in several regional climate outcomes.

* Sea surface temperatures were record high: The globally averaged sea surface temperature was the highest on record. The warmth was particularly notable in the North Pacific Ocean, where temperatures are in part likely driven by a transition of the Pacific decadal oscillation – a recurring pattern of ocean-atmosphere climate variability centered in the region.

* Global upper ocean heat content was record high: Globally, upper ocean heat content reached a record high for the year, reflecting the continuing accumulation of thermal energy in the upper layer of the oceans. Oceans absorb over 90 percent of Earth’s excess heat from greenhouse gas forcing.

* Global sea level was record high: Global average sea level rose to a record high in 2014. This keeps pace with the 3.2 ± 0.4 mm per year trend in sea level growth observed over the past two decades.

* The Arctic continued to warm; sea ice extent remained low: The Arctic experienced its fourth warmest year since records began in the early 20th century. Arctic snow melt occurred 20–30 days earlier than the 1998–2010 average. On the North Slope of Alaska, record high temperatures at 20-meter depth were measured at four of five permafrost observatories. The Arctic minimum sea ice extent reached 1.94 million square miles on September 17, the sixth lowest since satellite observations began in 1979. The eight lowest minimum sea ice extents during this period have occurred in the last eight years.

* The Antarctic showed highly variable temperature patterns; sea ice extent reached record high: Temperature patterns across the Antarctic showed strong seasonal and regional patterns of warmer-than-normal and cooler-than-normal conditions, resulting in near-average conditions for the year for the continent as a whole. The Antarctic maximum sea ice extent reached a record high of 7.78 million square miles on September 20. This is 220,000 square miles more than the previous record of 7.56 million square miles that occurred in 2013. This was the third consecutive year of record maximum sea ice extent.

* Tropical cyclones above average overall: There were 91 tropical cyclones in 2014, well above the 1981–2010 average of 82 storms. The 22 named storms in the Eastern/Central Pacific were the most to occur in the basin since 1992. Similar to 2013, the North Atlantic season was quieter than most years of the last two decades with respect to the number of storms.

Filed Under: Current Tagged With: Arctic, climate, El Nino, ENSO, greenhouse gas, NOAA, sea ice, Southern Oscillation, thermal energy

Why climate action must beware the fakery of funds

July 4, 2015 by Climate portal editor Leave a Comment

Residents use a boat to cross flood waters in Kota Bahru on December 28, 2014. Photo: RT / AFP / Mohd Rasfan. Photo by AFP Photo / Mohd Rasfan

Residents use a boat to cross flood waters in Kota Bahru on December 28, 2014. Photo: RT / AFP / Mohd Rasfan. Photo by AFP Photo / Mohd Rasfan

We call upon the Ministry of Environment, Government of India, to stop pursuing the so-called Green Climate Fund as the means with which action to manage climate change can be financially supported. This so-called fund is in the end a means for the Western world – West Europe, Scandinavia, USA with Britain and Canada in tow, Australia and New Zealand, a feckless Japan and ditto South Korea – to maintain the empty but loud institutions they have set up by the dozens in the cause of climate change.

Inter Press Service has reported that the United Nations is seeking 100 billion US dollars per year by 2020 as part of a Green Climate Fund (GCF) “aimed at supporting developing countries strengthen their resilience and help adapt themselves to meet the foreboding challenges”. This is meretricious nonsense. Countries that the UN system, and the agencies of monetary ruin – World Bank, IMF, ADB and the like – call ‘developing’ do not need the prattling office-bearers of a crony international system to advise them. Countries of the South have plentiful intellectual, practical, financial and social resources to deal with climate change and the host of problems the Western countries have burdened our world with.

The Green Climate Fund, says the IPS report, may not be as realistic in its objectives as the Western-OECD alliance pretends but supporters of this Fund (naturally) are more concerned instead with how the target can be reached or neared: naturally because that is how they will derive a continuing relevance and legitimacy – both empty as far as we are concerned – which allows them to run expensive institutions and pay out immodest consultancies that serve only the Western-OECD alliance. Ignored by this glib army is the fact that, beginning from their own austerity-wracked countries, public finance for such profligacy is absent. Still they demand, like fahrenheit Shylocks, public finance for subsidies with which to “attract and leverage private investments”.

A host of ancillary agencies contributes to perpetuating this long-running fraud. Amongst the confused babble of Western-OECD support for the so-called Green Climate Fund can be found three common clauses: one, that developed nations should commit to increasing all public funding flows to 2020; two, that developed countries use new and innovative sources of finance toward the 2020 goal (such as redirected fossil fuel subsidies, carbon market revenues, financial transaction taxes, export credits); three, that all parties should clarify the definition of climate finance and development of methodologies so that accounting and reporting are improved.

These are nothing but cunning gambits advanced as justification for the continuing tenure of the Western-OECD climate-related institutions and their circles of charmed academic and finance cronies. First, developed countries have fallen short of basic overseas aid commitments for the last two generations, never mind climate finance. Under continuing austerity, it is foolish for the UN and its supporters on this subject to still preach in favour of a funding mechanism that rests on Western largesse.

Second, the ‘new and innovative’ has been experimented with for a decade with carbon exchanges and has made no impact (just as ‘deregulated’ energy markets, which are older, have not led to more sensible energy use by consumers or producers). But this is proposed in order to cement the positions of a new trading class, and its banking adjutants, in the area of climate finance. Third, the call for definitions and methodologies is part of the Western-led drive towards normative standards for the world, which will rely on its own Western bureaucracy to enforce the next mutation of trade sanctions on independent-minded countries and Southern country blocs – climate sanctions.

Our message to the profiteers of this true emerging market is: we can see through your ruse and know your game. Stop it now.

– Rahul Goswami

Filed Under: Reports & Comment Tagged With: Britain, carbon market, climate, climate finance, environment, fossil fuel, France, Germany, green climate fund, OECD, overseas aid, subsidies, USA

Being prudent about forecasts

June 3, 2015 by Climate portal editor Leave a Comment

ICP_pre-monsoon_seasons_2011-15_sm

The Earth System Science Organisation (ESSO), Ministry of Earth Sciences (MoES) and the India Meteorological Department (IMD) released their second long range forecast for monsoon 2015 on 2 June. The ‘headline’ message is that rainfall for the June to September monsoon season is very likely to be 88% of what is normal for the season.

The forecast has been seized upon by various quarters as having serious implications for the production of crop staples (and therefore for food security), for farmers’ livelihoods, for consumer prices and for the availability of water. These are all valid and important aspects that depend entirely or substantially upon the summer monsoon.

But, the IMD, the ESSO and the MoES do not make statements and forecasts on these aspects. They are concerned with what the climatological data and signs point to, and that is what they have told us. How the forecast relates to important aspects of food, farm incomes, water resources and food stocks relies on interpretations. Our advice – to the media, to government agencies and to the private sector – is to go slow on drawing conclusions and when conclusions are required, to make them incrementally.

The wettest pre-monsoon season (March to May) for five years.

The wettest pre-monsoon season (March to May) for five years.

Using the handy graphic here, (887KB) we also point out that the pre-monsoon season (March to May) for 2015 has been the wettest in five years. In several meteorological sub-divisions, excess rain has been recorded during this pre-monsoon season. In several districts, the annual rainfall total has already been reached, even before the typical monsoon season of June to September.

This ought to be warning enough to us to be sparing with deciding how forecasts will affect us. The ESSO, IMD and MoES have repeated, in their second long range forecast, that 2015 is an El Niño year which only means that as this sea temperature phenomenon waxes and wanes though the remainder of 2015, so too will the monsoon system react.

It is best to judge our Indian summer monsoon a week at a time, keeping in mind crop calendars and how much water our reservoirs hold. It is always prudent to take precautions such as rationing water (even when it is raining), especially in towns and cities. Likewise, district administrations will do well to assess their local supplies of food staples and match these figures with what food staples their districts are likely to produce during a monsoon whose reliability has now been written off.

The second long range forecast for monsoon 2015 is available here, and the Hindi text can be found here.

Filed Under: Monsoon 2015, Reports & Comment Tagged With: 2015, climate, consumer price, crop, El Nino, farm, food stock, forecast, IMD, India, meteorology, monsoon, sea surface temperature, water

Celsius surprises in 57 cities

May 21, 2015 by Climate portal editor Leave a Comment

ICP_57_cities_temp_top

The middle of February is when the chill begins to abate. The middle of May is when the monsoon is longed for. In our towns, district headquarters and cities, that climatic journey of 90 days is one of a steady rise in the reading of the temperature gauge, from the low 20s to the mid 30s.

This large panel of 90 days of daily average temperatures shows, in 57 ways, the effects of the rains that almost every district has experienced during the last two months. For each city, the curved line is the long period ‘normal’ for these 90 days, based on daily averages. Also for each city, the second line which swings above and below the ‘normal’ is the one that describes the changes in its daily average from February to May 2015.

[You can download (1.52MB) a full resolution image of the panel here.]

Where this second line crosses to rise above the normal, the intervening space is red, where it dips below is coloured blue. The patches of red or blue are what tell us about the effects of a lingering winter, or rains that have been called ‘unseasonal’ but which we think signal a shift in the monsoon patterns.

Amongst the readings there is to be found some general similarities and also some individual peculiarities. Overall, there are more blue patches than there are red ones, and that describes how most of the cities in this panel have escaped (till this point) the typical heat of April and May. The second noteworthy general finding is that these blue patches occur more frequently in the second half of the 90 days, and so are the result of the rainy spells experienced from March to early May.

Hisar (in Haryana) has remained under the normal temperature line for many more days than above or near it. So have Gorakhpur (Uttar Pradesh), Pendra (Chhattisgarh), Ranchi (Jharkhand), Nagpur (Maharashtra) and Jharsuguda (Odisha).

On the other hand in peninsular and south India, the below ‘normal’ daily average temperature readings are to be found in the latter half of the time period, coinciding with the frequent wet spells. This we can see in Kakinada, Kurnool and Anantapur (Andhra Pradesh), Bangalore, Gadag and Mangalore (Karnataka), Chennai, Cuddalore and Tiruchirapalli (Tamil Nadu) and Thiruvananthapuram (Kerala). [A zip file with the charts for all 57 cities is available here (1.2MB).]

What pattern will the next 30 days worth of temperature readings follow? In four weeks we will update this bird’s eye view of city temperatures, by which time monsoon 2015 should continue to give us more blues than reds. [Temperature time series plots are courtesy the NOAA Center for Weather and Climate Prediction.]

Filed Under: Current, Monsoon 2015, Reports & Comment Tagged With: Anantapur, Andhra Pradesh, Bangalore, Chennai, Chhattisgarh, city, climate, Cuddalore, Gadag, Gorakhpur, India, Jharkhand, Jharsuguda, Kakinada, Karnataka, Kerala, Kurnool, Maharashtra, Mangalore, monsoon, Nagpur, Odisha, Ranchi, Tamil Nadu, temperature, Thiruvananthapuram, Tiruchirapalli, town, urban, Uttar Pradesh

It’s to be a 93% monsoon says the IMD

April 22, 2015 by Climate portal editor 1 Comment

RG_ICP_IMD_forecast_20150422

The India Meteorological Department has just released it’s long-awaited forecast for the 2015 Indian monsoon. In terms of the quantity of rainfall over the duration of the monsoon season (June to September) the IMD has said it will be 93% of the ‘Long Period Average’. This average is based on the years 1951-2000.

What this means is the ‘national’ average rainfall over the monsoon season for India is considered to be 89 centimetres, or 890 millimetres. So, based on the conditions calculated till today, the ‘national’ average rainfall for the June to September monsoon season is likely to be 830 millimetres.

There are caveats and conditions. The first is that the 93% forecast is to be applied to the long period average for each of the 36 meteorological sub-divisions, and a ‘national average’ does not in fact have much meaning without considerable localisation. The second is that the forecasting methodology itself comes with a plus-minus caution. There is “a model error of ± 5%” is the IMD’s caution.

This first forecast and the model that the forecast percentage has emerged from are thanks to the efforts of the Earth System Science Organization (ESSO), under the Ministry of Earth Sciences (MoES), and the India Meteorological Department (IMD), which is the principal government agency in all matters relating to meteorology. This is what the IMD calls a first-stage forecast.

IMD_categories_201504As with all complex models, this one comes with several considerations. The ESSO, through the Indian Institute of Tropical Meteorology (IITM, which is in Pune), also runs what it calls an ‘Experimental Coupled Dynamical Model Forecasting System’. According to this, the monsoon rainfall during the 2015 monsoon season (June to September) averaged over India “is likely to be 91% ±5% of long period model average”. (The IMD forecast is available here, and in Hindi here.)

This is a lower figure than the 93% headline issued by the IMD. This too should be read with care as there are five “category probability forecasts” that are calculated – deficient, below normal, normal, above normal and excess. Each is accompanied by a forecast probability and a climatological probability (see the table). The maximum forecast probability of 35% is for a below normal monsoon, while the maximum climatological probability is for a normal monsoon.

As before, time will tell and the IMD will issue its second long range forecast in June 2015. Our advice to the Ministry of Earth Sciences and to the IMD is to issue its second long range forecast a month from now, in May, and also to confirm these forecasts two months hence in June, when monsoon 2015 will hopefully be active all over the peninsula.

Filed Under: Monsoon 2015, Reports & Comment Tagged With: 2015, climate, climatology, earth science, ESSO, forecast, IMD, India, meteorology, monsoon, weather

Follow the highs and lows of monsoon 2015

April 22, 2015 by Climate portal editor Leave a Comment

ICP_announce_20150422
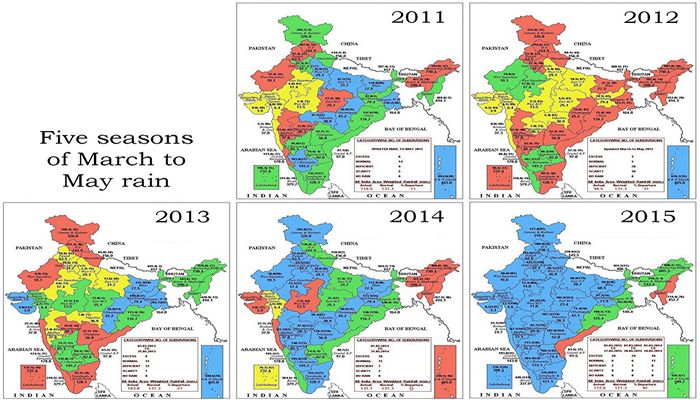
Our coverage of the ‘mausam’, the Indian summer monsoon of 2015, has begun. The unseasonal rains of March and April, which have proved so destructive to farmers, have shown why the conventional monsoon season must be widened. You will find all monsoon-related analysis, data and reports here.

We provide short, focused updates on weather trends. We strengthen the citizen’s understanding of the effects and impacts of climate change with relevant and jargon-free commentary.

We complement the Government of India’s excellent climate and weather monitoring services by advising what you can expect in your district or city, from unseasonal rains or the lack of it. Read our status reporting and analysis here on the India Climate Portal and follow our active twitter feed.

Filed Under: Announcements, Latest Tagged With: 2015, climate, data, forecast, India, monsoon, weather

Harpal Singh the climate hero

April 17, 2015 by Climate portal editor Leave a Comment

ICP_Harpal_Singh_Maruti_201504

One car for a household all the way from 1983 till today, and Harpal Singh says that’s the way it will be as long as he’s alive and can drive. This elderly New Delhi couple have shown two generations of Indians what responsible consumption is all about.

Harpal Singh and his wife Gulshanbeer Kaur are the owners of the first ever Maruti 800 car manufctured in 1983. The couple bought the car for Rs 47,500 and its ignition key was given to them by Indira Gandhi, who was prime minister at the time. As a generation that grew up in the 1980s knows, the Maruti 800 was a symbol of pride and progress for the country (Photo of the Maruti 800 and the Singhs is from the Hindustan Times).

“Harpal had sold his Fiat car when he bought the Maruti 800 and drove it for the rest of his life,” is significant paragraph in the news feature on the couple. “When the Maruti Zen was launched, the family advised him to upgrade to Zen but he was adamant that he would not leave this car till he is alive.” In a current automobile consumption culture – practiced by the majority of young professionals – which rewards what the marketers cunningly call ‘upgrading’, the common-sense and responsible view of the Singhs deserves to be emulated. It has after all stood them in good stead for 32 years!

A view of the myriad components that comprise a car. The manufacture of each of these, from sheet metal to a few grams of plastic, has en environmental and climate impact. Image courtesy: Volkswagen

A view of the myriad components that comprise a car. The manufacture of each of these, from sheet metal to a few grams of plastic, has en environmental and climate impact. Image courtesy: Volkswagen

Today’s car manufacturers, their financiers and the industry that supports personal mobility will talk about reduced emissions and fuel saving measures that every new model boasts, and they seek to justify frequent ‘upgrades’ with this argument. The truth, as the Singhs divined long ago, is quite different.

In today’s world sustainable mobility demands a much broader approach. Environmental impacts are not produced only while driving. Long before the vehicle ever travels its first kilometre, raw materials must first be extracted, and components must be manufactured – all these have impacts on climate change because they require energy to produce, energy to move, and energy to assemble.

In every phase of automobile manufacture (which we ought to be far more conscious of now than was the case in 1983) energy and resources are consumed and emissions are released into the atmosphere, the soil and water. The inspirational example of the Singhs has enabled us to look at the complete story when assessing a the environmental impact of a personal vehicle. This is important because today’s throw-away-or-upgrade consumer culture (which extends from mobile phones to cars and much else besides) doesn’t reflect about the emissions that are produced at every stage, be it manufacturing, the service life or recycling. The true green economy, as the Singhs will be able to explain, is about living within one’s means and using less.

Filed Under: Blogs Tagged With: automobile, climate, consumption, emissions, energy, fuel, green economy, Maruti, product life cycle

Mr Javadekar, our country does not gamble with carbon

April 3, 2015 by Climate portal editor Leave a Comment

RG_ICP_20150403

There is a message New Delhi’s top bureaucrats must listen to and understand, for it is they who advise the ministers. The message has to do with climate change and India’s responsibilities, within our country and outside it. This is the substance of the message:

1. The Bharatiya Janata Party-led National Democratic Alliance government must stop treating the factors that contribute to climate change as commodities that can be bartered or traded. This has been the attitude of this government since it was formed in May 2014 – an attitude that says, in sum, ‘we will pursue whatever GDP goals we like and never mind the climate cost’, and that if such a pursuit is not to the liking of the Western industrialised world, India must be compensated.

2. Rising GDP is not the measure of a country and it is not the measure of India and Bharat. The consequences of pursuing rising GDP (which does not mean better overall incomes or better standards of living) have been plain to see for the better part of 25 years since the process of liberalisation began. Some of these consequences are visible in the form of a degraded natural environment, cities choked in pollution, the rapid rise of non-communicable diseases, the economic displacement of large rural populations. All these consequences have dimensions that deepen the impacts of climate change within our country.

3. There are no ‘terms of trade’ concerning climate change and its factors. There is no deal to jockey for in climate negotiations between a narrow and outdated idea of GDP-centred ‘development’ and monetary compensation. The government of India is not a broking agency to bet a carbon-intensive future for India against the willingness of Western countries to pay in order to halt such a future. This is not a carbon casino and the NDA-BJP government must immediately stop behaving as if it is.

The environment minister, Prakash Javadekar, has twice in March 2015 said exactly this: we will go ahead and pollute all we like in the pursuit of our GDP dream – but if you (world) prefer us not to, give us lots of money as compensation. We condemn such an attitude and we condemn such a statement. Javadekar has made such a statement, but we find it deeply worrying that a statement like this may reflect a view within the NDA-BJP government that all levers of governance are in fact monetary ones that can be bet, like commodities can, against political positions at home and abroad. If so, this is a very serious error being made by the central government and its advisers.

Javadekar has most recently made this stand clear in an interview with a foreign news agency. In this interview (which was published on 26 March 2015), Javadekar is reported to have said: “The world has to decide what they want. Every climate action has a cost.” Worse still, Javadekar said India’s government is considering the presentation of a deal – one set of commitments based on internal funding to control emissions, and a second set, with deeper emissions cuts, funded by foreign money.

Earlier in March, during the Fifteenth Session of the African Ministerial Conference on Environment (in Cairo, Egypt), Javadekar had said: “There has to be equitable sharing of the carbon space. The developed world which has occupied large carbon space today must vacate the space to accommodate developing and emerging economies.” He also said: “The right to development has to be respected while collectively moving towards greener growth trajectory.”

Such statements are by themselves alarming. If they also represent a more widespread view within the Indian government that the consequences of the country following a ‘development’ path can be parleyed into large sums of money, then it indicates a much more serious problem. The UNFCCC-led climate change negotiations are infirm, riddled with contradictions, a hotbed of international politics and are manipulated by finance and technology lobbies. It remains on paper an inter-governmental arrangement and it is one that India is a part of and party to. Under such circumstances, our country must do all it can to uphold moral action and thinking that is grounded in social and environmental justice. The so-called Annex 1 countries have all failed to do so, and instead have used the UNFCCC and all its associated mechanisms as tools to further industry and foreign policy interests.

It is not in India’s nature and it is not in India’s character to to the same, but Javadekar’s statement and the government of India’s approach – now made visible by this statement – threatens to place it in the same group of countries. We protest such a misrepresentation of India. According to the available data, India in 2013 emitted 2,407 million tons of CO2 (the third largest emitter behind the USA and China). In our South Asian region, this is 8.9 times the combined emissions of our eight neighbours (Pakistan, 165; Bangladesh, 65; Sri Lanka, 15; Myanmar, 10; Afghanistan, 9.4; Nepal, 4.3; Maldives, 1.3; Bhutan, 0.7). When we speak internationally of being responsible we must first be responsible at home and to our neighbours. Javadekar’s is an irresponsible statement, and is grossly so. Future emissions are not and must never be treated as or suggested as being a futures commodity that can attract a money premium. Nor is it a bargaining chip in a carbon casino world. The government of India must clearly and plainly retract these statements immediately.

Note – according to the UNFCCC documentation, “India communicated that it will endeavour to reduce the emissions intensity of its GDP by 20-25 per cent by 2020 compared with the 2005 level. It added that emissions from the agriculture sector would not form part of the assessment of its emissions intensity.”

“India stated that the proposed domestic actions are voluntary in nature and will not have a legally binding character. It added that these actions will be implemented in accordance with the provisions of relevant national legislation and policies, as well as the principles and provisions of the Convention.”

Filed Under: Reports & Comment Tagged With: Bharat, BJP, carbon, climate, Climate Change, climate funds, economy, emissions, GDP, INDC, India, intensity, NDA, pollute, technology, UNFCCC

Chop suey climate calculations

November 14, 2014 by Climate portal editor Leave a Comment

The China-USA ‘deal’ has shockingly ignored the central message of the IPCC Fifth Assessment Report, whose final synthesis has just been released. The evaluation made in this fifth report is not fundamentally different from the fourth (in 2007) but the confidence levels of the warnings issued is greater. Areas of uncertainty are becoming clearer and the concern of the contributing scientists is more obvious than ever before. They have used the phrase “virtually certain” (more than 99% probability) frighteningly often to describe likelihood of phenomena which affect our ecology and our habitats.

Special bulletin of the India Climate Watch on the China-USA climate 'deal'. [pdf, 91kb]

Special bulletin of the India Climate Watch on the China-USA climate ‘deal’. [pdf, 91kb]

The staged euphoria over this ‘deal’ does not obscure its non-binding nature. According to commentary from the People’s Republic, 2030 would be set as the peak year for its soaring greenhouse gas emissions, while the USA said it would cut emissions by more than a quarter from 2005 levels by 2025.

Data from the International Energy Agency show that for the USA, total final oil products consumption in 2012 was 717 million tons of oil equivalent (mtoe; in 2007 the quantity was 829 mtoe) while the totals for all energy sources were 1,432 mtoe in 2012 which was a reduction from 1,572 mtoe in 2007).

In China, total final oil products consumption in 2012 was 421 mtoe (in 2007 it was 308 mtoe) while the use of coal continued to rise – 558 mtoe in 2012 whereas it was 480 mtoe in 2007. In China the totals for all energy sources was 1,703 mtoe in 2012 which is 28% above what it was (1,326 mtoe) five years earlier.

This special bulletin of the India Climate Watch explains the trade and manufacturing, geo-strategic ambitions and power jockeying, these are the objectives behind the so-called ‘deal’ between China and USA on ‘cutting’ carbon emissions and pollution. This special bulletin urges the government of India to take moral leadership of the inter-governmental process towards lower emissions and the phasing out of fossil fuels.

Filed Under: India Climate Watch Tagged With: bulletin, China, climate, economy, emissions, India, IPCC, trade, USA

  • « Previous Page
  • 1
  • 2
  • 3
  • Next Page »

Indiaclimate twitter

Tweets by @Indiaclimate

Notable

Between contemplation and climate

Whether or not the USA, Europe, the Western world, the industrialised Eastern world (China, Japan, South Korea, Taiwan), adhere to or not their paltry promises about being more responsible concerning the factors that lead to climate change, is of very little concern to us. We have never set any store by international agreements on climate […]

The ‘Hindu’, ignorant about weather and climate, but runs down IMD

We find objectionable the report by ‘The Hindu’ daily newspaper accusing the India Meteorological Department of scientific shortcoming (‘IMD gets its August forecast wrong’, 1 September 2016). The report claims that the IMD in June 2016 had forecast that rains for August would be more than usual but that the recorded rain was less than […]

dialogue

  • Misreading monsoon | Resources Research on Misreading monsoon
  • Satish on A tribute to the weathermen of Bharat
  • Climate portal editor on A tribute to the weathermen of Bharat
  • Climate portal editor on A tribute to the weathermen of Bharat
  • Climate portal editor on A tribute to the weathermen of Bharat

Categories

Copyright © 2025 indiaclimateportal.org.