The India Climate Observatory

Commentary, action and research on climate and development in India

  • Home
  • About
  • Monsoon 2018
  • Current
  • Bulletin
  • Contact
  • Announcements

From space, a district and its water

October 9, 2015 by Climate portal editor 3 Comments

RG_ICP_water_district_map_201510

In this panel of maps the relationship between the district of Parbhani (in the Marathwada region of Maharashtra) and water is graphically depicted over time. The blue squares are water bodies, as seen by a satellite equipped to do so. The intensity of the blue colour denotes how much water is standing in that coloured square by volume – the deeper the blue, the more the water.

Water bodies consist of all surface water bodies and these are: reservoirs, irrigation tanks, lakes, ponds, and rivers or streams. There will be variation in the spatial dimensions of these water bodies depending on how much rainfall the district has recorded, and how the collected water has been used during the season and year. In addition to these surface water bodies, there are other areas representing water surface that may appear, such as due to flood inundations, depressions in flood plains, standing water in rice crop areas during transplantation stages. Other than medium and large reservoirs, these water features are treated as seasonal and some may exist for only a few weeks.

RG_ICP_water_district_map_201510_section

Click for a section of the full size image. The detail can be mapped to panchayat level.

The importance of monitoring water collection and use at this scale can be illustrated through a very brief outline of Parbhani. The district has 830 inhabited villages distributed through nine tehsils that together occupy 6,214 square kilometres, eight towns, 359,784 households in which a population of 1.83 million live (1.26 rural and 0.56 million urban). This population includes 317,000 agricultural labourers and 295,000 cultivators – thus water use and rainfall is of very great importance for this district, and indeed for the many like it all over India.

This water bodies map for Parbhani district is composed of 18 panels that are identical spatially – that is, centred on the district – and display the chronological progression of water accumulation or withdrawal. Each panel is a 15-day period, and the series of mapped fortnights begins on 1 January 2015.

The panels tell us that there are periods before the typical monsoon season (1 June to 30 September) when the accumulation of water in surface water bodies has been more than those 15-day periods found during the monsoon season. See in particular the first and second fortnights of March, and the first fortnight of April.

During the monsoon months, it is only the two fortnights of June in which the accumulation of water in the surface water bodies of Parbhani district can be seen. The first half of July and the second half of August in particular have been recorded as relatively dry.

This small demonstration of the value of such information, provided at no cost and placed in the public domain, is based on the programme ‘Satellite derived Information on Water Bodies Area (WBA) and Water Bodies Fraction (WBF)’ which is provided by the National Remote Sensing Centre (NRSC), Indian Space Research Organisation (ISRO), Department of Space, Government of India.

For any of our districts, such continuous monitoring is an invaluable aid to: facilitate the study of water surface dynamics in river basins and watersheds; analyse the relationships between regional rainfall scenarios and the collection and utilisation of water in major, medium reservoirs and irrigation tanks and ponds; inventory, map and administer the use of surface water area at frequent intervals, especially during the crop calendar applicable to district and agro-ecological zones.

Filed Under: Blogs, Monsoon 2015 Tagged With: agriculture, district, ISRO, Maharashtra, monsoon, NRSC, rain, remote sensing, reservoir, river, rural, space, town, urban, village, water

Where they waited for rain in 2015

September 18, 2015 by Climate portal editor 1 Comment

RG_ICP_20150918

With two weeks of the June to September monsoon remaining in 2015, one of the end-of-season conclusions that the India Meteorological Department (IMD) has spoken of is that four out of ten districts in the country has had less rainfall than normal.

This overview is by itself alarming, but does not aid state governments and especially line ministries plan for coming months, particularly for agriculture and cultivation needs, water use, the mobilisation of resources for contingency measures, and to review the short- and medium-term objectives of development programmes.

RG_ICP_100districts_table_20150918The detailed tabulation provided here is meant to provide guidance of where this may be done immediately – in the next two to four weeks – and how this can be done in future.

The table lists 100 districts each of which have readings 15 weeks of rainfall variation – the numbers are not rainfall in millimetres (mm) but the variation in per cent from the long-term normal for that district for that week. The colour codes for each district’s week cell are the same as those used for the new 11-grade rainfall categorisation.

The districts are chosen on the basis of the size of their rural populations (calculated for 2015). Thus Purba Champaran in Bihar, Bhiwani in Haryana, Rewa in Madhya Pradesh and Viluppuram in Tamil Nadu are the districts in those states with the largest rural populations.

In this way, the effect of rainfall variability, from Week 1 (which ended on 3 June) to Week 15 (which ended on 9 September), in the districts with the largest rural populations can be analysed. Because a large rural population is also a large agricultural population, the overall seasonal impact on that district’s agricultural output can also be inferred.

The distribution of the districts is: six from Uttar Pradesh; five each from Andhra Pradesh, Bihar, Chhattisgarh, Gujarat, Haryana, Jharkhand, Karnataka, Maharashtra, Madhya Pradesh, Odisha, Punjab, Rajasthan, Tamil Nadu and West Bengal; four each from Assam, Jammu and Kashmir, and Kerala; three from Uttarakhand; two from Himachal Pradesh; one each from Arunachal Pradesh, Manipur, Meghalaya, Mizoram, Nagaland, Sikkim and Tripura.

Using the new 11-grade rainfall categorisation, a normal rainweek is one in which the rainfall is between +10% more and -10% less for that week. The overview for this group of 100 districts, only 11 have had five or more normal weeks of rain out of 15 weeks. In alarming contrast, there are 77 districts which have had three or fewer normal weeks of rain – that is, more than three-fourths of these most populous districts. Half the number (51 districts) have had two, one or no normal weeks of rain. And 22 of these districts have had only one or no normal weeks of rain.

From this group of 100 most populous (rural population) districts Gorakhpur in Uttar Pradesh and Nagaon in Assam have had the most deficit rainweeks, tallying 13, out of the 15 tabulated so far. There are ten districts which have had 12 deficit rainweeks out of 15 and they are (in decreasing order of rural population): Muzaffarpur (Bihar), Pune and Jalgaon (Maharashtra), Surguja (Chhattisgarh), Panch Mahals and Vadodara (Gujarat), Firozpur (Punjab), Thiruvananthapuram (Kerala), Hoshiarpur (Punjab) and Mewat (Haryana).

– Rahul Goswami

Filed Under: Monsoon 2015, Reports & Comment Tagged With: agriculture, district, IMD, India, monsoon, population, rain, rural, urban, water

Lessons of monsoon 2015 for district India

September 16, 2015 by Climate portal editor 2 Comments

ICP_rainweek_commentary_20150916

By our conventional method of reckoning the adequacy of the 2015 monsoon, this is a year that is amongst the most deficient in rain over a period of 20 years. The monsoon season began late, compared with its usual onset, and apart from a few sustained heavy spells in a few locations, has been less than adequate and also less than normal in every one of our 36 meteorological sub-divisions.

When after eight weeks of the conventional monsoon season it became evident that a combination of factors was causing weak and erratic rainfall, that is when the central and state governments needed to place on alert the regions that were already facing rainfall deficits. At this point, when we have the evidence provided by data for 15 weeks of the monsoon season (until 9 September), every week from early August onwards that passed without such a declaration is a week of preparation and coping lost.

In this commentary, I have described the advantages of using a new methodology that grades rainfall adequacy at the level of the district, to a degree that is very much finer than the five categories of the India Meteorological Department (IMD), which are: normal, excess, deficient, scanty and no rain. The outputs from this methodology (illustrated and described here) are designed to: (1) alert national food and agriculture administrators to impending food insecurity conditions; (2) alert national water resources administrators to impending water scarcities; (3) alert line departments of state ministries and district collectorates to the build up of climatological distress at the district level so that contingency measures can be taken.

RG_2015_rainweek_graphic3Over the conventional season (1 June to 30 September) the inadequacy of rainfall in 2015 is revealed at a glance by the weekly rain report. It makes for a very alarming picture and shows that state administrations and especially district authorities should, by the sixth week which ended on 8 July, have made arrangements to prepare for below-normal rains. In the weekly rain report, each vertical bar corresponds to a week of districts categorised into eleven grades. This provides a weekly national barometer of the number of districts that are in the lower and upper (severely below and above normal rainfall) categories during a given week.

Such a weekly rainfall adequacy report is able to quickly put a stop to the recent tendency of administrations, the media and all those who must manage natural resources (particularly our farmers), to think in terms of an overall seasonal ‘deficit’ or an overall seasonal ‘surplus’. This ‘seasonal’ view must be abandoned because demands for water are not cumulative – they are made several times a day, and become more or less intense according to a cropping calendar, which in turn is influenced by the characteristics of a river basin and of a corresponding agro-ecological zone, and the rural and urban populations in a district.

The difference between the IMD five-grade assessment and the eleven-grade categorisation of rainfall becomes immediately apparent when a comparison is made for any given week. The data source is the same – the weekly tabulation compiled by the IMD’s Hydromet Division (which from this monsoon season provides the data sheets and detailed maps on its ‘customised rainfall information system’, or CRIS, website).

RG_ICP_grade_systems_comparedWeek 11 of the monsoon season, which is the week until 12 August, provides such an example. Under the five-grade IMD scale, there were 114 districts with normal rain (from -19% to +19%). Under the 11-grade new categorisation, the middle grade is -10% to +10%, and included 66 districts. Under the five-grade IMD scale districts with below normal rainfall fall under deficient (-20% to -59%) or under scanty (-60% to -99%) and for this week the number of districts respectively were 155 and 223. Under the 11-grade new categorisation, there are four grades for below-normal rainfall that is -20%.

Thus while the ‘deficient’ grade includes 155 districts, under the 11-grade system there are 150 districts distributed between two grades – 84 and 66, but we see that a larger number of districts fall in the more severe of the two grades. The signal to be derived from this, at the state and districts administration level, is that if a district remains for two to three weeks at a grade, then contingency measures must be reviewed, readied or rolled out. This is a decision that becomes considerably easier with the 11-grade system when compared with the existing five-grade system.

In the same way, the week by week tabulation of districts under the 11-grade system reveals trends and patterns that are not visible under the existing IMD five-grade assessment. The table shows the distribution of districts by grade across weeks. In each week, the two grades that account for the largest number of districts are highlighted red. We see that for the the first five rain weeks – week ending 3 June to week ending 1 July – the +81% and above grade was one of the top two populated grades. This occurred once more for Week 7, ending 15 July. For the next eight rain weeks – ending 22 July to ending 9 September – the top two populated grades have been in the rainfall grades of -41% to -60%, -61% to -80% and -81% and less. At the country level, this starkly underlines the seriousness of the rainfall deficit.

RG_ICP_weekly_tableThe uses to which we have put available climatic observations no longer suit an India which is learning to identify the impacts of climate change. Until 2002, the monsoon season was June to September, there was an assessment in May of how well (or not) the monsoon could turn out.

The India Meteorology Department has added computational and analytical resources furiously over the last decade. The new research and observational depth is complemented by the efforts of a Ministry of Earth Sciences which has channelled the copious output from our weather satellites, under the Indian Space Research Organisation (ISRO), and which is interpreted by the National Remote Sensing Centre (NRSC), to serve meteorological needs.

The IMD, with 559 surface observatories, 100 Insat satellite-based data collection platforms, an ‘integrated agro-advisory service of India’ which has provided district-level forecasts since 2008, a High Performance Computing System commissioned in 2010 (whose servers run at Pune, Kolkata, Chennai, Mumbai, Guwahati, Nagpur, Ahmedabad, Bengaluru, Chandigarh, Bhubaneswar, Hyderabad and New Delhi) intelligently consumes an astonishing amount of numerical data every hour.

Over the last four years, more climate and weather ‘products’ (as the IMD system calls them) based on this data and their interpretations have been released via the internet into the public domain. These are reliable, timely (some observation series have even three-hour intervals), and valuable for citizen and administrator alike.

Even so, the IMD’s framing of how its most popular measures are categorised is no longer capable of describing what rain – or the absence of rain – affects our districts. These popular measures are distributed every day, weekly and monthly in the form of ‘departures from normal’ tables, charts and maps. The rain adequacy categories are meant to guide alerts and advisories.

These number four: ‘normal’ is rainfall up to +19% above a given period’s average and also down to -19% from that same average, ‘excess’ is +20% rain and more, ‘deficient’ is -20% to -59%, ‘scanty’ is -60% to -99%, and ‘no rain’ is -100%. These categories can mislead more than they inform, for the difference between an excess of +21% and an excess of +41% can be the difference between water enough to puddle rice fields and a river breaking its banks to ruin those fields.

In today’s concerns that have to do with the impacts of climate change, with the increasing variability of the monsoon season, and especially with the production of food crops, the IMD’s stock measurement ‘product’ is no longer viable. It ought to have been replaced at least a decade ago, for the IMD’s Hydromet Division maintains weekly data by meteorological sub-division and by district. This series of running records compares any given monsoon week’s rainfall, in a district, with the long period average (a 50-year period). Such fineness of detail must be matched by a measuring range-finder with appropriate  interpretive indicators. That is why the ‘no rain’, ‘scanty’, ‘deficient’, ‘normal’ or ‘excess’ group of legacy measures must now be replaced. In its place an indicator of eleven grades translates the trends, patterns and messages in IMD’s district-level rainfall data into meaningful and actionable signals.

– Rahul Goswami

Notes

The new 11-grade indicator for assessing weekly rainfall departures in districts uses the same data IMD releases into the public domain, but provides dramatically more useful guidance. This yields the detailed reading required to alert state administrations to drought, drought-like and potential flood conditions. The modified methodology adapts the UN Food and Agriculture Organisation’s ‘Global Information and Early Warning System’ employment of 11 grades.

The weekly tallies of rainfall distribution for meteorological sub-divisions and for states are no longer able to signal administrative action and must be replaced with district-scale and (by 2016 monsoon) urban-scale assessments. The ability of the new 11-grade methodology to provide early warnings of climatic trauma in districts is now clear, and state administrations can respond to growing climatological distress in a targeted manner. Districts and blocks need to be supplied rainfall trends – and not only distribution data – that help farmers and administrators alike better plan for rainfall variability.

Filed Under: Current, Monsoon 2015 Tagged With: 2015, agriculture, district, India, monsoon, rain, water

A monsoon in more than two halves

August 4, 2015 by Climate portal editor Leave a Comment

ICP_imd_forecast_20150804

Less rain for the remaining two months of the typical monsoon season of four months, but an overall season average that remains as it was forecast in June. This is the confusing monsoon update issued by the Earth System Science Organization (ESSO), the Ministry of Earth Sciences (MoES) and the India Meteorological Department (IMD).

There are aspects of IMD’s treatment of the monsoon season that need correction in our view. One is the long range forecast and its updates. Specific to this update, we are at the halfway stage of what is typically considered the four month monsoon (this too needs revision, as April and May rains were not the usual ‘unseasonal’ passing showers). However, any downward revision of the rainfall average for August and September ought to be an overall downward revision of the season, particularly as June-July have seen very uneven rain.

Consider the highlights of the updated monsoon forecast:

* Quantitatively, the rainfall over the country as a whole during the second half of the season (August to September) is likely to be 84% of LPA with a model error of ±8%.
* The rainfall during August is likely to be 90 ± 9% of LPA as was forecasted in June.
* The season (June to September) rainfall over the country as a whole is likely to be 88% of LPA with a model error of ±4% as was forecasted in June.

ICP_imd_points_20150804We make our criticism constructively, for a significant amount of the material India Climate Portal puts out through our website and our twitter account is taken from the public products released by IMD, ISRO and the Ministry of Earth Sciences, and we fully appreciate the quality of work and commitment of these agencies.

The national mean rainfall (“country as a whole”, as the IMD forecasts call it) must be abandoned as it does not represent the meteorological diversity of a very large country. Each of the 36 met sub-divisions is affected in different ways by the El Nino Southern Oscillation, the Indian Ocean dipole, the Madden-Julian Oscillation and other hemispheric phenomena.

There is no need for this simplification, which in fact achieves the opposite of timely accuracy.
The media in particular (television and radio, print, online) look for an overall message and, without guidance from authorities, picks up ‘top line’ messages that are of little or no use at the district and taluka level, and also for towns and cities. The question for IMD is rather: how will variability in monsoon together with the strengthening El Nino affect local outlooks for August to October. That is why we advocate monthly outlooks for the 36 met sub-divisions, to begin in May and to run until October (that is, half the year and not a third of the year), primarily to prepare local administrations for all possible scenarios.

There is no reason why this cannot be the approach. The Ministry of Earth Sciences coordinates the observation network (satellites included, and our agencies ISRO and NRSC are heavily involved), the IMD uses these data together with a very extensive network of weather stations all over India. The output is excellent quality and in the public domain. Because the meteorological services in India have historically been designed to aid and guide agriculture and cultivation, the agri-met bulletins, alerts and products are copious. Hence IMD/MoES listens to the needs of the agricultural departments and, more recently, disaster management agencies. Unfortunately, the interface with public is still minimal, which this central government can also easily remedy.

Filed Under: Latest, Monsoon 2015 Tagged With: 2015, climate, earth sciences, El Nino, forecast, IMD, India, ISRO, monsoon

Earth, sea, sky, El Niño

June 17, 2015 by Climate portal editor Leave a Comment

ICP_20150617_sm

Eight-and-a-half degrees north of the equator is where the peninsula of India meets the ocean. Our country stretches across 29 degrees of latitude but it is in the vast watery realm south of Kanyakumari that the Indian summer monsoon is brewed, slowly and inevitably. Over twice as many lines of latitude stretches the Indian Ocean, its equatorial belt and then its southern reaches, which continue into the deep and icy girdles of water around Antarctica.

From this vast aqueous quarter-planet the vapours are gathered, and these swirls of airborne water then look for the winds to transport them, first towards the mid-southern latitudes (Madagascar lies astride these, but they are are still a full ten degrees south of the lower coasts of Java) and then in the equatorial trough that spins like a motor. From here these enormous masses of water – half again the size of India at times – are hurled as if in slow motion towards our western coast.

And so to gauge imperfectly whether the wind lords of the farther Indian Ocean have decided to be kind to us we rely nowadays on our eyes in the sky, our weather satellites. What they tell us now is coded in electronic chirps made intelligible by the meteorologists and climatologists of the Indian Meteorological Department, the Ministry of Earth Sciences, the Indian Institute of Tropical Meteorology and the National Centre for Medium Range Weather Forecasting.

Our Indian summer monsoon is amongst the most complex of the planet’s earth-sea-sky interactions. We are told by the scientists, when they disengage from their equations, that the land retains a shorter climate ‘memory’ than the ocean. We are introduced to meridonal termperature gradients and seasonal migration of the inter-tropical convergence zone.

There is an abundance of exotic nomenclature: the Mascarene High, the orographic influence of the East African Highlands, the momentum of the Somali Jet, the ventilation effect of poleward precipitation. And then there is the hot star of the equatorial deeps, El Niño himself, whose domain is the central Pacific and who, when he awakes, demands that the equatorial Indian Ocean obey. He has awoken this year, but the ocean named after us is as unruly as ever.

When will El Niño’s whip really crack? The best models of the climate scientists cannot truly tell us. They and their teraflop calculating machines can only posit what is measured, and what remains unmeasured is still far greater. What we do however know about El Niño is that he does tend to suppress the monsoon. But this year’s El Niño may not resemble one of an earlier year, for where El Niño arises and rules is as important as when. Where the ocean surface warms up (several thousand kilometres parallel to the equator, several hundred kilometres wide) unusually strong rising air flows result.

When these flows descend (as they eventually must) they are generally dry and stable, and so the opposite of conditions needed for or monsoon rains. If they descend far away from India (as happened in 1997-98 when they dropped back into the eastern Pacific) our ocean will deliver and our monsoon will roll in. If they descend in the middle of the Pacific (which happened in 2002) our monsoon will resent the interference and hide. But El Niño is awake and pacing the Pacific. We must hope he does not look too far westwards. (RG)

Filed Under: Blogs, Monsoon 2015 Tagged With: Climate Change, earth science, El Nino, ENSO, India, Indian Ocean, monsoon, planet

North-East India reels under rain

June 10, 2015 by Climate portal editor Leave a Comment

A village threatened by rising floodwaters in Arunachal Pradesh. Image: Arunachal Times

A village threatened by rising floodwaters in Arunachal Pradesh. Image: Arunachal Times

Torrential rain in north-east India has caused rivers to swell with water, several above their danger marks, and has isolated entire districts. Reports from Arunachal Pradesh, Assam and Meghalaya – states that have experienced heavy to very heavy rain over the last four days – indicate a situation for the region that is approaching an emergency.

#monsoon2015 Next 6 days' rain for NE India. Red hues are 50-90 mm/day. Intensity lessens from 15th #Assam #Arunachal pic.twitter.com/YWEJ2BQCFD

— Indiaclimate (@Indiaclimate) June 10, 2015

A father carries his child to school in waterlogged Anil Nagar, Guwahati. Image: PTI/Express

A father carries his child to school in waterlogged Anil Nagar, Guwahati. Image: PTI/Express

The Indian Express has reported that thousands of people in Assam have been affected with several rivers, including the Brahmaputra, overflowing their banks. The rivers have breached embankments, inundated villages and damaged standing crops, affecting over 80,000 people, according to the state disaster management body.

The Arunachal Times has reported that the districts of Upper Siang, Dibang Valley and Anjaw are cut off from the region due to torrential rainfall which has triggered flash floods and landslides at various locations. Major rivers in Arunachal Pradesh including the Siang are in spate. The Echo of Arunachal has reported that Pasighat, the state’s oldest administrative town, is under threat of inundation and the provision of water and electricity to town inhabitants has stopped.

Filed Under: Current, Monsoon 2015 Tagged With: Arunachal, Assam, flood, India, Meghalaya, monsoon, North-East, river

Being prudent about forecasts

June 3, 2015 by Climate portal editor Leave a Comment

ICP_pre-monsoon_seasons_2011-15_sm

The Earth System Science Organisation (ESSO), Ministry of Earth Sciences (MoES) and the India Meteorological Department (IMD) released their second long range forecast for monsoon 2015 on 2 June. The ‘headline’ message is that rainfall for the June to September monsoon season is very likely to be 88% of what is normal for the season.

The forecast has been seized upon by various quarters as having serious implications for the production of crop staples (and therefore for food security), for farmers’ livelihoods, for consumer prices and for the availability of water. These are all valid and important aspects that depend entirely or substantially upon the summer monsoon.

But, the IMD, the ESSO and the MoES do not make statements and forecasts on these aspects. They are concerned with what the climatological data and signs point to, and that is what they have told us. How the forecast relates to important aspects of food, farm incomes, water resources and food stocks relies on interpretations. Our advice – to the media, to government agencies and to the private sector – is to go slow on drawing conclusions and when conclusions are required, to make them incrementally.

The wettest pre-monsoon season (March to May) for five years.

The wettest pre-monsoon season (March to May) for five years.

Using the handy graphic here, (887KB) we also point out that the pre-monsoon season (March to May) for 2015 has been the wettest in five years. In several meteorological sub-divisions, excess rain has been recorded during this pre-monsoon season. In several districts, the annual rainfall total has already been reached, even before the typical monsoon season of June to September.

This ought to be warning enough to us to be sparing with deciding how forecasts will affect us. The ESSO, IMD and MoES have repeated, in their second long range forecast, that 2015 is an El Niño year which only means that as this sea temperature phenomenon waxes and wanes though the remainder of 2015, so too will the monsoon system react.

It is best to judge our Indian summer monsoon a week at a time, keeping in mind crop calendars and how much water our reservoirs hold. It is always prudent to take precautions such as rationing water (even when it is raining), especially in towns and cities. Likewise, district administrations will do well to assess their local supplies of food staples and match these figures with what food staples their districts are likely to produce during a monsoon whose reliability has now been written off.

The second long range forecast for monsoon 2015 is available here, and the Hindi text can be found here.

Filed Under: Monsoon 2015, Reports & Comment Tagged With: 2015, climate, consumer price, crop, El Nino, farm, food stock, forecast, IMD, India, meteorology, monsoon, sea surface temperature, water

How El Niño plans to hijack monsoon 2015

May 26, 2015 by Climate portal editor Leave a Comment

ICP_El_Nino_monsoon_20150526_sm
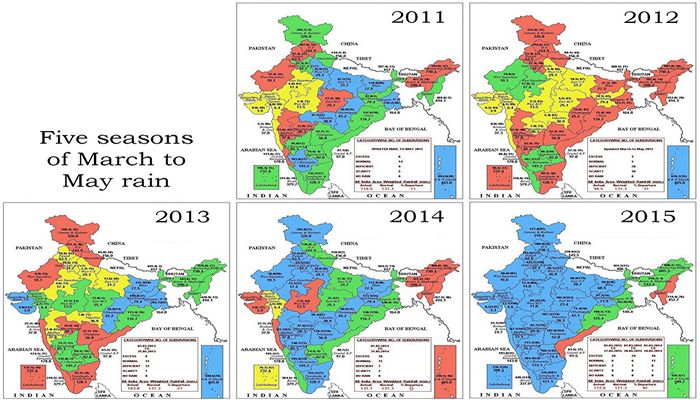
Whether the monsoon starts off on time, whether the June, July, August and September rainfall averages are met, and whether the seasonal pattern of the monsoon is maintained are expectations that must now be set aside.

According to the Climate Prediction Center’s ENSO probability forecast, there is a 90% chance that El Niño conditions will prevail through June to August of the northern hemisphere and a more than 80% percent chance El Niño will last throughout all of 2015.

The Ministry of Earth Sciences El Niño/La Nina, Indian Ocean Dipole Update (10 May 2015)

The Ministry of Earth Sciences El Niño/La Nina, Indian Ocean Dipole Update (10 May 2015)

What this means, especially when record warm global atmospheric temperatures (because we in South Asia and our neighbours in East Asia have continued burned coal as if the resulting CO2 and soot simply doesn’t exist) are being set, is the remaining months of 2015 – the monsoon period included – will bring strange, dangerous and extreme weather. We have already seen that over the last week, with the death toll from the heat wave having crossed 550.

For the first time since 1998 – ­the year of the strongest El Niño on record, which played havoc with the
world’s weather patterns and was blamed for 23,000 deaths worldwide – ­ocean temperatures in all five El Niño zones have risen above 1 degree Celsius warmer than normal at the same time. That is read by climatologists and ocean scientists as presaging an El Niño that is moderately strong to strong. The forecast models updated in May are now unanimous that El Niño is going to keep strengthening through the rest of 2015. (See also the official forecast from the USA’s government climate science agency.)

El Niño’s home is in the tropical eastern Pacific, but we in India need to watch the waters to our south very closely. New research published in the journal Nature Geoscience has examined records going back to 1950 and noticed that Indian Ocean absorbed heat at a low level until 2003. Thereafter, the excess oceanic heat in the Pacific Ocean found its way through the Indonesian archipelago and into the Indian Ocean. This is the gigantic reservoir of watery heat that is going to dictate terms to our summer monsoon, or what our school textbooks call the south-west monsoon.

It is a worry for the entire South Asian region – India, Pakistan, Sri Lanka, Bangladesh, Nepal, the Maldives, Burma, Afghanistan and Bhutan. That is why when the Forum on Regional Climate Monitoring-Assessment-Prediction for Asia (FOCRA) issued its seasonal outlook for June to August 2015 it predicted weaker than normal Indian summer and East Asian monsoons. Precipitation over land is influenced by external factors such as the El Niño Southern Oscillation (the ENSO), the ‘Indian Ocean Dipole’, the ‘Arctic Oscillation’, and so on.

There may be a “timely onset” of the monsoon, as the venerable IMD is used to saying, but that doesn’t mean our troubles are over. Far from it.

Filed Under: Latest, Monsoon 2015 Tagged With: Bangladesh, Bhutan, El Nino, ENSO, India, Indian Ocean, Maldives, monsoon, Nepal, Pacific, Pakistan, Sri Lanka

Celsius surprises in 57 cities

May 21, 2015 by Climate portal editor Leave a Comment

ICP_57_cities_temp_top

The middle of February is when the chill begins to abate. The middle of May is when the monsoon is longed for. In our towns, district headquarters and cities, that climatic journey of 90 days is one of a steady rise in the reading of the temperature gauge, from the low 20s to the mid 30s.

This large panel of 90 days of daily average temperatures shows, in 57 ways, the effects of the rains that almost every district has experienced during the last two months. For each city, the curved line is the long period ‘normal’ for these 90 days, based on daily averages. Also for each city, the second line which swings above and below the ‘normal’ is the one that describes the changes in its daily average from February to May 2015.

[You can download (1.52MB) a full resolution image of the panel here.]

Where this second line crosses to rise above the normal, the intervening space is red, where it dips below is coloured blue. The patches of red or blue are what tell us about the effects of a lingering winter, or rains that have been called ‘unseasonal’ but which we think signal a shift in the monsoon patterns.

Amongst the readings there is to be found some general similarities and also some individual peculiarities. Overall, there are more blue patches than there are red ones, and that describes how most of the cities in this panel have escaped (till this point) the typical heat of April and May. The second noteworthy general finding is that these blue patches occur more frequently in the second half of the 90 days, and so are the result of the rainy spells experienced from March to early May.

Hisar (in Haryana) has remained under the normal temperature line for many more days than above or near it. So have Gorakhpur (Uttar Pradesh), Pendra (Chhattisgarh), Ranchi (Jharkhand), Nagpur (Maharashtra) and Jharsuguda (Odisha).

On the other hand in peninsular and south India, the below ‘normal’ daily average temperature readings are to be found in the latter half of the time period, coinciding with the frequent wet spells. This we can see in Kakinada, Kurnool and Anantapur (Andhra Pradesh), Bangalore, Gadag and Mangalore (Karnataka), Chennai, Cuddalore and Tiruchirapalli (Tamil Nadu) and Thiruvananthapuram (Kerala). [A zip file with the charts for all 57 cities is available here (1.2MB).]

What pattern will the next 30 days worth of temperature readings follow? In four weeks we will update this bird’s eye view of city temperatures, by which time monsoon 2015 should continue to give us more blues than reds. [Temperature time series plots are courtesy the NOAA Center for Weather and Climate Prediction.]

Filed Under: Current, Monsoon 2015, Reports & Comment Tagged With: Anantapur, Andhra Pradesh, Bangalore, Chennai, Chhattisgarh, city, climate, Cuddalore, Gadag, Gorakhpur, India, Jharkhand, Jharsuguda, Kakinada, Karnataka, Kerala, Kurnool, Maharashtra, Mangalore, monsoon, Nagpur, Odisha, Ranchi, Tamil Nadu, temperature, Thiruvananthapuram, Tiruchirapalli, town, urban, Uttar Pradesh

Rain, climate, agriculture and Haryana

May 4, 2015 by Climate portal editor Leave a Comment

RG_ICP_rainfall_HAR_5Every one of Haryana’s 21 districts received excess rain for the period 1 March to 30 April 2015. As these rains have destroyed crops, including food staples, the need to compensate the affected farming families is now paramount. Relief and support are only useful when they are arrive quickly, and unlike administrative conditions two generations ago, state governments and district collectors today can consult data around the clock about conditions in districts and blocks.

Our infographic shows why the March and April rains in Haryana have had destructive effects. The average rainfall in a district of Haryana during this two-month period was 111.6 millimetres – most were in the range of 148 mm (like Ambala) and 81 mm (like Mahendragarh). However, the average for the two months, March and April, is 21.2 mm (Panipat and Faridabad are usually closest to this average).

RG_ICP_rainfall_HARAlthough the level of detail available at the district, and indeed even at the weather station level, is comprehensive, the Indian Meteorological Department’s rainfall quantity categories are not granular enough to describe what Haryana has experienced. (This is so for every state that has recorded what is called “unseasonal rain” in these months.)

Amongst the questions that remain unanswered concerning the ‘unseasonal rains’ phenomena – common to Haryana, eastern and western Uttar Pradesh, Bihar, Madhya Pradash, Rajasthan and Gujarat – is the matter of how much rain becomes excess over how many days? This meteorological sub-division (Haryana, Chandigarh and Delhi) normally receives 165 mm in July and 173 mm in August. Therefore, an average amount of 111.6 mm over two months is not a quantity that has surprised the agricultural community.

The matter is one of timing – which lapse the state administration needs to explain, as the weather forecasters first alert state administrations, which then relay alerts and advisories to district administrative staff. Between the claims for compensation for destroyed crops and the political point-scoring, the state government of Haryana has side-stepped the question: what did it do with the weather advisories it was given in March and April 2015?

For our series on the changing rainfall and climate patterns (the Haryana map is the first), we use six categories that begin with 10% above normal and extend to 1000% above normal. This method does better at identifying districts in which agriculture has been hit harder by unseasonal rains and stormy weather.

Filed Under: Latest, Monsoon 2015 Tagged With: 2015, agriculture, Climate Change, crop, district, farmer, Haryana, monsoon, rainfall

  • 1
  • 2
  • Next Page »

Indiaclimate twitter

Tweets by @Indiaclimate

Notable

Between contemplation and climate

Whether or not the USA, Europe, the Western world, the industrialised Eastern world (China, Japan, South Korea, Taiwan), adhere to or not their paltry promises about being more responsible concerning the factors that lead to climate change, is of very little concern to us. We have never set any store by international agreements on climate […]

The ‘Hindu’, ignorant about weather and climate, but runs down IMD

We find objectionable the report by ‘The Hindu’ daily newspaper accusing the India Meteorological Department of scientific shortcoming (‘IMD gets its August forecast wrong’, 1 September 2016). The report claims that the IMD in June 2016 had forecast that rains for August would be more than usual but that the recorded rain was less than […]

dialogue

  • Misreading monsoon | Resources Research on Misreading monsoon
  • Satish on A tribute to the weathermen of Bharat
  • Climate portal editor on A tribute to the weathermen of Bharat
  • Climate portal editor on A tribute to the weathermen of Bharat
  • Climate portal editor on A tribute to the weathermen of Bharat

Categories

Copyright © 2025 indiaclimateportal.org.