The India Climate Observatory

Commentary, action and research on climate and development in India

  • Home
  • About
  • Monsoon 2018
  • Current
  • Bulletin
  • Contact
  • Announcements

Vidarbha’s monsoon secret comes out in our innovative new rainfall index

August 18, 2017 by Climate portal editor Leave a Comment

Monsoon rains in Vidarbha better than the rains in Konkan Maharashtra? How can this be possible? Especially when the average rainfall for the seven districts of Konkan Maharashtra, over 1 June to 9 August, is 1,812 mm and the average rainfall for the 11 districts of Vidarbha Maharashtra is 427 mm over the same period?

The measure that we are piloting is not based on the cumulative totals, for each district during each week of monsoon 2017, but for how adequate the rainfall has been over each week. What does that mean? Maharashtra’s Konkan region receives over four times the amount of rainfall that Vidarbha does. This does not mean that Vidarbha is more ‘rain poor’ than Konkan Maharashtra. The two meteorological regions are different just as their agro-ecologies, soils, water retention structures and flora are different.

Because of this difference, it is more useful to us to judge how adequate rainfall has been over any given period of measurement. We have taken a week because that is what we have data for, as provided by the Department of Hydrometeorology or the Department of Agricultural Meteorology of the India Meteorological Department, Ministry of Earth Sciences.

If you examine the cumulative totals – this means the running totals which from one week to the next carry over extras or deficits – the picture is as follows. One district only (Mumbai City) of the seven in Konkan Maharashtra is deficit (with -22%), all the rest being ‘normal’ in the range of -19% to +22%. The cumulative measurement picture for Vidarbha is this: only four out of the 11 districts (Buldana, Gadchiroli, Nagpur and Wardha) are ‘normal’ and in the range of -15% to -19%. The remaining seven are ‘deficit’ in the range of -23% to -36% (Amravati and Yavatmal being the lowest).

The weakness of the cumulative measure is that it ‘carries forward’ deficits and surpluses. A deficit in weeks 3 and 4 can be ‘made up’ for by better rains in week 5 and 6. But when rain in weeks 3 and 4 are important for a particular phase of a crop’s growth, the surplus that follows is of little use.

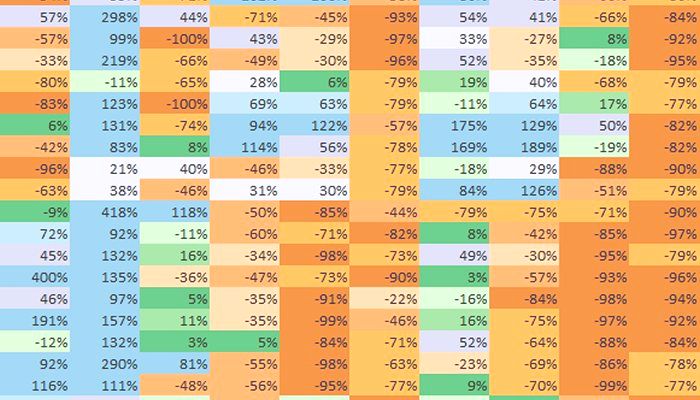
That’s where this pilot measure, what I have called the ‘rainfall adequacy index’, comes in. It indexes normalcy and variation from normalcy, plus or minus, and so records how adequate every week has been for the district. Using this method, we find that among Maharashtra’s meteorological regions, it is Vidarbha that has done best over 1 June to 9 August, followed by Konkan Maharashtra, then by Madhya Maharashtra and with Marathwada last.

The footnote is that the three districts with the best ‘rainfall adequacy index’ over this period are, in order, Sindhudurg, Nagpur and Wardha. The three districts with the worst index are Osmanabad, Nashik and both Thane and Palghar.

– Rahul Goswami

Filed Under: Latest, Monsoon 2017 Tagged With: 2017, agriculture, district, ecology, hydrometeorology, India, Konkan, Madhya Maharashtra, Maharashtra, Marathwada, monsoon, Mumbai, rainfall, Vidarbha, water

Rain for the Rani

July 2, 2017 by Climate portal editor Leave a Comment

We find that the heavy rains that soaked the north Gujarat plains on the night of 1/2 July are testimony to the genius and far-sightedness of the builders of the Rani-ki-Vav, the famed stepwell which was initially built as a memorial to a king in the 11th century AD. The central heavy rainfall zone was immediately to the north-west of Patan, the town nearest to the Rani-ki-Vav, and it is precisely for this sort of rain that this fabulously constructed stepwell was built.


Rain for the Rani. At about 8pm on 1 July, dense rainclouds hung over the entire north #Gujarat plains, from ancient Dholavira to Dahod ..2

— Indiaclimate (@Indiaclimate) July 2, 2017


..by 8:30 pm showers were being reported from towns in the region while farther north in #Rajasthan, heavy rain pelted Barmer and Jalor ..3

— Indiaclimate (@Indiaclimate) July 2, 2017


..Rain for the Rani. At around 9pm the rainfall had become very heavy, reaching 15mm/hour, quickly leaching into the parched soil ..4 pic.twitter.com/zHLFHzcVmH

— Indiaclimate (@Indiaclimate) July 2, 2017


..The cores of two cloud masses were converging. The heavy rain was now on two parallel fronts each about 300 km wide ..5 pic.twitter.com/gamGJtCQGp

— Indiaclimate (@Indiaclimate) July 2, 2017


.. Rain for the Rani. At around midnight the Rajasthan and Gujarat core rainfall zones merged and the intensity lessened #monsoon2017 ..6 pic.twitter.com/MCpROK4jLo

— Indiaclimate (@Indiaclimate) July 2, 2017


..On the ground, about 2 km outside the old town of Patan, the water levels in an 11th century structure were rising. This remarkable ..7

— Indiaclimate (@Indiaclimate) July 2, 2017


..well, the Rani Ki Vav, was sited, designed, engineered and adorned exactly for rains such as this !! Town streets flooded and cars ..8 pic.twitter.com/sKD03C7sYp

— Indiaclimate (@Indiaclimate) July 2, 2017


..stalled. But the old channels & chambers of the Rani Ki Vav were proving the vision and sagacity of the celebrated stepwell’s creators ..9

— Indiaclimate (@Indiaclimate) July 2, 2017


..Designed as an inverted temple highlighting the sanctity of water, the Rani Ki Vav combines #water storage with exceptional artistry ..10 pic.twitter.com/CWxBh2cyW7

— Indiaclimate (@Indiaclimate) July 2, 2017


..We marvel at the foresight and knowledge of the Vav’s builders. To the north and north-west of the stepwell lay the zone in which this .11

— Indiaclimate (@Indiaclimate) July 2, 2017


..torrent of rain fell over 1/2 July, recharging the subterranean water storage system whose design origin is the 3rd millennium BC ..12 pic.twitter.com/wEWYyCRgnu

— Indiaclimate (@Indiaclimate) July 2, 2017


..This is the 4 hour 30 min sequence of intense #monsoon2017 rainfall in north #Gujarat and adjacent #Rajasthan – Rain for the Rani pic.twitter.com/zeuKb6SCZG

— Indiaclimate (@Indiaclimate) July 2, 2017

Filed Under: Monsoon 2017, Reports & Comment Tagged With: 2017, Gujarat, heritage, India, monsoon, rain, Rajasthan, stepwell, traditional knowledge, water

A typical June for the 2017 monsoon

June 24, 2017 by Climate portal editor Leave a Comment

Three weeks of rainfall during the ‘official’ monsoon (which both within meteorological circles and outside is still said to begin on 1 June) season, we are now able to present the week by week trend.

The graphic (click for full size image) shows the distribution of districts according to our expanded measure for rainfall adequacy. We call this expanded as it has 12 categories (11 plus ‘no data’) which we debuted in 2015.

To be used mainly as a planning and response indicator – such as preparing for the consequences of a dry spell or readying contingency plans if continued heavy rainfall make flooding a likelihood – our expanded measure also provides a weekly snapshot of rainfall at the district level. These snapshots, which in the graphic take the form of coloured horizontal bars, when stacked together give us a trend.

The indiaclimate visualisation of rainfall distribution by districts using our 12-grade category scale.

What we see from the bars that represent district rainfall distribution for three weeks is that the 2017 monsoon has for this period been what the India Meteorological Department first forecast in April, and then confirmed in May: that this year’s monsoon will be normal.

In each horizontal bar the most important category is the one marked “+10% to -10%” as this is the ‘core’ normal range of 10% above and below the long-term average. Since our time-frame for each snapshot is one week, this means the long-term average rainfall for a district for that week. Next in importance are the two categories that follow, above and below. These are the “-11% to -20%” and “+11% to +20%” and may be interpreted as satisfactory.

Thus we see that for the week ending 07 June (the lowest bar) 41 districts recorded normal rainfall for that week, 22 recorded satisfactory (but below normal) and 15 recorded satisfactory (but above normal). The similar distribution the following week, that is ending 14 June and the middle bar, was 39, 26 and 11. And the distribution for the latest week, that is ending 21 June and the top bar, is 61, 35 and 21.

However as the monsoon has weakened over the last few days and may not regain its customary vigour for this time of the year until 27 or 28 June, we expect our next instalment to show more districts in the browner shades towards the left of the categories bar.

You can follow our monsoon data, graphics and commentary on both our website and twitter channel.

Filed Under: Latest, Monsoon 2017 Tagged With: 2017, India, monsoon, rain, trend

Indiaclimate twitter

Tweets by @Indiaclimate

Notable

Between contemplation and climate

Whether or not the USA, Europe, the Western world, the industrialised Eastern world (China, Japan, South Korea, Taiwan), adhere to or not their paltry promises about being more responsible concerning the factors that lead to climate change, is of very little concern to us. We have never set any store by international agreements on climate […]

The ‘Hindu’, ignorant about weather and climate, but runs down IMD

We find objectionable the report by ‘The Hindu’ daily newspaper accusing the India Meteorological Department of scientific shortcoming (‘IMD gets its August forecast wrong’, 1 September 2016). The report claims that the IMD in June 2016 had forecast that rains for August would be more than usual but that the recorded rain was less than […]

dialogue

  • Misreading monsoon | Resources Research on Misreading monsoon
  • Satish on A tribute to the weathermen of Bharat
  • Climate portal editor on A tribute to the weathermen of Bharat
  • Climate portal editor on A tribute to the weathermen of Bharat
  • Climate portal editor on A tribute to the weathermen of Bharat

Categories

Copyright © 2025 indiaclimateportal.org.