Employing the modified rainfall measurement categories, we have prepared a ‘report card’ for ten weeks of rainfall beginning with the week 02-08 June and continuing until the most recent which is the week of 04-10 August. This ‘report card’ is based on the recorded rainfall for each district and how much it varies from the normal for that particular week. This variation is portrayed by our ‘report card’ through the modified categories, which are designed to show more finely not merely deficient or excess rainfall, as the current categories do, but the degree of deficiencies or excesses for that district, for that week.
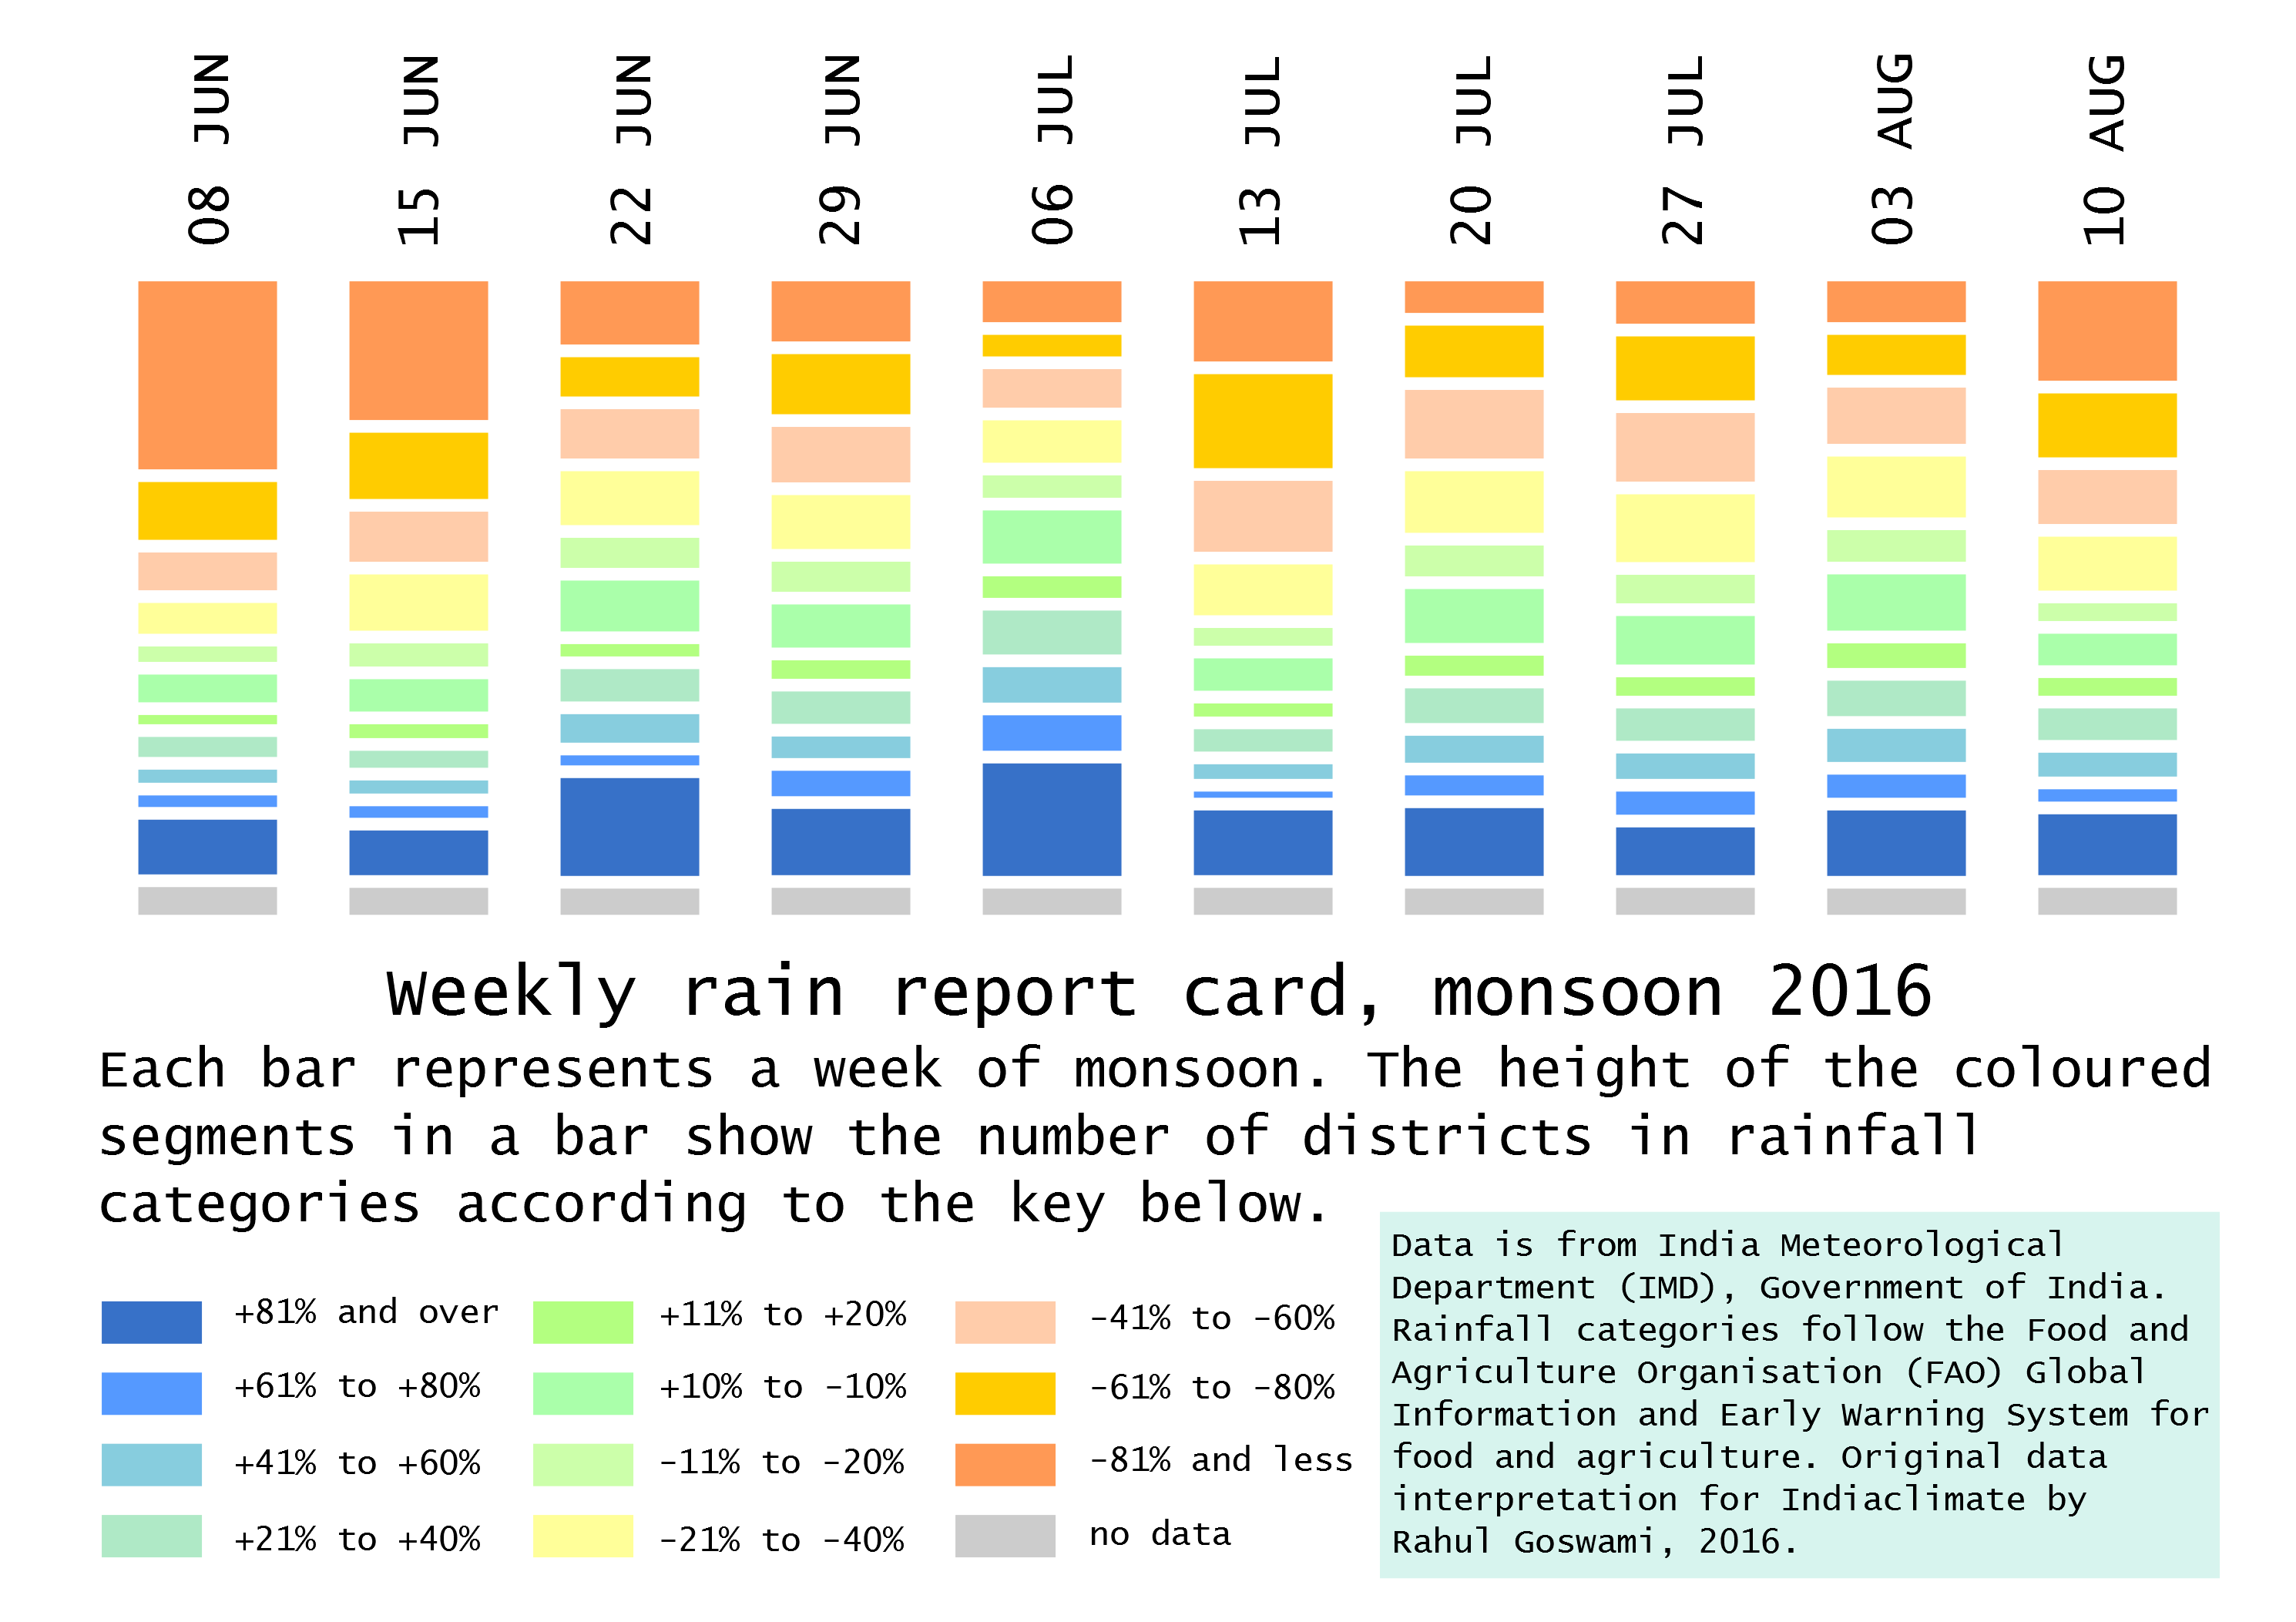
Our indicator of eleven grades (compared with the four of the India Meteorological Department, IMD) uses the same weekly district data to provide greater detail about rainfall adequacy or lack. Using this method we can immediately see from the chart:
1. From the week ending 22 June there have been a large number of districts – between 20% and 40% of all districts for which data is available – included in the four categories that describe rainfall of +20% above the normal.
2. That notwithstanding the overall seasonal prediction of monsoon 2016 having thus far been proved correct, there are almost every week a sizeable number of districts falling in the three categories for deficient rainfall.
3. That for the ten weeks in our report card the number of districts in the -21% to -40% below normal band is greater than the number of districts in the band for +21% to +40%.
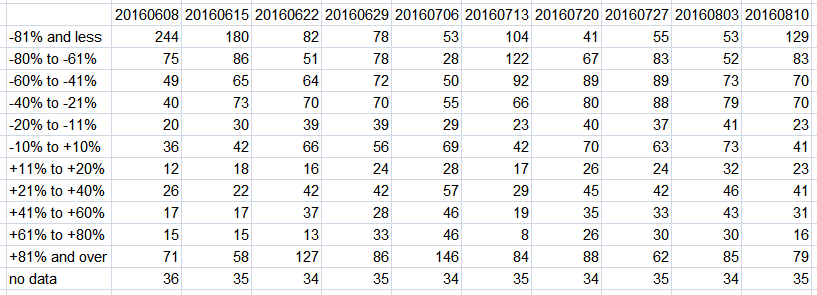
In the chart, each bar corresponds to a week of district rainfall readings, and that week of readings is split into eleven grades (plus one for no data). In this way, the tendency for administrations, citizens, the media and all those who must manage natural resources (particularly our farmers), to think in terms of an overall ‘deficit’ or an overall ‘surplus’ is halted.
We find that our modified rainfall categories are more informative at the district level – and therefore cumulatively at the state and meteorological sub-division levels too – and can readily be adopted by administrations and planners.
In today’s concerns that have to do with the impacts of climate change, with the increasing variability of the monsoon season, and especially with the production of food crops, the IMD’s stock measurement – ‘normal’ is rainfall up to +19% above a given period’s average and also down to -19% from that same average, ‘excess’ is +20% rain and more, ‘deficient’ is -20% to -59% and ‘scanty’ is -60% to -99% – is no longer viable.