The India Climate Observatory

Commentary, action and research on climate and development in India

  • Home
  • About
  • Monsoon 2018
  • Current
  • Bulletin
  • Contact
  • Announcements

Late, but on the way

May 28, 2019 by Climate portal editor Leave a Comment

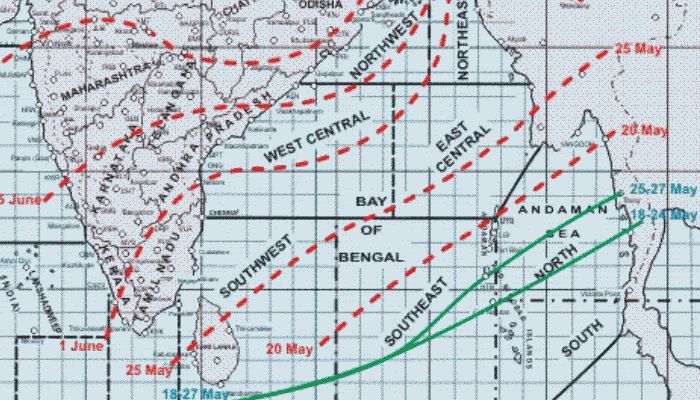
At this point, the monsoon 2019 system is farther away, in terms of its movement, than where it is normally found at this time of the year. The India Meteorological Department maintains its maps showing the movement of the system through late May and early June.

Judged against its averaged movement over the last decade and over a 50-year long-term average, the northern limit of the system is some 450 kilometres away from where it usually is in the south-west Bay of Bengal, and is about 400 kilometres away from the more easterly end of the same perimeter in the east-central Bay of Bengal. Whereas around 27 May the monsoon system would have normally been some 150 kilometres north of the Andaman Islands, now it is at 11N (near Little Andaman).

This delay has no bearing on the forecast for the overall adequacy of rainfall during monsoon 2019 because, as the IMD has said, the large-scale features which influence our monsoon are favourable, these being:
* Weak El Niño conditions that are prevailing over the equatorial Pacific Ocean; the latest Monsoon Mission Climate Forecasting System (MMCFS) forecast indicates that these conditions are likely to continue during the monsoon season but with reduced intensity.
* Neutral Indian Ocean Dipole (IOD) conditions over the Indian Ocean; the latest MMCFS forecast indicates these conditions are likely to continue during the monsoon season.

The weekly outlooks are as follows.
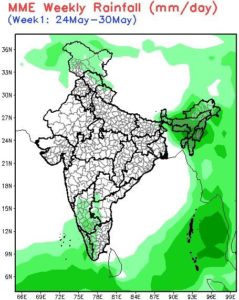
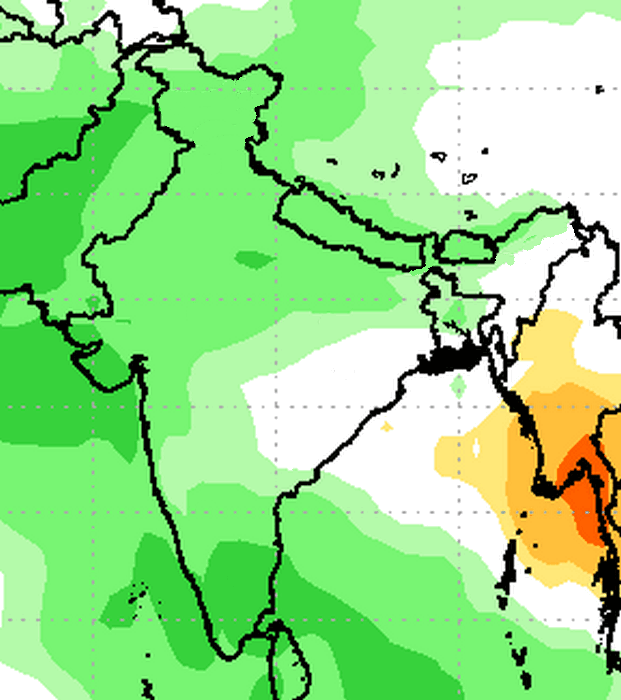
The week 24 May to 30 May: the south-west monsoon cloud cover belt moves into sea regions – the south-east Arabian Sea, the south-west and south-east Bay of Bengal, and the north Andaman Sea. Showers in the entire north-eastern region with heavier daily rain (5-10 mm/day) in Manipur, Nagaland and Assam hills. Light showers in Karnataka, Kerala, adjacent Tamil Nadu and Rayalaseema.

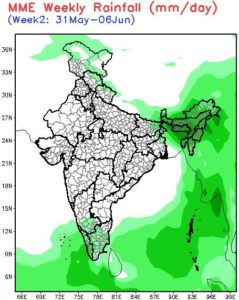
The week 31 May to 06 Jun: the south-west monsoon cloud cover belt does not advance further into the Arabian Sea while it moves further north into the east-central Bay of Bengal. The north-east region continues to have showers as the eastern Himalayan region is fully covered. Lower Assam and Meghalaya to have heavier showers of up to 20 mm/day. The spread of light showers in Tamil Nadu is wider as the north Lankan gap between the cloud fronts over the Arabian Sea and Bay of Bengal closes, light showers (up to 5 mm/day) continue in Kerala and south interior Karnataka.

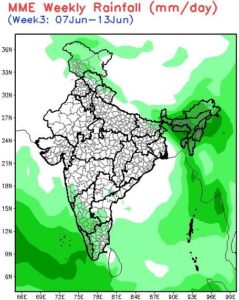
The week 07 Jun to 13 Jun: the main feature is the advance of the south-west monsoon cloud cover belt into the east-central Arabian Sea (off the central Konkan coast). With the limits of the south-west monsoon cloud cover belt remaining as they were over the Bay of Bengal, light showers extend over Tamil Nadu, south interior and coastal Karnataka, Goa and the Maharashtra Konkan with heavier showers (5-10 mm/day in Kerala). All states of the north-east continues to receive heavier showers (10-20 mm/day) and the western Himalaya – all divisions of Jammu & Kashmir, the northern halves of Himachal Pradesh and Uttarakhand – receive light showers.

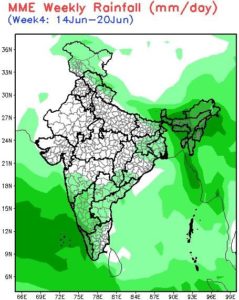
The week 14 Jun to 20 Jun: consolidation of the south-west monsoon cloud cover belt over the seas with the east-central and north-east Arabian Sea fully reached, the north-east Bay of Bengal likewise, and its north-west entered. This brings heavier daily rain (up to 20 mm/day to all states of the north-east and light showers to West Bengal, parts of Bihar, Jharkhand, parts of Odisha. The entire west coast has rain with the northern precipitation line from Thane (20N) to Latur (18N), to Warangal (18N) and Kondagaon (in Chhattisgarh, 20N), to Rayagada (in Odisha, 19N). Light showers also in the western Himalayan region (up to 5 mm/day).

Filed Under: Current, Monsoon 2019 Tagged With: 2019, climate, India, monsoon

India becoming 1.4°C warmer until 2045

August 5, 2017 by Climate portal editor Leave a Comment

Launched in 2009 with the support of the Ministry of Earth Sciences (MoES), Government of India, the Centre of Climate Change Research (CCCR) is part of the Indian Institute of Tropical Meteorology (IITM) in Pune, Maharashtra. The CCCR focuses on development of new climate modelling capabilities in India and South Asia to address issues concerning the science of climate change.

The Centre has now released an ‘Interim Report on Climate Change over India’ which is intended to provide a brief overview of: (a) updated assessment of observed climate change over India, (b) future climate projections over India, (c) development of the IITM Earth System Model to better understand and quantify climate change and its regional impacts. The three topics, which are among the core research activities of the CCCR at IITM, have been presented as three chapters in this Interim Report, and an updated report is planned to be submitted later next year.

Assessments of impacts of climate change and future projections over the Indian region, have so far relied on a single regional climate model (RCM) such as the PRECIS RCM of the Hadley Centre, UK. While these assessments have provided inputs to various reports (INCCA 2010; NATCOMM2 2012), it is important to have an ensemble of climate projections drawn from multiple RCMs due to large uncertainties in regional-scale climate projections. Ensembles of multi-RCM projections driven under different perceivable socio-economic scenarios are required to capture the probable path of growth, and provide the behavior of future climate and impacts on various biophysical systems and economic sectors dependent on such systems. [The full report is available here (pdf).]

The Centre for Climate Change Research, Indian Institute of Tropical Meteorology (CCCR-IITM) has generated an ensemble of high resolution downscaled projections of regional climate and monsoon over South Asia until 2100 for the Intergovernmental Panel for Climate Change (IPCC) using a RCM (ICTP-RegCM4) at 50 km horizontal resolution, by driving the regional model with lateral and lower boundary conditions from multiple global atmosphere-ocean coupled models from the Coupled Model Intercomparison Project Phase 5 (CMIP5). The future projections are based on three Representation Concentration Pathway (RCP) scenarios (viz., RCP2.6, RCP4.5, RCP8.5) of the IPCC.

These high-resolution downscaled projections of regional climate over South Asia are generated as part of the International Programme called Coordinated Regional Downscaling Experiment (CORDEX) sponsored by the World Climate Research Programme. This chapter provides a synthesis of results from the CORDEX South Asia multi-RCM outputs, that allows us to interpret the strengths and limitations of future regional climate projections over India. This information is useful to reduce uncertainty of impact assessment estimates to an extent and provide a pan-Indian regional assessment for informed policy-making.

Key points

⊗ The all India mean surface air temperature change for the near-term period 2016–2045 relative to 1976–2005 is projected to be in the range of 1.08°C to 1.44°C, and is larger than the natural internal variability. This assessment is based on a reliability ensemble average (REA) estimate incorporating each RCM performance and convergence, and is associated with less than 16% uncertainty range.

⊗ The all India mean surface air temperature is projected to increase in the far future (2066–2095) by 1.35 ±   0.23°C under RCP2.6, 2.41 ± 0.40°C under RCP4.5 and 4.19 ± 0.46°C under RCP8.5 scenario respectively. These changes are relative to the period 1976–2005. The semi-arid north-west and north India will likely warm more rapidly than the all India mean.

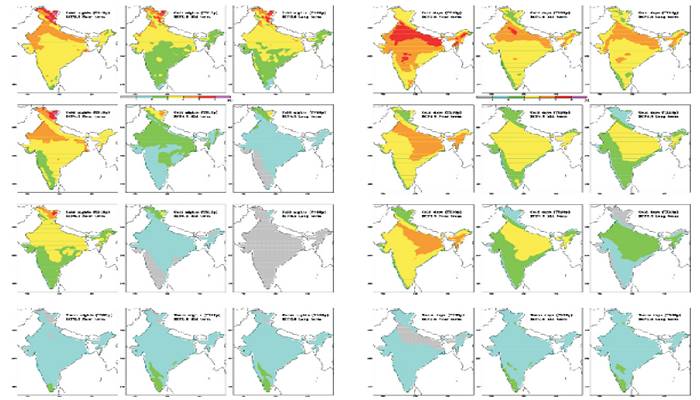
⊗ Monthly increase in all India mean surface air temperature based on REA estimate is relatively higher during winter months than in the summer monsoon months throughout the 21st century under the three RCP scenarios.

⊗ The REA changes for all India annual minimum temperature of 4.43 ± 0.34oC is more pronounced than that of 3.94 ± 0.45oC and 4.19 ± 0.46oC increases estimated for the respective annual maximum and mean temperatures respectively the end of the 21st century under RCP8.5 scenario. The models project substantial changes in temperature extremes over India by the end of the 21st century, with a likely overall decrease in the number of cold days and nights, and increase in the number of warm days and nights.

⊗ Although the all India annual precipitation is found to increase as temperature increases, the REA assessment indicates that precipitation changes throughout the 21st century remain highly uncertain.

⊗ The all India annual precipitation extremes are projected to increase with relatively higher uncertainty under RCP8.5 scenario by the end of the 21st century. The downscaled projections suggest that intensification of both dry and wet seasons is expected along the west coast of India and in the adjoining peninsular region.

The multi-RCM ensemble mean annual precipitation mid-term increase exceeds 10% over the west coast and the adjoining southern parts of the Indian peninsula for RCP4.5 scenario, while in the long-term the change for this mid-scenario exceeds 20% over the south-west coast and the adjoining Kerala state. The precipitation changes are not significant over the remaining parts of India for this mid-scenario up to the mid 21st century, however in long-term increase exceed 10% over north-west and adjoining parts of the country. The long-term projected annual precipitation increase exceeds 10% over most parts of India except in Jammu and Kashmir under RCP8.5 scenario, with relatively higher increase exceeding 30% projected along the west coast of India for this high-emission scenario by the end of 21st century.


Filed Under: Current Tagged With: Climate Change, earth sciences, earth system model, Hadley Centre, IITM, India, IPCC, MoES, precipitation, RCP, regional climate model, temperature, Tropical Meteorology

Big water storage wheel

April 29, 2017 by Climate portal editor Leave a Comment

The Central Water Commission, Ministry of Water Resources, Government of India, monitors every day the quantity of water stored (and used from) each of the 91 major reservoirs of the country. It issues a bulletin every week that gives the weekly storage position of these reservoirs – the volume of water, the level of water in the reservoir and the change from the last week, the change from the same date last year and from the average on this date of the last ten years.

The water storage capacity of these 91 reservoirs taken together is 157.799 billion cubic metres (bcm) which is estimated to be about 62% of the total water storage capacity (in other smaller dams and storage structures all over the country) that has been built and is being used, and which is approximately 253.38 bcm. Out of these 91 reservoirs, hydro-electric power stations (with a capacity of 60 megawatts and more) are attached to 37 reservoirs.

In this illustration by Indiaclimate, for the first time the total storage capacity of the 91 major reservoirs has been visually mapped to show reservoir, state and zone capacities relative to each other and the total.

These are the reservoirs with state, reservoir name and full reservoir level in billion cubic metres (bcm). For a good quality file that you can print, write to us.

South zone reservoirs (AP for Andhra Pradesh, TG for Telengana, APTG for Andhra Pradesh and Telegana together, KAR for Karnataka, TN for Tamil Nadu, KER for Kerala): AP, Somasila (1.994); TG, Sriramsagar (2.3); TG, Lower Manair (0.621); APTG, Srisailam (8.288); APTG, Nagarjuna Sagar (6.841); KAR, Krishnaraja Sagra  (1.163); KAR, Tungabhadra (3.276); KAR, Ghataprabha (1.391); KAR, Bhadra (1.785); KAR, Linganamakki (4.294); KAR, Narayanpur (0.863); KAR, Malaprabha (Renuka) (0.972); KAR, Kabini (0.444); KAR, Hemavathy (0.927); KAR, Harangi (0.22); KAR, Supa (4.12); KAR, Vanivilas Sagar (0.802); KAR, Almatti (3.105); KAR, Gerusoppa (0.13); KER, Kallada (Parappar) (0.507); KER, Idamalayar (1.018); KER, Idukki (1.46); KER, Kakki (0.447); KER, Periyar (0.173); KER, Malapmuzha (0.224); TN, Lower Bhawani (0.792); TN, Mettur (Stanley) (2.647); TN, Vaigai (0.172); TN, Parambikulam (0.38); TN, Aliyar (0.095); TN, Sholayar (0.143). Total for 31 reservoirs 51.59 bcm

West zone reservoirs (GUJ for Gujarat, MAH for Maharashtra): GUJ, Ukai (6.615); GUJ, Sabarmati (Dharoi) (0.735); GUJ, Kadana (1.472); GUJ, Shetrunji (0.3); GUJ, Bhadar (0.188); GUJ, Damanaganga (0.502); GUJ, Dantiwada (0.399); GUJ, Panam (0.697); GUJ, Sardar Sarovar (1.566); GUJ, Karjan (0.523); MAH, Jayakwadi (Paithon) (2.171); MAH, Koyana (2.652); MAH, Bhima (Ujjani) (1.517); MAH, Isapur (0.965); MAH, Mula (0.609); MAH, Yeldari (0.809); MAH, Girna (0.524); MAH, Khadakvasla (0.056); MAH, Upper Vaitarna (0.331); MAH, Upper Tapi (0.255); MAH, Pench (Totaladoh) (1.091); MAH, Upper Wardha (0.564); MAH, Bhatsa (0.942); MAH, Dhom (0.331); MAH, Dudhganga (0.664); MAH, Manikdoh (Kukadi) (0.288); MAH, Bhandardara (0.304). Total for 27 reservoirs 27.07 bcm

East zone reservoirs (JHR for Jharkhand, ODI for Odisha, WB for West Bengal, TRI for Tripura): JHR, Tenughat (0.821); JHR, Maithon (0.471); JHR, Panchet Hill (0.184); JHR, Konar (0.176); JHR, Tilaiya (0.142); ODI, Hirakud (5.378); ODI, Balimela (2.676); ODI, Salanadi (0.558); ODI, Rengali (3.432); ODI, Machkund (Jalput) (0.893); ODI, Upper Kolab (0.935); ODI, Upper Indravati (1.456); WB, Mayurakshi (0.48); WB, Kangsabati (0.914); TRI, Gumti (0.312). Total for 15 reservoirs 18.83 bcm

Central zone reservoirs (UP for Uttar Pradesh, UTT for Uttarakhand, MP for Madhya Pradesh, CHT for Chhattisgarh): UP, Matatila (0.707); UP, Rihand (5.649); UTT, Ramganga (2.196); UTT, Tehri (2.615); MP, Gandhi Sagar (6.827); MP, Tawa (1.944); MP, Bargi (3.18); MP, Bansagar (5.166); MP, Indira Sagar (9.745); MP, Barna (0.456); CHT, Minimata Bangoi (3.046); CHT, Mahanadi (0.767). Total for 12 reservoirs 42.30 bcm

North zone reservoirs (HP for Himachal Pradesh, PUN for Punjab, RAJ for Rajasthan): HP, Gobind Sagar (Bhakra) (6.229); HP, Pong Dam (6.157); PUN, Thein  (2.344); RAJ, Mahi Bajaj Sagar (1.711); RAJ, Jhakam (0.132); RAJ, Rana Pratap Sagar (1.436). Total for 6 reservoirs 18.01 bcm

Filed Under: Current Tagged With: agriculture, Bharat, dam, drinking water, hydel, hydro, India, irrigation, reservoir, water, water pump, water resources, water storage

Monsoon outlook for June and July

May 29, 2016 by Climate portal editor Leave a Comment

ICP_monsoon2016_20160529

At the end of May 2016, based on a reading of the seasonal forecasts of our Earth System Science Organisation group (under the Ministry of Earth Sciences) and complemented by the collaborative seasonal forecasts of the NOAA Center for Weather and Climate Prediction, we have prepared an outlook for the June and July monsoon 2016 months.

The regional rainfall outlook for June and July 2016. Green hues are +0.25 to +1mm/day averaged over the outlook period.

The regional rainfall outlook for June and July 2016. Green hues are +0.25 to +1mm/day averaged over the outlook period.

The outlook shows: (1) that our main concern of whether the first stage monsoon forecast of the IMD remains true is fulfilled, which is, that the 2016 monsoon will be normal (and better than normal in some regions); (2) that our next most important concern of whether any region will have significantly below normal rainfall is also addressed, and under the current forecasts there is no such region; (3) that the June and July rains will be at least normal in most states and meteorological sub-divisions.

Some provisos need to be observed. The seasonal forecasts are released for three month spells (May to July, June to August, and so on). Depending on the kind of modelling that is followed (and there are several) the outlooks are updated or modified every 10 days to fortnightly to monthly. These updates are based on what are called ‘initial conditions’ which for our current outlook is the first half of May.

Here is a more detailed regional outlook for June and July 2016:
• Tamil Nadu and Kerala will have rain that over the season is +1 to +1.25mm/day.
• Karnataka, Andhra Pradesh and Telengana, Madhya Pradesh, most of Maharashtra, all the states of northern and north-west India, Uttar Pradesh and Bihar, Sikkim, Arunachal, lower Assam, western Meghalaya, and Lakshadweep will have rain that that over the season is +0.25 to +1 mm/day.
• Odisha, Chhattisgarh, southern Jharkhand, gangetic West Bengal, eastern Vidarbha (Maharashtra), the north-eastern half of Telengana, north coastal Andhra Pradesh, upper Assam, Nagaland, Manipur, Mizoram and Tripura will have rain that over the season is -0.2 to +0.25mm/day and Andaman and Nicobar islands will have rain that is up to -0.5 mm/day.

This outlook we will amend between June 10 and 15 as the ESSO’s forecasts and international collaborative monsoon forecasts are updated.

Filed Under: Current, Monsoon 2016 Tagged With: 2016, climate, forecast, India, monsoon, season

Prepare for May heat

May 4, 2016 by Climate portal editor Leave a Comment

ICP_May_heat_20160504The heat outlook for the first half of May, which was released by the India Meteorological Department (IMD) on 02 May, calls for immediate attention and preparation on all fronts.
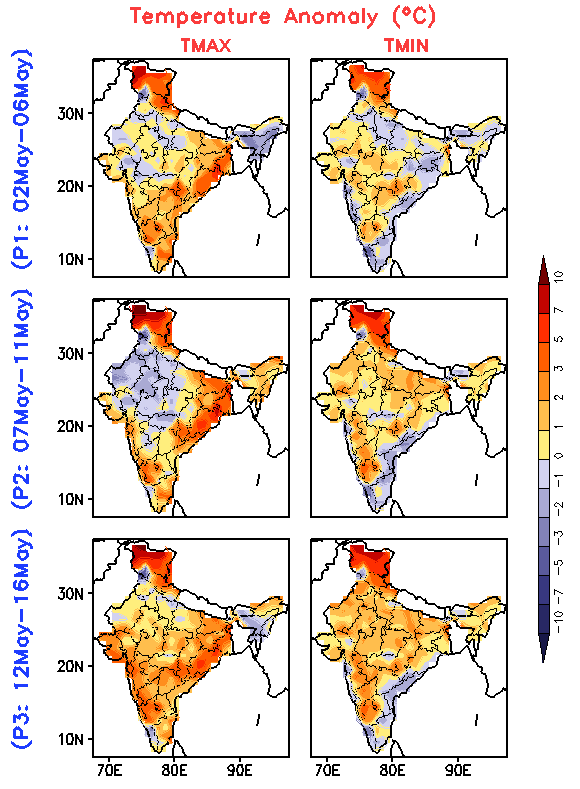
The forecast is for three periods of five days each (called pentads) with expected temperature anomalies given for maximum and minimum temperatures. The big picture is that over some parts of the country maximum temperatures will remain 3-4 C above normal for all the three pentads.

Minimum temperatures that are 1-5 degrees higher than normal will increase in terms of the geographical range as the days progress through the first, second and third pentad: 02 to 06 May, 07 to 11 May and 12 to 16 May.

There are several particular alerts arising from the IMD heat wave outlook:

The heat outlook for the first half of May, released by the India Meteorological Department (IMD), for the three five-day periods of 02 to 06 May, 07 to 11 May and 12 to 16 May.

The heat outlook for the first half of May, released by the India Meteorological Department (IMD), for the three five-day periods of 02 to 06 May, 07 to 11 May and 12 to 16 May.

1. Odisha, Gangetic West Bengal and south Chhattisgarh, which have seen some record-breaking high temperatures in April, will continue to see above normal maximum temperatures.

2. South Interior Karnataka, coastal Maharashtra and Goa (the Konkan), and Saurashtra will experience a gradual rise in maximum temperatures from the first to third pentad.

3. Maximum and minimum temperatures both, in Jammu and Kashmir, Himachal Pradesh and Uttarakhand will remain around 5 C above normal for the duration of the forecast.

4. The 12 to 16 May period (third pentad) will see higher than normal maximum temperatures (2 to 5 C) over almost the entire country, and higher than normal minimum temperatures over most of the country.

Other observations are:

5. The North-East will experience minimum temperatures about a degree higher than normal during 07 to 16 May.

6. For the second pentad, that is 07 to 11 May, maximum temperatures in north-west India (Punjab, Haryana, western Uttar Pradesh, Rajasthan, western Madhya Pradesh, Delhi) will drop by 2 to 3 C.

7. Coastal Andhra Pradesh, Rayalaseem and Tamil Nadu will experience lower minimum temperatures by 1 to 2 C during 07 to 16 May.

Please observe basic precautions during this period in particular: eat smaller meals more often; drink water even when not thirsty; avoid tea, coffee and alcohol; plan your activities to avoid being outdoors during 11am to 4pm; do not leave children in cars by themselves; keep a watch on the elderly especially those who are infirm or invalid; wear non-synthetic non-polyester light-coloured and loose fitting clothes; if working outdoors rest frequently; provide drinking water and shade to animals and pets.

Filed Under: Current Tagged With: Bharat, climate, drought, forecast, heat, heat wave, IMD, India, India Meteorological Department, temperature, water

Why we need to save water right now

April 16, 2016 by Climate portal editor Leave a Comment

ICP_reservoirs_20160417

Every week, the Central Water Commission release the “live storage” data. By this the Commission means the quantity of water stored in what are called the 91 major reservoirs of India. From this group of what are also called the big dams – they are the biggest in the country – 37 have hydro-electric power plants attached that use the flow of water to generate electricity.

Together the 91 reservoirs can store, if they were full, 157.799 billion cubic metres (BCM). This amount is calculated as being about  62% of the entire “live storage” capacity of 253 BCM which is estimated to have been built as dams in India.

The CWC’s latest bulletin of 13 April 2016 delivers to us an immediate warning: the water stored in these major reservoirs together is under a quarter of their full storage level. The combined quantity stands at 35.839 BCM, which is 23% of the total live storage capacity of these reservoirs. This quantity is 67% of what was stored at this time last year, and is 77% of the average for ten years that is stored at this time of the year. This means we have less stored water compared with last year and compared with the ten year average for this time of year.

Here follows our sequence of alerts put out over the @indiaclimate Twitter feed:

Today, the 91 major reservoirs together hold 35.83 billion cubic metres (bcm) of #water. When all full they can hold 157.79 bcm

— Indiaclimate (@Indiaclimate) April 16, 2016

The total #water stored now is 23% of full storage by all the 91 reservoirs, and is 67% of the storage at this time last year. — Indiaclimate (@Indiaclimate) April 16, 2016

And moreover the total #water stored now is 77% of the average storage at this time for the last ten years. Now for the charts.

— Indiaclimate (@Indiaclimate) April 16, 2016

Water saving measures must immediately be followed by all households. Town and city municipal corporations and councils must immediately ask residents to reduce their use of water especially on activities like washing cars, watering lawns and swimming pools. District administrations need to immediately implement contingency plans for conserving water.

This chart shows the full reservoir level (blue) and current #water storage level (orange) for dams (by size) 69-91 pic.twitter.com/9LGQIddla6 — Indiaclimate (@Indiaclimate) April 16, 2016

Second chart: full reservoir level (blue) and current #water storage level (orange) for dams (by size) 46-68 pic.twitter.com/liMPJKoqfY

— Indiaclimate (@Indiaclimate) April 16, 2016

Third chart: full reservoir level (blue) and current #water storage level (orange) for dams (by size) 23-45 pic.twitter.com/CKjHboXIF4 — Indiaclimate (@Indiaclimate) April 16, 2016

Fourth chart: full reservoir level (blue) and current #water storage level (orange) for dams (by size) 1-22 pic.twitter.com/1UcvS5QJrE

— Indiaclimate (@Indiaclimate) April 16, 2016

Filed Under: Blogs, Current Tagged With: Bharat, big dam, Central Water Commission, India, reservoir, water, water resources, water shortage

March heat patterns in India

March 25, 2016 by Climate portal editor Leave a Comment

Temperature anomalies expected for March 25-31 in India

From now until the end of March 2016, the maximum temperature anomalies will be less than what has been experienced in March until the 24th.

The India Meteorological Department’s (IMD) numerical weather prediction service has however shown that maximum temperatures will still be above normal by 1 to 3 Celsius over most of central and northern India between 25 and 31 March.

We find that when read with the minimum temperature anomalies, most of peninsular, central and northern India have in March experienced an upward shift in overall temperatures by 1 to 3 Celsius. The meteorological sub-divisions of Telengana, Rayalaseema and coastal Andhra Pradesh in particular stand out for higher minimum temperatures.

Over the last week, maximum temperatures were markedly above normal (5.1° C or more) at most places over West Rajasthan; at many places over Uttarakhand and East Rajasthan; at a few places over Gujarat  and at isolated places over Madhya Pradesh; appreciably above normal (3.1°C to 5.0°C) at most places over Haryana, Chandigarh and Delhi; at many places over Punjab, rest Gujarat and West Madhya Pradesh.

Maximum temperatures were also appreciably above normal at a few places over Madhya Maharashtra and at isolated places over Marathawada, Vidarbha and Kerala; above normal (1.6°C to 3.0°C) at most places over Rayalaseema and West Uttar Pradesh; at many places over Tamil Nadu, Interior Karnataka, East Madhya Pradesh, and the north-eastern states.

Filed Under: Current, Latest Tagged With: 2016, climate, heat, India, summer, temperature

Join a climate chat with the minister

October 25, 2015 by Climate portal editor Leave a Comment

ICP_mygov_201510

MyGov.in which is the citizen-centric platform that connects people with the Government of India is holding a MyGov Talk event with Prakash Javadekar, Minister for Environment, Forest and Climate Change on 26 October at 5 pm.

This is a part of the preparations the central government and the Ministry of Environment are making as the Conference of Parties (COP) 21 meeting draws nearer (30 November to 11 December). The MyGov Talk is intended to seek the views and suggestions of citizens on the proposals contained in the Intended Nationally Determined Contribution (INDC) plan submitted to the UNFCCC by India.

With India’s Intended Nationally Determined Contribution (INDC), the country is keen to attempt to work towards a low carbon emission pathway, while simultaneously endeavouring to meet all the developmental challenges that it faces today. The INDC aims at promoting clean energy, especially renewable energy, enhancement of energy efficiency, development of less carbon intensive and resilient urban centres, promotion of waste to wealth, safe, smart and sustainable green transportation network, abatement of pollution and India’s efforts to enhance carbon sink through creation of forest and tree cover.

Climate Change experts, senior journalists and social media influencers will join the online panel discussion with Javadekar.  Citizens are invited to share their ideas, questions and inputs on India’s role in COP 21 and on the following proposals laid down by Intended Nationally Determined Contribution (INDC):

Sustainable Lifestyles
Cleaner Economic Development
Reduce Emission intensity of Gross Domestic Product (GDP)
Increase the Share of Non-Fossil Fuel Based Electricity
Enhancing Carbon Sink (Forests)
Adaptation
Mobilising Finance
Technology Transfer and Capacity Building

Selected ideas and names would also be mentioned by the minister and other experts during the MyGov Talk. Also see ‘India spells out a climate action plan’.

Filed Under: Announcements, Current Tagged With: carbon, Climate Change, COP21, emissions, INDC, India, Javadekar, renewable energy, UNFCCC

Lessons of monsoon 2015 for district India

September 16, 2015 by Climate portal editor 2 Comments

ICP_rainweek_commentary_20150916

By our conventional method of reckoning the adequacy of the 2015 monsoon, this is a year that is amongst the most deficient in rain over a period of 20 years. The monsoon season began late, compared with its usual onset, and apart from a few sustained heavy spells in a few locations, has been less than adequate and also less than normal in every one of our 36 meteorological sub-divisions.

When after eight weeks of the conventional monsoon season it became evident that a combination of factors was causing weak and erratic rainfall, that is when the central and state governments needed to place on alert the regions that were already facing rainfall deficits. At this point, when we have the evidence provided by data for 15 weeks of the monsoon season (until 9 September), every week from early August onwards that passed without such a declaration is a week of preparation and coping lost.

In this commentary, I have described the advantages of using a new methodology that grades rainfall adequacy at the level of the district, to a degree that is very much finer than the five categories of the India Meteorological Department (IMD), which are: normal, excess, deficient, scanty and no rain. The outputs from this methodology (illustrated and described here) are designed to: (1) alert national food and agriculture administrators to impending food insecurity conditions; (2) alert national water resources administrators to impending water scarcities; (3) alert line departments of state ministries and district collectorates to the build up of climatological distress at the district level so that contingency measures can be taken.

RG_2015_rainweek_graphic3Over the conventional season (1 June to 30 September) the inadequacy of rainfall in 2015 is revealed at a glance by the weekly rain report. It makes for a very alarming picture and shows that state administrations and especially district authorities should, by the sixth week which ended on 8 July, have made arrangements to prepare for below-normal rains. In the weekly rain report, each vertical bar corresponds to a week of districts categorised into eleven grades. This provides a weekly national barometer of the number of districts that are in the lower and upper (severely below and above normal rainfall) categories during a given week.

Such a weekly rainfall adequacy report is able to quickly put a stop to the recent tendency of administrations, the media and all those who must manage natural resources (particularly our farmers), to think in terms of an overall seasonal ‘deficit’ or an overall seasonal ‘surplus’. This ‘seasonal’ view must be abandoned because demands for water are not cumulative – they are made several times a day, and become more or less intense according to a cropping calendar, which in turn is influenced by the characteristics of a river basin and of a corresponding agro-ecological zone, and the rural and urban populations in a district.

The difference between the IMD five-grade assessment and the eleven-grade categorisation of rainfall becomes immediately apparent when a comparison is made for any given week. The data source is the same – the weekly tabulation compiled by the IMD’s Hydromet Division (which from this monsoon season provides the data sheets and detailed maps on its ‘customised rainfall information system’, or CRIS, website).

RG_ICP_grade_systems_comparedWeek 11 of the monsoon season, which is the week until 12 August, provides such an example. Under the five-grade IMD scale, there were 114 districts with normal rain (from -19% to +19%). Under the 11-grade new categorisation, the middle grade is -10% to +10%, and included 66 districts. Under the five-grade IMD scale districts with below normal rainfall fall under deficient (-20% to -59%) or under scanty (-60% to -99%) and for this week the number of districts respectively were 155 and 223. Under the 11-grade new categorisation, there are four grades for below-normal rainfall that is -20%.

Thus while the ‘deficient’ grade includes 155 districts, under the 11-grade system there are 150 districts distributed between two grades – 84 and 66, but we see that a larger number of districts fall in the more severe of the two grades. The signal to be derived from this, at the state and districts administration level, is that if a district remains for two to three weeks at a grade, then contingency measures must be reviewed, readied or rolled out. This is a decision that becomes considerably easier with the 11-grade system when compared with the existing five-grade system.

In the same way, the week by week tabulation of districts under the 11-grade system reveals trends and patterns that are not visible under the existing IMD five-grade assessment. The table shows the distribution of districts by grade across weeks. In each week, the two grades that account for the largest number of districts are highlighted red. We see that for the the first five rain weeks – week ending 3 June to week ending 1 July – the +81% and above grade was one of the top two populated grades. This occurred once more for Week 7, ending 15 July. For the next eight rain weeks – ending 22 July to ending 9 September – the top two populated grades have been in the rainfall grades of -41% to -60%, -61% to -80% and -81% and less. At the country level, this starkly underlines the seriousness of the rainfall deficit.

RG_ICP_weekly_tableThe uses to which we have put available climatic observations no longer suit an India which is learning to identify the impacts of climate change. Until 2002, the monsoon season was June to September, there was an assessment in May of how well (or not) the monsoon could turn out.

The India Meteorology Department has added computational and analytical resources furiously over the last decade. The new research and observational depth is complemented by the efforts of a Ministry of Earth Sciences which has channelled the copious output from our weather satellites, under the Indian Space Research Organisation (ISRO), and which is interpreted by the National Remote Sensing Centre (NRSC), to serve meteorological needs.

The IMD, with 559 surface observatories, 100 Insat satellite-based data collection platforms, an ‘integrated agro-advisory service of India’ which has provided district-level forecasts since 2008, a High Performance Computing System commissioned in 2010 (whose servers run at Pune, Kolkata, Chennai, Mumbai, Guwahati, Nagpur, Ahmedabad, Bengaluru, Chandigarh, Bhubaneswar, Hyderabad and New Delhi) intelligently consumes an astonishing amount of numerical data every hour.

Over the last four years, more climate and weather ‘products’ (as the IMD system calls them) based on this data and their interpretations have been released via the internet into the public domain. These are reliable, timely (some observation series have even three-hour intervals), and valuable for citizen and administrator alike.

Even so, the IMD’s framing of how its most popular measures are categorised is no longer capable of describing what rain – or the absence of rain – affects our districts. These popular measures are distributed every day, weekly and monthly in the form of ‘departures from normal’ tables, charts and maps. The rain adequacy categories are meant to guide alerts and advisories.

These number four: ‘normal’ is rainfall up to +19% above a given period’s average and also down to -19% from that same average, ‘excess’ is +20% rain and more, ‘deficient’ is -20% to -59%, ‘scanty’ is -60% to -99%, and ‘no rain’ is -100%. These categories can mislead more than they inform, for the difference between an excess of +21% and an excess of +41% can be the difference between water enough to puddle rice fields and a river breaking its banks to ruin those fields.

In today’s concerns that have to do with the impacts of climate change, with the increasing variability of the monsoon season, and especially with the production of food crops, the IMD’s stock measurement ‘product’ is no longer viable. It ought to have been replaced at least a decade ago, for the IMD’s Hydromet Division maintains weekly data by meteorological sub-division and by district. This series of running records compares any given monsoon week’s rainfall, in a district, with the long period average (a 50-year period). Such fineness of detail must be matched by a measuring range-finder with appropriate  interpretive indicators. That is why the ‘no rain’, ‘scanty’, ‘deficient’, ‘normal’ or ‘excess’ group of legacy measures must now be replaced. In its place an indicator of eleven grades translates the trends, patterns and messages in IMD’s district-level rainfall data into meaningful and actionable signals.

– Rahul Goswami

Notes

The new 11-grade indicator for assessing weekly rainfall departures in districts uses the same data IMD releases into the public domain, but provides dramatically more useful guidance. This yields the detailed reading required to alert state administrations to drought, drought-like and potential flood conditions. The modified methodology adapts the UN Food and Agriculture Organisation’s ‘Global Information and Early Warning System’ employment of 11 grades.

The weekly tallies of rainfall distribution for meteorological sub-divisions and for states are no longer able to signal administrative action and must be replaced with district-scale and (by 2016 monsoon) urban-scale assessments. The ability of the new 11-grade methodology to provide early warnings of climatic trauma in districts is now clear, and state administrations can respond to growing climatological distress in a targeted manner. Districts and blocks need to be supplied rainfall trends – and not only distribution data – that help farmers and administrators alike better plan for rainfall variability.

Filed Under: Current, Monsoon 2015 Tagged With: 2015, agriculture, district, India, monsoon, rain, water

Two years of India’s weather watcher

July 28, 2015 by Climate portal editor Leave a Comment

ICP_insat3d_2years_sm_20150728

We wish Insat-3D a very happy second birthday and warmly congratulate the Indian Space Research Organisation (ISRO) on this anniversary.

Insat-3D completed two successful years in orbit on 26 July 2015. The Advanced Weather Satellite is designed for enhanced meteorological observations and monitoring of land and ocean surfaces for weather forecasting and disaster warning. Insat-3D is the first Indian geostationary satellite equipped with instruments that provide frequent good quality atmospheric profiles (temperature, humidity) over the Indian landmass and adjoining areas.

Thanks to the coordination between ISRO and the Indian Meteorological Department (IMD), we at India Climate Portal make heavy and frequent use of the many observational products, all free in the public domain, to inform you about weather and climate.

icp-insat3d-detailInsat-3D provides us high quality observations for monitoring and predicting of weather events as well as studying our climate. The advanced ‘Imager’ and ‘Sounder’ on the satellite provide a wide range of atmospheric products such as cloud coverage images, atmospheric winds, sea and land surface temperatures, humidity, quantitative rainfall, earth’s radiation, atmospheric profiles, ozone, atmospheric stability parameters, fog, snow, aerosols. These products are immensely helpful in monitoring day-to-day weather and prediction of extreme events like tropical cyclone, thunderstorm, cloud burst and heat waves.

The ‘Imager’ has completed 25,733 scans and ‘Sounder’ has completed 14,866 scans until the end of May 2015. The Insat-3D spacecraft was dedicated to the country at the National Satellite Meteorological Center (NCMC), India Meteorological Department (IMD), New Delhi on 15 January 2014. An indigenously designed and developed Insat-3D Meteorological Data Processing System processes all data transmitted by the Imager and Sounder. The data archival and dissemination is through IMD, New Delhi and the Meteorological and Oceanographic Satellite Data Archival Centre (MOSDAC, at Space Applications Centre, Ahmedabad).

A number of Insat-3D observations and derived products are being used in models operated by national weather prediction agencies like the IMD and the National Centre for Medium Range Weather Prediction (NCMRWF). Moreover, the European Centrer for Medium range Weather Forecast (ECMWF) and the United Kingdom Meteorological Office (UKMET) plan to use Insat-3D derived data in their global models.

As always, the ISRO family, staff, engineers, scientists and technicians excel at what they do best. In tandem with the committed and dilligent meteorologists of the IMD, they have given us free information, as good as the best the world can offer, so that we understand our Bharat better.

Filed Under: Current Tagged With: earth observation, earth science, forecast, India, insat, ISRO, satellite

  • 1
  • 2
  • 3
  • 4
  • Next Page »

Indiaclimate twitter

Tweets by @Indiaclimate

Notable

Between contemplation and climate

Whether or not the USA, Europe, the Western world, the industrialised Eastern world (China, Japan, South Korea, Taiwan), adhere to or not their paltry promises about being more responsible concerning the factors that lead to climate change, is of very little concern to us. We have never set any store by international agreements on climate […]

The ‘Hindu’, ignorant about weather and climate, but runs down IMD

We find objectionable the report by ‘The Hindu’ daily newspaper accusing the India Meteorological Department of scientific shortcoming (‘IMD gets its August forecast wrong’, 1 September 2016). The report claims that the IMD in June 2016 had forecast that rains for August would be more than usual but that the recorded rain was less than […]

dialogue

  • Misreading monsoon | Resources Research on Misreading monsoon
  • Satish on A tribute to the weathermen of Bharat
  • Climate portal editor on A tribute to the weathermen of Bharat
  • Climate portal editor on A tribute to the weathermen of Bharat
  • Climate portal editor on A tribute to the weathermen of Bharat

Categories

Copyright © 2025 indiaclimateportal.org.