The India Climate Observatory

Commentary, action and research on climate and development in India

  • Home
  • About
  • Monsoon 2018
  • Current
  • Bulletin
  • Contact
  • Announcements

Three views of monsoon 2018

May 14, 2018 by Climate portal editor Leave a Comment

The India Meteorological Department (IMD) on 16 April had issued its first long range forecast for the 2018 South-West Monsoon season, which the IMD has historically taken to be 1 June to 30 September. The IMD had said that the “monsoon seasonal rainfall is likely to be 97% of the Long Period Average with a model error of ± 5%”. The IMD had also said that its forecast “suggests maximum probability for normal monsoon rainfall (96%-104% of the long period average) and low probability for deficient rainfall during the season”.

In early June, the IMD will issue its second long range forecast for the 2018 monsoon. Until then, we have studied three of the more reliable (in our view) international multi-model ensemble forecasts for the monsoon. What are ensemble forecasts? Each consists of several separate forecasts (some ensembles use 50) forecasts made by the same computer model – these are run on super-computers such as the High Performance Computer System of the Ministry of Earth Sciences (one is at the Indian Institute of Tropical Meteorology in Pune with 4.0 petaflops capacity and the other at the National Centre for Medium Range Weather Forecasting in Noida with 2.8 petaflops capacity).

The MME forecast is based on estimated precipitation anomalies relative to the period 1993-2016, based on initial conditions calculated at the beginning of May 2018. Four blocks of three months each.

The separate forecasts that make up one ensemble are all activated from the same starting time. The starting conditions for each differ from each other to account as far as possible for the staggering number of climatological, atmospheric, terrestrial and oceanographic variables that affect and influence our monsoon. The differences between these ensemble members tend to grow as the forecast travels two, three, four and more months ahead of the present.

We have considered the ensemble forecasts for the 2018 monsoon of the Multi-Model Ensemble (MME) of the USA National Centers for Environmental Prediction, the NOAA Climate Prediction Center and the European Centre for Medium-Range Weather Forecast (ECMWF). In this order, we find that the MME is optimistic, the NOAA CPC is largely neutral and the ECMWF forecast is somewhat pessimistic. The forecasting periods are in blocks of three months.

Here are the details:

(1) The MME forecast, precipitation anomalies relative to the period 1993-2016, based on initial conditions calculated at the beginning of May 2018.
June July August (JJA) – west coast and Konkan, coastal Andhra Pradesh and Odisha, West Bengal, part of the North-East, the entire upper, middle and lower Gangetic region (Uttarakhand, Himachal, Uttar Pradesh, Bihar, Jharkhand), Madhya Pradesh, Chhattisgarh, Maharashtra and Telengana to have up to +1 mm/day. Rest of India other than Gujarat (-0.5 mm/day) normal.
July August September (JAS) – Gujarat to have up to -1 mm/day, Rajasthan up to -0.5 mm/day, Sikkim, Brahmaputra valley and Arunachal Pradesh up to -0.5 mm/day. Himachal Pradesh and Uttarakhand up to +0.5 mm/day, Madhya Pradesh, Odisha, Chhattisgarh, Jharkhand and West Bengal up to +0.5 mm/day. Andhra Pradesh and Tamil Nadu up to -0.5 mm/day.
August September October (ASO) – Gujarat up to -0.5 mm/day. Tamil Nadu up to -1 mm/day. Kerala and adjacent Karnataka up to -0.5 mm/day. Madhya Pradesh, Chhattisgarh, Odisha, West Bengal up to +1 mm/day. Tripura, Mizoram, Manipur, Nagaland, Uttarakhand, Himachal Pradesh up to +0.5 mm/day
September October November (SON) – Tamil Nadu, Kerala and adjacent Karnata up to -1 mm/day. Maharashtra, Madhya Pradesh, Chhattisgarh, Odisha, West Bengal, Himachal Pradesh and Uttarakhand up to +0.5 mm/day.

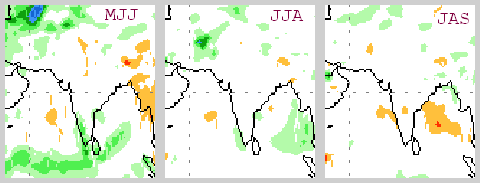
The NOAA CPC forecast is based on estimated seasonal precipitation anomalies using initial conditions of 30 April 2018 to 9 May 2018. Three blocks of three months each.

(2) The NOAA CPC forecast, seasonal precipitation anomalies using initial conditions of 30 April 2018 to 9 May 2018.
May June July (MJJ) – for most of India a normal reading (+0.5 to -0.5 mm/day fluctuation) and for the west coastal, Konkan, Kerala, south Tamil Nadu and coastal Andhra Pradesh areas variation of up to +1.5 mm/day.
June July August (JJA) – for most of India a normal reading (+0.5 to -0.5 mm/day fluctuation).
July August September (JAS) – normal for most of India. Some areas in the central Deccan plateau, on the west coast and east coast variation of up to -1 mm/day.

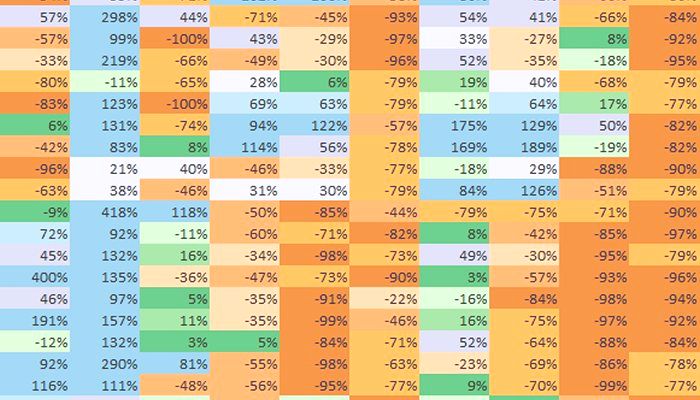
The ECMWF forecast is based on estimated mean precipitation anomaly based on climate period data of 1993-2016 and initial conditions as on 1 May 2018. Four blocks of three months each.

(3) The ECMWF forecast, mean precipitation anomaly based on climate period data of 1993-2016 and initial conditions as on 1 May 2018.
June July August (JJA) – all of the southern peninsula and part of the Deccan region (Kerala, Tamil Nadu, Karnataka, Andhra Pradesh, part of Telengana up to -100 mm for the period. West Bengal, Bihar, Jharkhand, Uttar Pradesh up to +100 mm for the period.
July August September (JAS) – all of the southern peninsula and the Deccan region – Kerala, Tamil Nadu, Karnataka, Andhra Pradesh, part of Telengana and Maharashtra up to -100 mm for the period.
August September October (ASO) – Maharashtra, Telegana, Andhra Pradesh and Karnataka up to -100 mm for the period.
September October November (SON) – Central and western India, eastern states and entire Gangetic region up to -50 mm for the period.

Rahul Goswami

Filed Under: Latest, Monsoon 2018 Tagged With: 2018, earth sciences, forecast, IMD, India, meteorology, monsoon

Vidarbha’s monsoon secret comes out in our innovative new rainfall index

August 18, 2017 by Climate portal editor Leave a Comment

Monsoon rains in Vidarbha better than the rains in Konkan Maharashtra? How can this be possible? Especially when the average rainfall for the seven districts of Konkan Maharashtra, over 1 June to 9 August, is 1,812 mm and the average rainfall for the 11 districts of Vidarbha Maharashtra is 427 mm over the same period?

The measure that we are piloting is not based on the cumulative totals, for each district during each week of monsoon 2017, but for how adequate the rainfall has been over each week. What does that mean? Maharashtra’s Konkan region receives over four times the amount of rainfall that Vidarbha does. This does not mean that Vidarbha is more ‘rain poor’ than Konkan Maharashtra. The two meteorological regions are different just as their agro-ecologies, soils, water retention structures and flora are different.

Because of this difference, it is more useful to us to judge how adequate rainfall has been over any given period of measurement. We have taken a week because that is what we have data for, as provided by the Department of Hydrometeorology or the Department of Agricultural Meteorology of the India Meteorological Department, Ministry of Earth Sciences.

If you examine the cumulative totals – this means the running totals which from one week to the next carry over extras or deficits – the picture is as follows. One district only (Mumbai City) of the seven in Konkan Maharashtra is deficit (with -22%), all the rest being ‘normal’ in the range of -19% to +22%. The cumulative measurement picture for Vidarbha is this: only four out of the 11 districts (Buldana, Gadchiroli, Nagpur and Wardha) are ‘normal’ and in the range of -15% to -19%. The remaining seven are ‘deficit’ in the range of -23% to -36% (Amravati and Yavatmal being the lowest).

The weakness of the cumulative measure is that it ‘carries forward’ deficits and surpluses. A deficit in weeks 3 and 4 can be ‘made up’ for by better rains in week 5 and 6. But when rain in weeks 3 and 4 are important for a particular phase of a crop’s growth, the surplus that follows is of little use.

That’s where this pilot measure, what I have called the ‘rainfall adequacy index’, comes in. It indexes normalcy and variation from normalcy, plus or minus, and so records how adequate every week has been for the district. Using this method, we find that among Maharashtra’s meteorological regions, it is Vidarbha that has done best over 1 June to 9 August, followed by Konkan Maharashtra, then by Madhya Maharashtra and with Marathwada last.

The footnote is that the three districts with the best ‘rainfall adequacy index’ over this period are, in order, Sindhudurg, Nagpur and Wardha. The three districts with the worst index are Osmanabad, Nashik and both Thane and Palghar.

– Rahul Goswami

Filed Under: Latest, Monsoon 2017 Tagged With: 2017, agriculture, district, ecology, hydrometeorology, India, Konkan, Madhya Maharashtra, Maharashtra, Marathwada, monsoon, Mumbai, rainfall, Vidarbha, water

India becoming 1.4°C warmer until 2045

August 5, 2017 by Climate portal editor Leave a Comment

Launched in 2009 with the support of the Ministry of Earth Sciences (MoES), Government of India, the Centre of Climate Change Research (CCCR) is part of the Indian Institute of Tropical Meteorology (IITM) in Pune, Maharashtra. The CCCR focuses on development of new climate modelling capabilities in India and South Asia to address issues concerning the science of climate change.

The Centre has now released an ‘Interim Report on Climate Change over India’ which is intended to provide a brief overview of: (a) updated assessment of observed climate change over India, (b) future climate projections over India, (c) development of the IITM Earth System Model to better understand and quantify climate change and its regional impacts. The three topics, which are among the core research activities of the CCCR at IITM, have been presented as three chapters in this Interim Report, and an updated report is planned to be submitted later next year.

Assessments of impacts of climate change and future projections over the Indian region, have so far relied on a single regional climate model (RCM) such as the PRECIS RCM of the Hadley Centre, UK. While these assessments have provided inputs to various reports (INCCA 2010; NATCOMM2 2012), it is important to have an ensemble of climate projections drawn from multiple RCMs due to large uncertainties in regional-scale climate projections. Ensembles of multi-RCM projections driven under different perceivable socio-economic scenarios are required to capture the probable path of growth, and provide the behavior of future climate and impacts on various biophysical systems and economic sectors dependent on such systems. [The full report is available here (pdf).]

The Centre for Climate Change Research, Indian Institute of Tropical Meteorology (CCCR-IITM) has generated an ensemble of high resolution downscaled projections of regional climate and monsoon over South Asia until 2100 for the Intergovernmental Panel for Climate Change (IPCC) using a RCM (ICTP-RegCM4) at 50 km horizontal resolution, by driving the regional model with lateral and lower boundary conditions from multiple global atmosphere-ocean coupled models from the Coupled Model Intercomparison Project Phase 5 (CMIP5). The future projections are based on three Representation Concentration Pathway (RCP) scenarios (viz., RCP2.6, RCP4.5, RCP8.5) of the IPCC.

These high-resolution downscaled projections of regional climate over South Asia are generated as part of the International Programme called Coordinated Regional Downscaling Experiment (CORDEX) sponsored by the World Climate Research Programme. This chapter provides a synthesis of results from the CORDEX South Asia multi-RCM outputs, that allows us to interpret the strengths and limitations of future regional climate projections over India. This information is useful to reduce uncertainty of impact assessment estimates to an extent and provide a pan-Indian regional assessment for informed policy-making.

Key points

⊗ The all India mean surface air temperature change for the near-term period 2016–2045 relative to 1976–2005 is projected to be in the range of 1.08°C to 1.44°C, and is larger than the natural internal variability. This assessment is based on a reliability ensemble average (REA) estimate incorporating each RCM performance and convergence, and is associated with less than 16% uncertainty range.

⊗ The all India mean surface air temperature is projected to increase in the far future (2066–2095) by 1.35 ±   0.23°C under RCP2.6, 2.41 ± 0.40°C under RCP4.5 and 4.19 ± 0.46°C under RCP8.5 scenario respectively. These changes are relative to the period 1976–2005. The semi-arid north-west and north India will likely warm more rapidly than the all India mean.

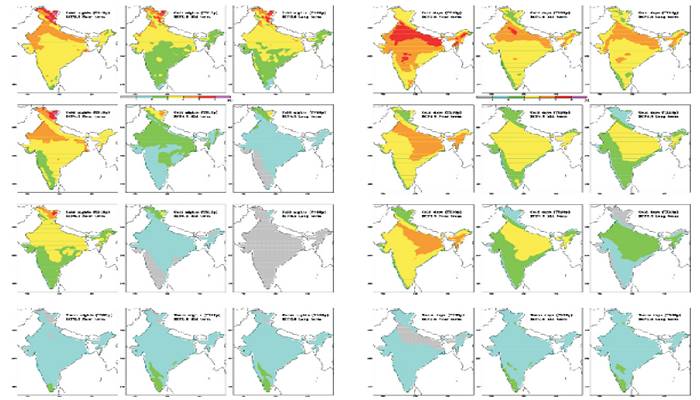
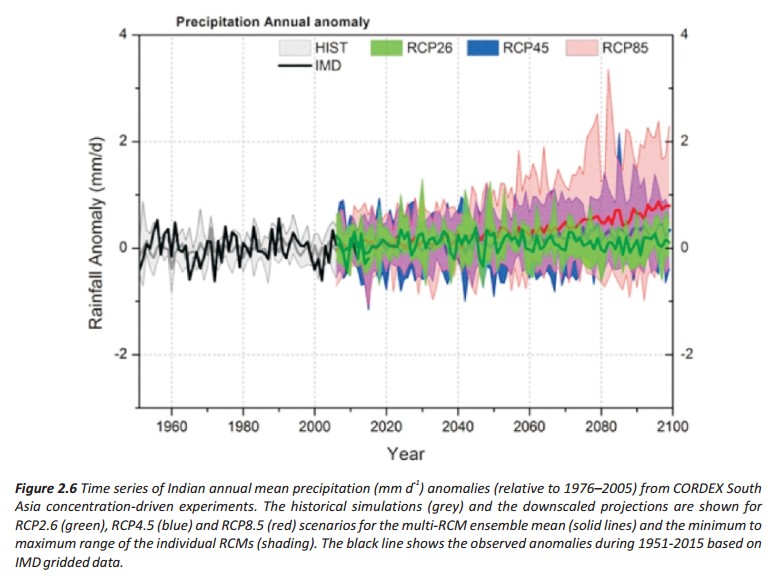
⊗ Monthly increase in all India mean surface air temperature based on REA estimate is relatively higher during winter months than in the summer monsoon months throughout the 21st century under the three RCP scenarios.

⊗ The REA changes for all India annual minimum temperature of 4.43 ± 0.34oC is more pronounced than that of 3.94 ± 0.45oC and 4.19 ± 0.46oC increases estimated for the respective annual maximum and mean temperatures respectively the end of the 21st century under RCP8.5 scenario. The models project substantial changes in temperature extremes over India by the end of the 21st century, with a likely overall decrease in the number of cold days and nights, and increase in the number of warm days and nights.

⊗ Although the all India annual precipitation is found to increase as temperature increases, the REA assessment indicates that precipitation changes throughout the 21st century remain highly uncertain.

⊗ The all India annual precipitation extremes are projected to increase with relatively higher uncertainty under RCP8.5 scenario by the end of the 21st century. The downscaled projections suggest that intensification of both dry and wet seasons is expected along the west coast of India and in the adjoining peninsular region.

The multi-RCM ensemble mean annual precipitation mid-term increase exceeds 10% over the west coast and the adjoining southern parts of the Indian peninsula for RCP4.5 scenario, while in the long-term the change for this mid-scenario exceeds 20% over the south-west coast and the adjoining Kerala state. The precipitation changes are not significant over the remaining parts of India for this mid-scenario up to the mid 21st century, however in long-term increase exceed 10% over north-west and adjoining parts of the country. The long-term projected annual precipitation increase exceeds 10% over most parts of India except in Jammu and Kashmir under RCP8.5 scenario, with relatively higher increase exceeding 30% projected along the west coast of India for this high-emission scenario by the end of 21st century.


Filed Under: Current Tagged With: Climate Change, earth sciences, earth system model, Hadley Centre, IITM, India, IPCC, MoES, precipitation, RCP, regional climate model, temperature, Tropical Meteorology

Rain for the Rani

July 2, 2017 by Climate portal editor Leave a Comment

We find that the heavy rains that soaked the north Gujarat plains on the night of 1/2 July are testimony to the genius and far-sightedness of the builders of the Rani-ki-Vav, the famed stepwell which was initially built as a memorial to a king in the 11th century AD. The central heavy rainfall zone was immediately to the north-west of Patan, the town nearest to the Rani-ki-Vav, and it is precisely for this sort of rain that this fabulously constructed stepwell was built.


Rain for the Rani. At about 8pm on 1 July, dense rainclouds hung over the entire north #Gujarat plains, from ancient Dholavira to Dahod ..2

— Indiaclimate (@Indiaclimate) July 2, 2017


..by 8:30 pm showers were being reported from towns in the region while farther north in #Rajasthan, heavy rain pelted Barmer and Jalor ..3

— Indiaclimate (@Indiaclimate) July 2, 2017


..Rain for the Rani. At around 9pm the rainfall had become very heavy, reaching 15mm/hour, quickly leaching into the parched soil ..4 pic.twitter.com/zHLFHzcVmH

— Indiaclimate (@Indiaclimate) July 2, 2017


..The cores of two cloud masses were converging. The heavy rain was now on two parallel fronts each about 300 km wide ..5 pic.twitter.com/gamGJtCQGp

— Indiaclimate (@Indiaclimate) July 2, 2017


.. Rain for the Rani. At around midnight the Rajasthan and Gujarat core rainfall zones merged and the intensity lessened #monsoon2017 ..6 pic.twitter.com/MCpROK4jLo

— Indiaclimate (@Indiaclimate) July 2, 2017


..On the ground, about 2 km outside the old town of Patan, the water levels in an 11th century structure were rising. This remarkable ..7

— Indiaclimate (@Indiaclimate) July 2, 2017


..well, the Rani Ki Vav, was sited, designed, engineered and adorned exactly for rains such as this !! Town streets flooded and cars ..8 pic.twitter.com/sKD03C7sYp

— Indiaclimate (@Indiaclimate) July 2, 2017


..stalled. But the old channels & chambers of the Rani Ki Vav were proving the vision and sagacity of the celebrated stepwell’s creators ..9

— Indiaclimate (@Indiaclimate) July 2, 2017


..Designed as an inverted temple highlighting the sanctity of water, the Rani Ki Vav combines #water storage with exceptional artistry ..10 pic.twitter.com/CWxBh2cyW7

— Indiaclimate (@Indiaclimate) July 2, 2017


..We marvel at the foresight and knowledge of the Vav’s builders. To the north and north-west of the stepwell lay the zone in which this .11

— Indiaclimate (@Indiaclimate) July 2, 2017


..torrent of rain fell over 1/2 July, recharging the subterranean water storage system whose design origin is the 3rd millennium BC ..12 pic.twitter.com/wEWYyCRgnu

— Indiaclimate (@Indiaclimate) July 2, 2017


..This is the 4 hour 30 min sequence of intense #monsoon2017 rainfall in north #Gujarat and adjacent #Rajasthan – Rain for the Rani pic.twitter.com/zeuKb6SCZG

— Indiaclimate (@Indiaclimate) July 2, 2017

Filed Under: Monsoon 2017, Reports & Comment Tagged With: 2017, Gujarat, heritage, India, monsoon, rain, Rajasthan, stepwell, traditional knowledge, water

A typical June for the 2017 monsoon

June 24, 2017 by Climate portal editor Leave a Comment

Three weeks of rainfall during the ‘official’ monsoon (which both within meteorological circles and outside is still said to begin on 1 June) season, we are now able to present the week by week trend.

The graphic (click for full size image) shows the distribution of districts according to our expanded measure for rainfall adequacy. We call this expanded as it has 12 categories (11 plus ‘no data’) which we debuted in 2015.

To be used mainly as a planning and response indicator – such as preparing for the consequences of a dry spell or readying contingency plans if continued heavy rainfall make flooding a likelihood – our expanded measure also provides a weekly snapshot of rainfall at the district level. These snapshots, which in the graphic take the form of coloured horizontal bars, when stacked together give us a trend.

The indiaclimate visualisation of rainfall distribution by districts using our 12-grade category scale.

What we see from the bars that represent district rainfall distribution for three weeks is that the 2017 monsoon has for this period been what the India Meteorological Department first forecast in April, and then confirmed in May: that this year’s monsoon will be normal.

In each horizontal bar the most important category is the one marked “+10% to -10%” as this is the ‘core’ normal range of 10% above and below the long-term average. Since our time-frame for each snapshot is one week, this means the long-term average rainfall for a district for that week. Next in importance are the two categories that follow, above and below. These are the “-11% to -20%” and “+11% to +20%” and may be interpreted as satisfactory.

Thus we see that for the week ending 07 June (the lowest bar) 41 districts recorded normal rainfall for that week, 22 recorded satisfactory (but below normal) and 15 recorded satisfactory (but above normal). The similar distribution the following week, that is ending 14 June and the middle bar, was 39, 26 and 11. And the distribution for the latest week, that is ending 21 June and the top bar, is 61, 35 and 21.

However as the monsoon has weakened over the last few days and may not regain its customary vigour for this time of the year until 27 or 28 June, we expect our next instalment to show more districts in the browner shades towards the left of the categories bar.

You can follow our monsoon data, graphics and commentary on both our website and twitter channel.

Filed Under: Latest, Monsoon 2017 Tagged With: 2017, India, monsoon, rain, trend

Between contemplation and climate

June 8, 2017 by Climate portal editor Leave a Comment

Whether or not the USA, Europe, the Western world, the industrialised Eastern world (China, Japan, South Korea, Taiwan), adhere to or not their paltry promises about being more responsible concerning the factors that lead to climate change, is of very little concern to us. We have never set any store by international agreements on climate change.

This year will see the twenty-third conference of parties of the UN Framework Convention on Climate Change and for 23 years the world and India have listened to lofty tales about simple science. In these 23 years, neither has reckless consumption been halted nor has the economic model that encourages such reckless consumption been questioned by the conference of parties. As long as they do not, inter-governmental agreements are useless.

That is why we find unnecessary and pointless the hand-wringing that has taken place about the decision of the government of the USA to exit what is called the ‘Paris Agreement’, the December 2015 document agreed to and signed by practically every country which has some fuzzy paragraphs about low-carbon economy, innovation, technology, energy and finance – all of which have very much to do with the hold of the finance capitalists and the global technocrats over the international systems of our time.

President number 45 of the USA is neither wiser than nor baser than the wisest of basest of any of his predecessors: the American political system has to do entirely with the desire to dominate other countries. Number 45’s manner may be irksome, but through him speaks the American finance capital, its bloatsome defence industry and its insensate technology industry.

We do not expect the chiefs of the Western countries, the so-called major powers of the European Union, and their allies such as Japan and Australia to do any less. They are no different. We do not think any of them, their armies of bland advisers, their bankers and the brigades of industrialists great and petty who crowd their corridors of governance have read, much less reflected, on the lambent wisdom of our civilisation.

Many centuries ago, in the section of the Digha Nikaya, or Collection of Long Discourses, called Samannaphala Sutta, or the Fruits of the Contemplative Life, it was written that there are those who are addicted to debates and shout: “You understand this doctrine and discipline? I’m the one who understands this doctrine and discipline. How could you understand this doctrine and discipline? You’re practicing wrongly. I’m practicing rightly. I’m being consistent. You’re not. What should be said first you said last. What should be said last you said first. What you took so long to think out has been refuted. Your doctrine has been overthrown. You’re defeated. Go and try to salvage your doctrine; extricate yourself if you can!”

And this is how we view what are called climate negotiations, between the experts of countries. We care not for the arguments of number 45 of the USA, for what many in the world in the last week have protested as being absurd – it undermines economy, it takes away jobs, it is unfair, it is disadvantageous to us, and so on – is what they cheer and support their own countries for in areas where they stand to gain, such as trade (to sell cheap and useless goods), technology (to enslave and control), finance (to spin webs of debt), processes of modernisation (to homogenise cultures so that ever more ‘markets’ come into being).

We in India need no such instruction. But we must guard against our philosophies being swept away by these agreements, these grand comities of nations, the barrage of numerics and scientifics that are invented to display to us what a threat we are should we not emulate the West and its ways. We must guard against our own who prefer the baubles of post-industrial society to the intellectual and spiritual riches of our civilisation, and who seek to infest India with the same technological and ‘modern’ wares that so entranced the West and doomed its folk. This has very little to do with climate and its change and very much more to do with our Indic sciences and their worth, our conduct and our duty to Punyabhoomi Bharat.

– Rahul Goswami

Filed Under: Blogs Tagged With: Bharat, civilisation, climate, Climate Change, convention, Europe, finance, India, Paris accord, Paris agreement, philosophy, technology, UN, UNFCCC, USA

Dry districts alert, May 2017

May 1, 2017 by Climate portal editor Leave a Comment

A large number of districts in south, peninsular, central and eastern India are experiencing dry and semi-arid conditions which will continue, and likely become worse, until the 2017 monsoon becomes active.

This list of districts is based on our re-working of the maps released weekly by the India Meteorological Department (Hydromet section in Pune), which show the district-level standardised precipitation index (or SPI). While this is not a drought or dryness index, the weekly SPI serves as a very reliable indicator of where water stress is occurring, and is therefore an invaluable aid for relief planning.

In this series of four maps, re-coloured by us to better display differences in SPI between regions and over time, the change in south India stands out.

Each map displays the SPI as a cumulative reading of the four weeks until the date given. That is why the change for any district – from ‘moderately dry’ to ‘severely dry’ for example – needs to be seen as having an immediate bearing on the available water, crop health and condition of forest and pasture for that district.

Based on the readings for 26 April 2017 this is the list of districts that need urgent attention.

Maharashtra: Gadchiroli, Chandrapur, Yavatmal, Kolhapur
Chhattisgarh (Raipur division): Gariaband, Raipur, Baloda Bazar
Odisha: Rayagada, Kandhamal, Angul, Cuttack
West Bengal: 24 Parganas North
Manipur: Chandel
Andhra Pradesh: Vizianagaram, Kurnool
Telengana (old district boundaries): Nizamabad, Karimnagar, Medak, Warangal, Khammam, Mahbubnagar
Karnataka: Bidar, Raichur, Bijapur, Bagalkot, Koppal, Gadag, Dharwad, Bellary, Shimoga
Tamil Nadu: Cuddalore, Nagapattinam, Tiruvarur, Thanjavur, Pudukkottai, Ramanathapuram, Toothukudi, Kaniyakumari, Theni, Coimbatore
Kerala: Malappuram, Thrissur, Ernakulam, Kottayam, Alapuzha

Filed Under: Latest Tagged With: 2017, Andhra Pradesh, arid, Bharat, district, drought, India, Karnataka, Kerala, Maharashtra, Odisha, summer, Tamil Nadu, Telengana, water

Big water storage wheel

April 29, 2017 by Climate portal editor Leave a Comment

The Central Water Commission, Ministry of Water Resources, Government of India, monitors every day the quantity of water stored (and used from) each of the 91 major reservoirs of the country. It issues a bulletin every week that gives the weekly storage position of these reservoirs – the volume of water, the level of water in the reservoir and the change from the last week, the change from the same date last year and from the average on this date of the last ten years.

The water storage capacity of these 91 reservoirs taken together is 157.799 billion cubic metres (bcm) which is estimated to be about 62% of the total water storage capacity (in other smaller dams and storage structures all over the country) that has been built and is being used, and which is approximately 253.38 bcm. Out of these 91 reservoirs, hydro-electric power stations (with a capacity of 60 megawatts and more) are attached to 37 reservoirs.

In this illustration by Indiaclimate, for the first time the total storage capacity of the 91 major reservoirs has been visually mapped to show reservoir, state and zone capacities relative to each other and the total.

These are the reservoirs with state, reservoir name and full reservoir level in billion cubic metres (bcm). For a good quality file that you can print, write to us.

South zone reservoirs (AP for Andhra Pradesh, TG for Telengana, APTG for Andhra Pradesh and Telegana together, KAR for Karnataka, TN for Tamil Nadu, KER for Kerala): AP, Somasila (1.994); TG, Sriramsagar (2.3); TG, Lower Manair (0.621); APTG, Srisailam (8.288); APTG, Nagarjuna Sagar (6.841); KAR, Krishnaraja Sagra  (1.163); KAR, Tungabhadra (3.276); KAR, Ghataprabha (1.391); KAR, Bhadra (1.785); KAR, Linganamakki (4.294); KAR, Narayanpur (0.863); KAR, Malaprabha (Renuka) (0.972); KAR, Kabini (0.444); KAR, Hemavathy (0.927); KAR, Harangi (0.22); KAR, Supa (4.12); KAR, Vanivilas Sagar (0.802); KAR, Almatti (3.105); KAR, Gerusoppa (0.13); KER, Kallada (Parappar) (0.507); KER, Idamalayar (1.018); KER, Idukki (1.46); KER, Kakki (0.447); KER, Periyar (0.173); KER, Malapmuzha (0.224); TN, Lower Bhawani (0.792); TN, Mettur (Stanley) (2.647); TN, Vaigai (0.172); TN, Parambikulam (0.38); TN, Aliyar (0.095); TN, Sholayar (0.143). Total for 31 reservoirs 51.59 bcm

West zone reservoirs (GUJ for Gujarat, MAH for Maharashtra): GUJ, Ukai (6.615); GUJ, Sabarmati (Dharoi) (0.735); GUJ, Kadana (1.472); GUJ, Shetrunji (0.3); GUJ, Bhadar (0.188); GUJ, Damanaganga (0.502); GUJ, Dantiwada (0.399); GUJ, Panam (0.697); GUJ, Sardar Sarovar (1.566); GUJ, Karjan (0.523); MAH, Jayakwadi (Paithon) (2.171); MAH, Koyana (2.652); MAH, Bhima (Ujjani) (1.517); MAH, Isapur (0.965); MAH, Mula (0.609); MAH, Yeldari (0.809); MAH, Girna (0.524); MAH, Khadakvasla (0.056); MAH, Upper Vaitarna (0.331); MAH, Upper Tapi (0.255); MAH, Pench (Totaladoh) (1.091); MAH, Upper Wardha (0.564); MAH, Bhatsa (0.942); MAH, Dhom (0.331); MAH, Dudhganga (0.664); MAH, Manikdoh (Kukadi) (0.288); MAH, Bhandardara (0.304). Total for 27 reservoirs 27.07 bcm

East zone reservoirs (JHR for Jharkhand, ODI for Odisha, WB for West Bengal, TRI for Tripura): JHR, Tenughat (0.821); JHR, Maithon (0.471); JHR, Panchet Hill (0.184); JHR, Konar (0.176); JHR, Tilaiya (0.142); ODI, Hirakud (5.378); ODI, Balimela (2.676); ODI, Salanadi (0.558); ODI, Rengali (3.432); ODI, Machkund (Jalput) (0.893); ODI, Upper Kolab (0.935); ODI, Upper Indravati (1.456); WB, Mayurakshi (0.48); WB, Kangsabati (0.914); TRI, Gumti (0.312). Total for 15 reservoirs 18.83 bcm

Central zone reservoirs (UP for Uttar Pradesh, UTT for Uttarakhand, MP for Madhya Pradesh, CHT for Chhattisgarh): UP, Matatila (0.707); UP, Rihand (5.649); UTT, Ramganga (2.196); UTT, Tehri (2.615); MP, Gandhi Sagar (6.827); MP, Tawa (1.944); MP, Bargi (3.18); MP, Bansagar (5.166); MP, Indira Sagar (9.745); MP, Barna (0.456); CHT, Minimata Bangoi (3.046); CHT, Mahanadi (0.767). Total for 12 reservoirs 42.30 bcm

North zone reservoirs (HP for Himachal Pradesh, PUN for Punjab, RAJ for Rajasthan): HP, Gobind Sagar (Bhakra) (6.229); HP, Pong Dam (6.157); PUN, Thein  (2.344); RAJ, Mahi Bajaj Sagar (1.711); RAJ, Jhakam (0.132); RAJ, Rana Pratap Sagar (1.436). Total for 6 reservoirs 18.01 bcm

Filed Under: Current Tagged With: agriculture, Bharat, dam, drinking water, hydel, hydro, India, irrigation, reservoir, water, water pump, water resources, water storage

In 2016, record new renewable energy added, and cheaply

April 12, 2017 by Climate portal editor Leave a Comment

Recent reports bring positive news related to renewable energy investment and the feasibility of a 100% renewable energy future. The UN Environment Programme (UN Environment, or UNEP), the Frankfurt School-UNEP Collaborating Centre, and Bloomberg New Energy Finance released a report titled ‘Global Trends in Renewable Energy Investment 2017,’ which finds that wind, solar, biomass and waste-to-energy, geothermal, small hydro and marine sources added 138.5 gigawatts to global power capacity in 2016, up 8% from the 127.5 gigawatts added in 2015.

The report indicates that as the cost of clean technology continues to fall, the world added record levels of renewable energy capacity in 2016, at an investment level 23% lower than the previous year. According to UN Environment, the added generating capacity roughly equals that of the world’s 16 largest existing power producing facilities combined.

Global Trends in Renewable Energy Investment 2017, published on April 6th by UN Environment, the Frankfurt School-UNEP Collaborating Centre, and Bloomberg New Energy Finance, finds that all investments in renewables totaled $241.6 billion (excluding large hydro). These investments added 138.5 gigawatts to global power capacity in 2016, up 9 per cent from the 127.5 gigawatts added the year before.

Investment in renewables capacity was roughly double that in fossil fuel generation; the corresponding new capacity from renewables was equivalent to 55 per cent of all new power, the highest to date. The proportion of electricity coming from renewables excluding large hydro rose from 10.3 per cent to 11.3 per cent. This prevented the emission of an estimated 1.7 gigatons of carbon dioxide.

The total investment was $241.6 billion (excluding large hydro), the lowest since 2013. This was in large part a result of falling costs: the average dollar capital expenditure per megawatt for solar photovoltaics and wind dropped by over 10 per cent.

Filed Under: Reports & Comment Tagged With: carbon, clean technology, electricity, energy, geothermal, hydro, photovoltaic, renewables, solar, UNEP

South India’s water emergency

April 11, 2017 by Climate portal editor Leave a Comment

ICP_res_20170410_topBy the end of the first week of April 2017, the most current and reliable indicator for stored water in south India showed how dire the situation has become. And the South-West monsoon is still about eight weeks away. The weekly data sheet on the stored water quantities in the 91 major reservoirs of India, which is maintained and released by the Central Water Commission, has in the 6 April 2017 release shown the scale of the water emergency.

Of the 31 reservoirs in the southern region (Kerala, Tamil Nadu, Karnataka, Telengana and Andhra Pradesh) that are among the major reservoirs of India, 18 have stored water that is less than 15% of their full capacities.

These 18 are (ranked by least water stored):
Nagarjuna Sagar, APTG, 0.00%
Sholayar, TN, 0.00%
Almatti, KAR, 0.03%
Kabini, KAR, 2.25%
Vanivilas Sagar, KAR, 2.74%
Tungabhadra, KAR, 3.21%
Vaigai, TN, 4.07%
Parambikulam, TN, 5.00%
Malaprabha (Renuka), KAR, 5.56%
Hemavathy, KAR, 5.72%
Mettur (Stanley), TN, 6.72%
Periyar, KER, 6.94%
Bhadra, KAR, 9.02%
Lower Bhawani, TN, 9.09%
Srisailam, APTG, 9.44%
Krishnaraja Sagar, KAR, 11.44%
Malapmuzha, KER, 11.61%
Aliyar, TN, 14.74%
(TN is Tamil Nadu, KER is Kerala, KAR is Karnataka, APTG is Andhra Pradesh and Telengana)

ICP_south_water_20170411

Using a municipal average of about 400 litres per day per household that is a typical designed supply (not delivered, for that’s another tale), how much water does this allow for the 60.51 million households of the southern region until the monsoon begins?

Tamil Nadu has 18.46 million households, Kerala has 7.83 million, Karnataka has 13.3 million, Andhra Pradesh and Telengana have 20.92 million. These together need 24.2 billion litres a day or, in reservoir storage terms, 0.024 billion cubic metres (bcm) a day. The 31 major reservoirs of southern India together have, as of 6 April 2017, 6.583 bcm. From this quantity is taken water for industrial, agricultural and commercial use.

These uses are given priority or water stocks are secured (never mind allocation and metering) especially by industry. Normally, what remains for household use is about a third of the available stock. This leaves, as on 6 April, about 2.19 bcm for household use, which will suffice the 60.51 million households of south India for about 90 days – but only provided, and this is the stringent, non-negotiable condition that must be enforced, all households especially urban keep within the 400 litres per household per day limit.

The situation does not improve even if the monsoon arrives on time and the first weeks deliver normal rainfall. It is only by July 5-15 that reservoir water stocks begin trending upwards. This is where the 90-day restricted supply can take south India to. But only if immediate and strict rationing is imposed, as it should have been, to allow for climatological variance, by 1 March 2017.

Filed Under: Latest Tagged With: Andhra Pradesh, Bharat, drought, India, Karnataka, Kerala, reservoir, Tamil Nadu, Telengana, water, water shortage, water supply

  • « Previous Page
  • 1
  • 2
  • 3
  • 4
  • …
  • 110
  • Next Page »

Indiaclimate twitter

Tweets by @Indiaclimate

Notable

Between contemplation and climate

Whether or not the USA, Europe, the Western world, the industrialised Eastern world (China, Japan, South Korea, Taiwan), adhere to or not their paltry promises about being more responsible concerning the factors that lead to climate change, is of very little concern to us. We have never set any store by international agreements on climate […]

The ‘Hindu’, ignorant about weather and climate, but runs down IMD

We find objectionable the report by ‘The Hindu’ daily newspaper accusing the India Meteorological Department of scientific shortcoming (‘IMD gets its August forecast wrong’, 1 September 2016). The report claims that the IMD in June 2016 had forecast that rains for August would be more than usual but that the recorded rain was less than […]

dialogue

  • Misreading monsoon | Resources Research on Misreading monsoon
  • Satish on A tribute to the weathermen of Bharat
  • Climate portal editor on A tribute to the weathermen of Bharat
  • Climate portal editor on A tribute to the weathermen of Bharat
  • Climate portal editor on A tribute to the weathermen of Bharat

Categories

Copyright © 2025 indiaclimateportal.org.